Preferential Times for Preferred Income Strategies?
Not all that glitters is gold
June 2023. Reading Time: 10 Minutes. Author: Nicolas Rabener.
SUMMARY
- Preferred income funds offer exceptionally high yields
- However, the higher the yield, the lower the total return
- The diversification benefits of these funds were limited
INTRODUCTION
Although the job of a stock analyst is not easy, fixed-income analysts have it arguably harder. Sure, there might be multiple share classes for a few stocks like Alphabet or Berkshire Hathaway, but equity is perpetual while fixed-income instruments mature and need to be refinanced on a regular basis. While equity analysts can focus exclusively on what is driving the equity value, fixed-income analysts often have to analyze various loans and bonds that each require reading lengthy prospectuses in order to understand the entire capital structure.
However, there are some instruments that sit between both asset classes namely high yield, mezzanine, and convertible debt, as well as preference shares. The first three of this list are covered by fixed-income analysts, while the latter is sometimes looked after by equity analysts.
Preference shares entitle investors to fixed or variable distributions that get paid before any dividends from the operating business are issued, but rank subordinate to debt. Given this, these instruments tend to offer exceptionally high yields. However, not all that glitters is gold and high yields are often associated with high risks. In this research note, we will explore preferred income funds.
UNIVERSE
We focus on all preferred income funds trading in the US with a minimum track record of five years. This universe includes a total of 36 mutual funds and ETFs that manage approximately $60 billion of assets.
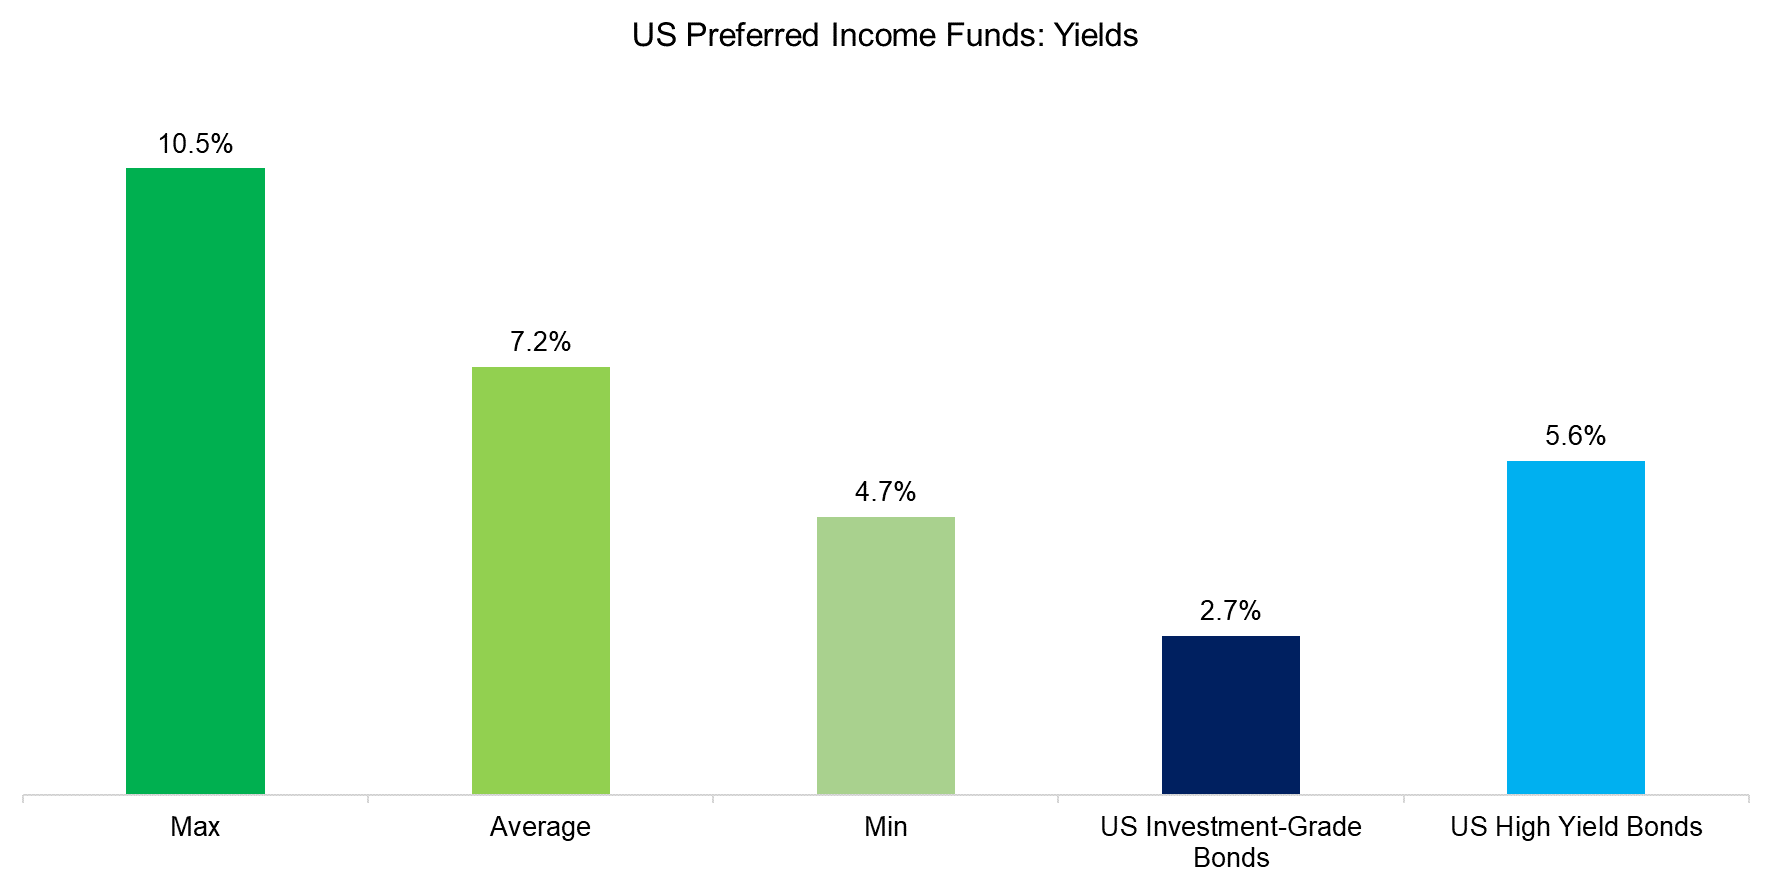
The yields of preferred income funds are significantly higher than US investment-grade and high-yield bonds, which explains their popularity with yield-seeking investors. The average management fee of 1.23% indicates that these funds are primarily sold to non-price-sensitive retail investors (read Resist the Siren Call of High Dividend Yields).
Source: Finominal
FACTOR EXPOSURE ANALYSIS
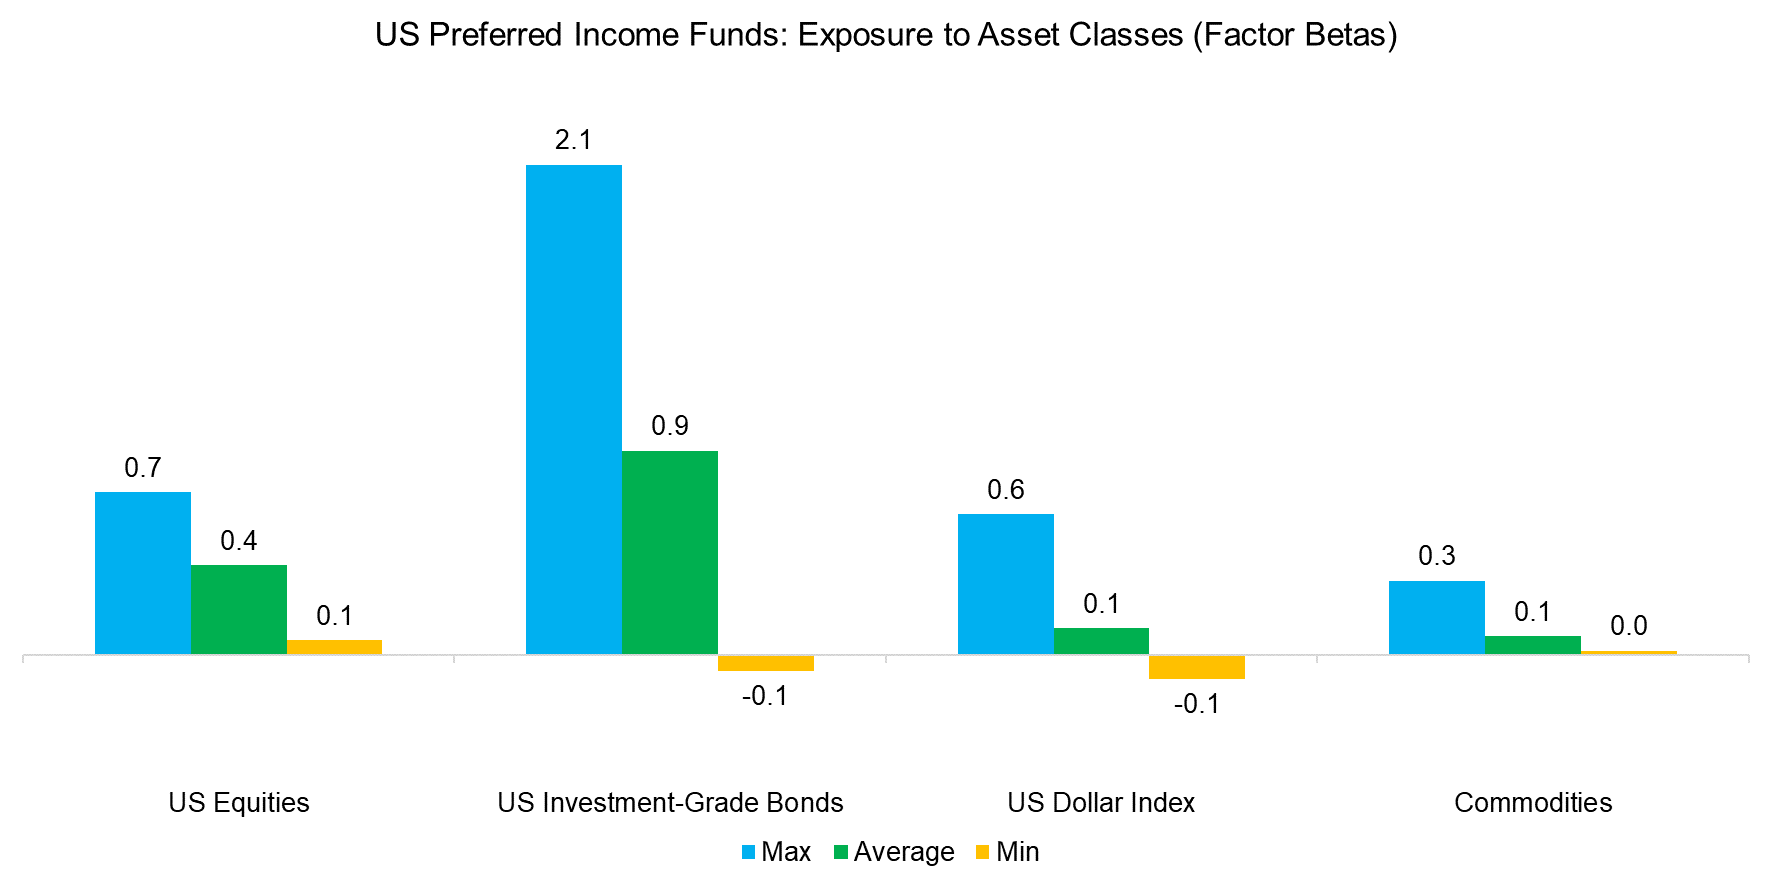
Given that preferred shares rank higher than equity but lower than bonds, it is not entirely clear on what explains their performance. We run a simple factor exposure analysis using asset class indices and equity factors.
We observe a low beta to US stocks, moderate beta to US investment-grade bonds, and low exposures to the US Dollar and commodities. As expected, preferred shares are a hodgepodge of asset classes.
Source: Finominal
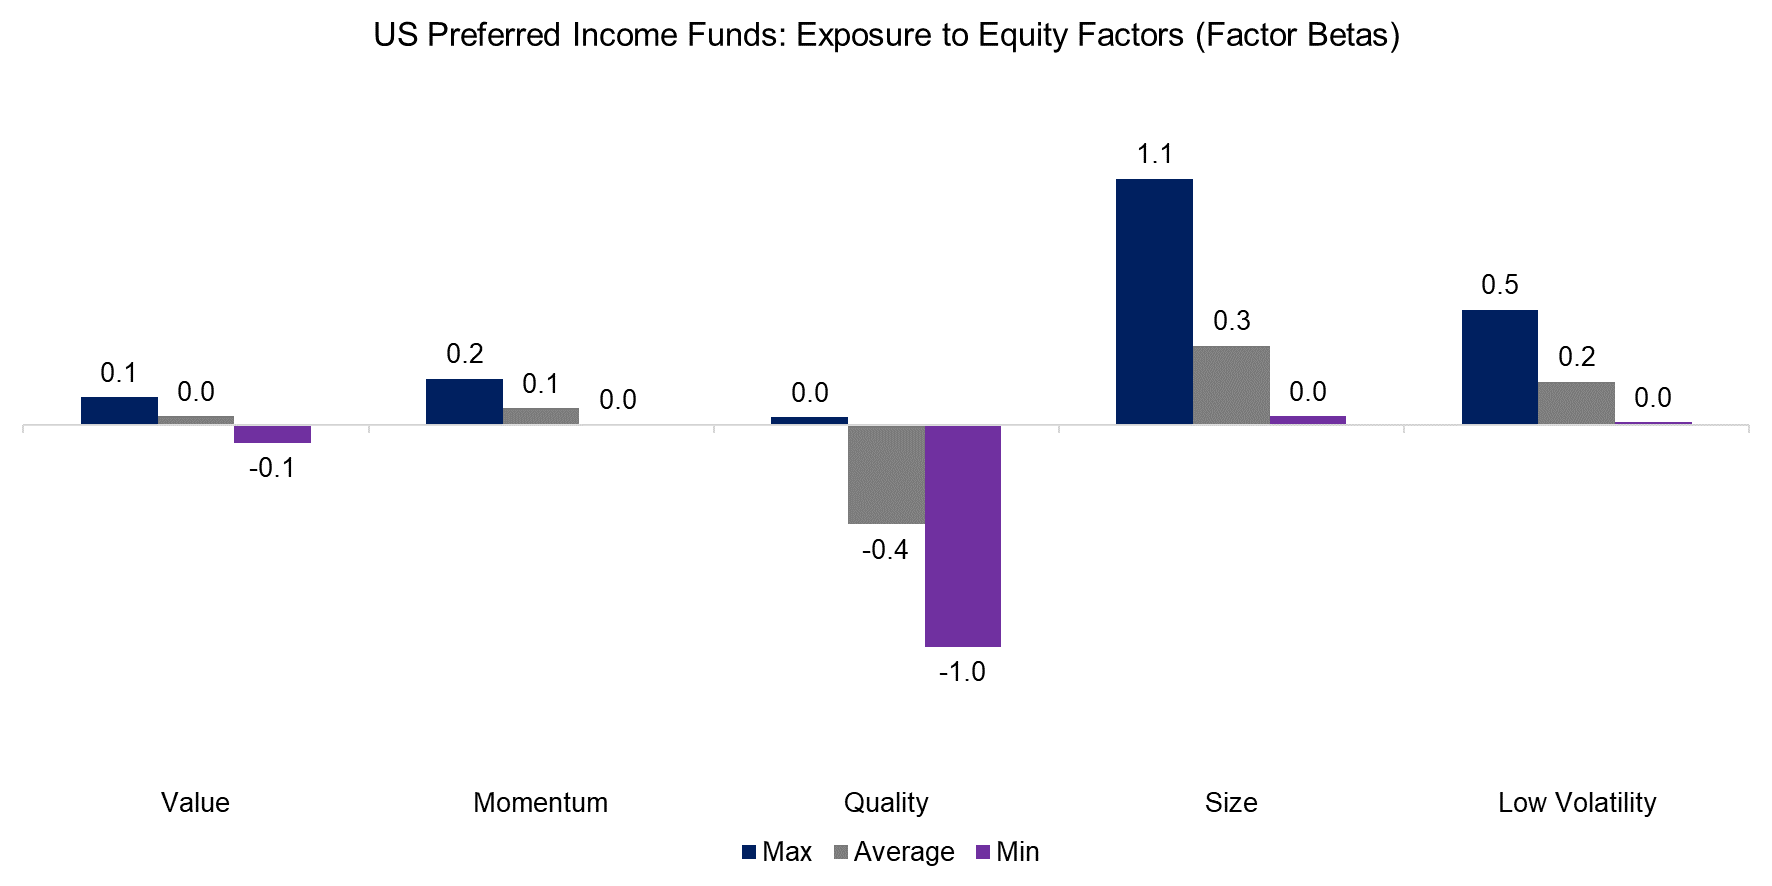
Reviewing the exposure to equity factors highlights low exposures to value and momentum, negative exposure to quality, and positive exposure to size and low volatility.
Partially these results can be explained by the type of company that issues preferred shares, which are primarily financials, utilities, and real estate companies. Most of these rank poor on quality metrics given low profit margins and high leverage, but are also not particularly volatile given their industries.
Source: Finominal
YIELDS VS TOTAL RETURNS
Although high yields are intuitively appealing to all investors, these often are the result of mismanaged companies or industries with poor economic outlooks. Making income with yield and losing money on the principal is a common, but not a sound investment strategy (read The Case Against Equity Income Funds).
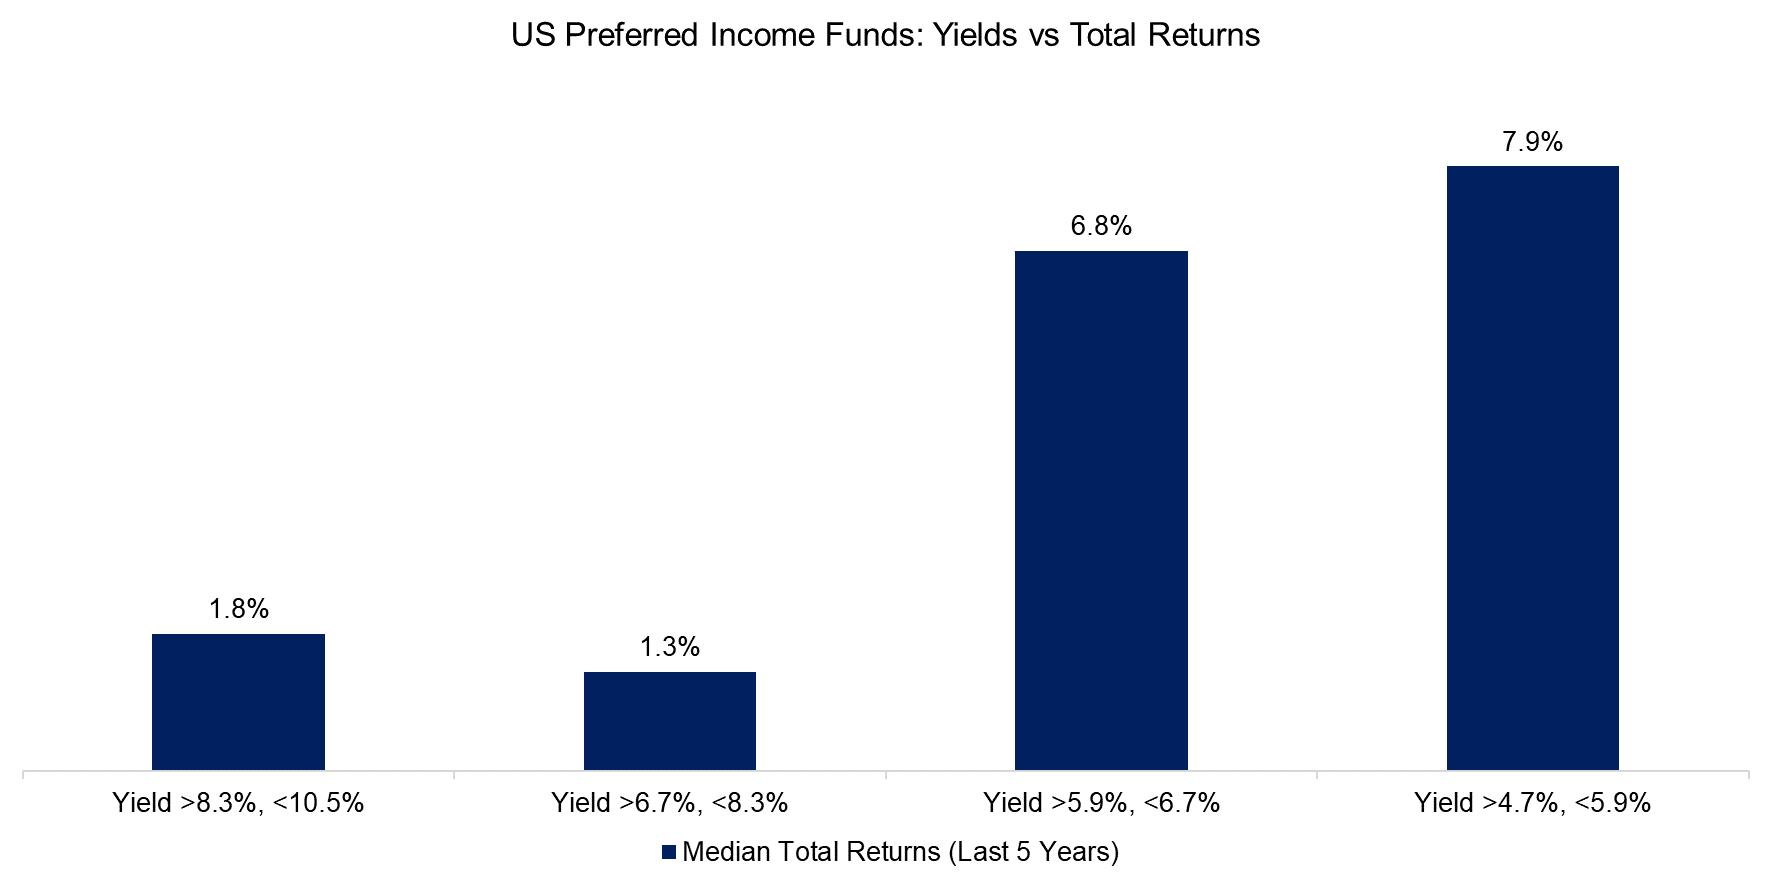
We compute the median total return, which includes distributions, of the preferred income funds over the last five years and compare this to their yields differentiated by quartiles. We observe that the funds with the highest yields generated the lowest total returns.
Source: Finominal
PERFORMANCE EVALUATION
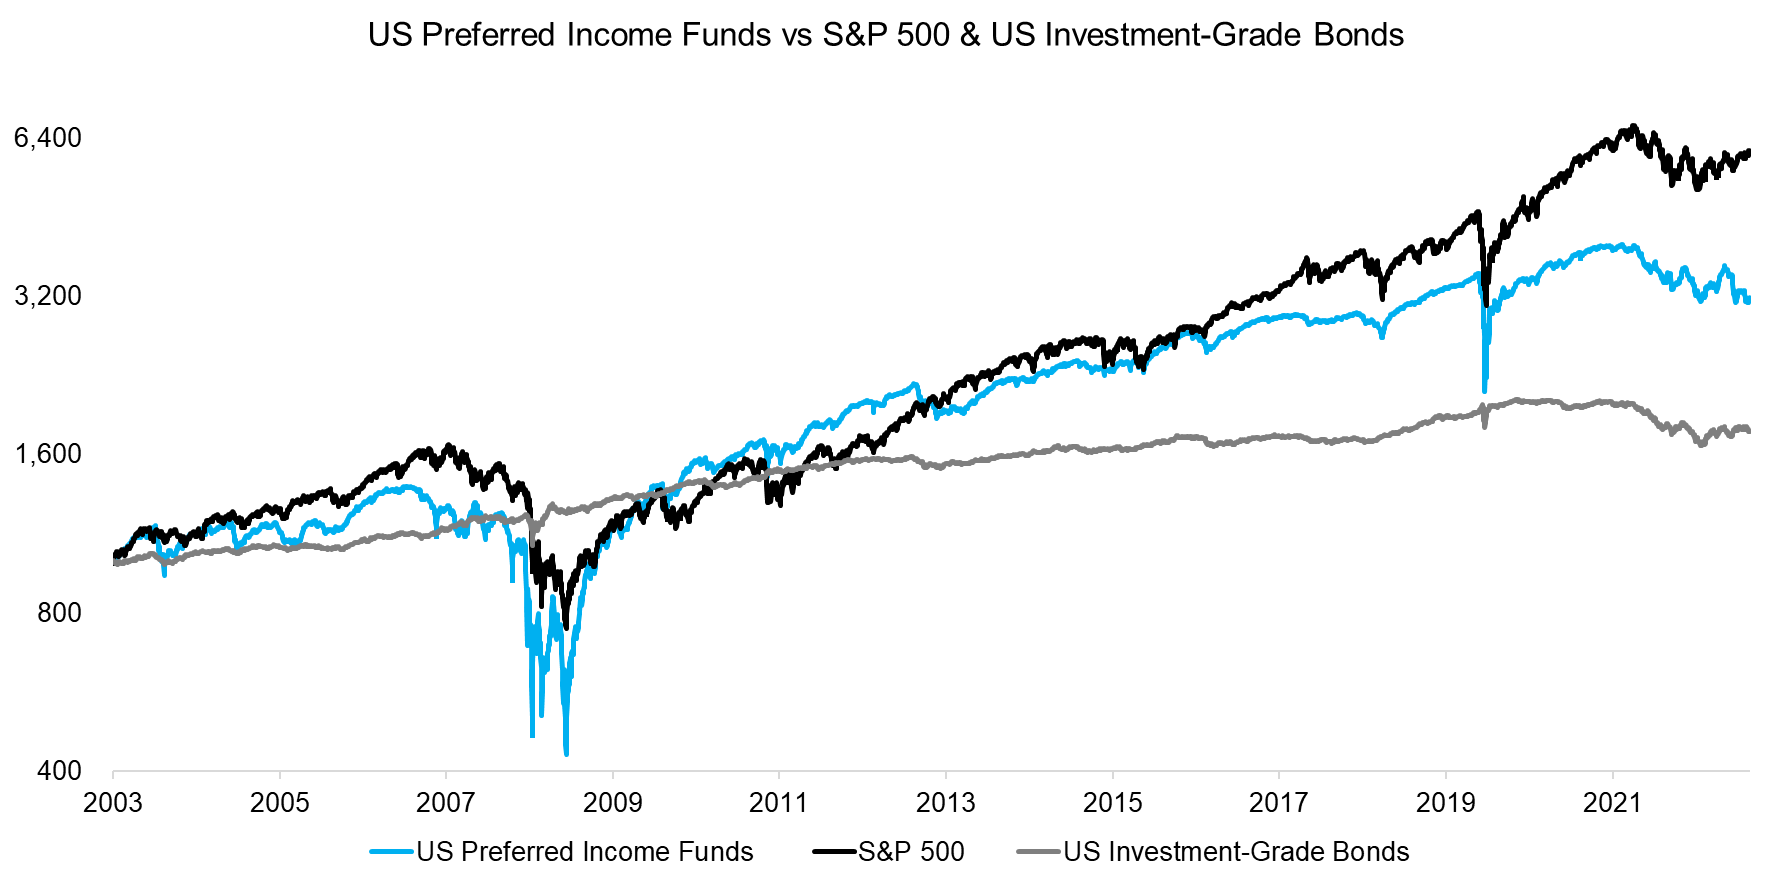
Finally, we compare the performance of an equal-weighted index of preferred income funds to the S&P 500 and US Investment-Grade Bond indices in the period from 2003 to 2023. We observe that the preferred income fund index behaved much more like stocks than bonds, eg the maximum drawdowns during the global financial crisis in 2008 and the COVID-19 crisis in 2020 were equally severe.
The Sharpe ratio of the preferred income fund index was 0.46, compared to 0.57 for the S&P 500 and 0.66 for US investment-grade bonds, over the last 20 years. The correlation to stocks was 0.60, so diversification benefits would have been limited for investors.
Source: Finominal
FURTHER THOUGHTS
The search for yield during the last few years has led to some outright silly trades like the issuance of a 100-year Argentinian bond in 2017, shortly after Argentina emerged from their decade-long default, or Tuna bonds from Mozambique in 2016, which both have cratered subsequently.
Although high levels of inflation negatively impact savings, higher interest rates bring down the amount of excessive speculation in financial instruments and unsound business models, which is ultimately positive for markets and the economy. As per Warren Buffett, “it’s only when the tide goes out, you see who is swimming naked.”
RELATED RESEARCH
The Case Against Equity Income Funds
Resist the Siren Call of High Dividend Yields
Dividend Yield Combinations
Value Factor: Improving the Tax Efficiency
Factor Exposure Analysis 101: Linear vs Lasso Regression
ABOUT THE AUTHOR
Nicolas Rabener is the CEO & Founder of Finominal, which empowers professional investors with data, technology, and research insights to improve their investment outcomes. Previously he created Jackdaw Capital, an award-winning quantitative hedge fund. Before that Nicolas worked at GIC and Citigroup in London and New York. Nicolas holds a Master of Finance from HHL Leipzig Graduate School of Management, is a CAIA charter holder, and enjoys endurance sports (Ironman & 100km Ultramarathon).
Connect with me on LinkedIn or X.

