
Private Market Exposure via Interval Funds
High returns, low risk – too good to be true?
August 2026. Reading Time: 10 Minutes. Author: Nicolas Rabener.
SUMMARY
- Retail investors are getting private market exposure via interval funds
- AUM has increased by 200%+ to $139bn since 2020
- However, the returns are overstated and risks understated
INTRODUCTION
The private equity industry is facing a growth challenge as its traditional capital providers – institutional investors like pension funds and family offices – have maxed out their PE allocations. Some, like Apollo and KKR, have acquired insurance businesses to access a different, more permanent source of capital. Others have started targeting retail investors via financial advisors.
However, retail investors prefer liquid over illiquid funds, and in the U.S., interval funds have become the go-to structure for this. These funds are offered continuously like any other mutual fund and provide daily NAVs, but typically offer liquidity only quarterly and only for a limited portion of redemptions.
Assets under management in interval funds have increased from $39 billion in 2020 to $131 billion in 2025, according to the Investment Company Institute (ICI). More than 60% of these funds provide exposure to private credit, followed by private equity, real estate, infrastructure, and other debt.
In this research report, we review the different types of interval funds and compare them to their public market equivalents.
PERFORMANCE OF PRIVATE MARKET FUNDS
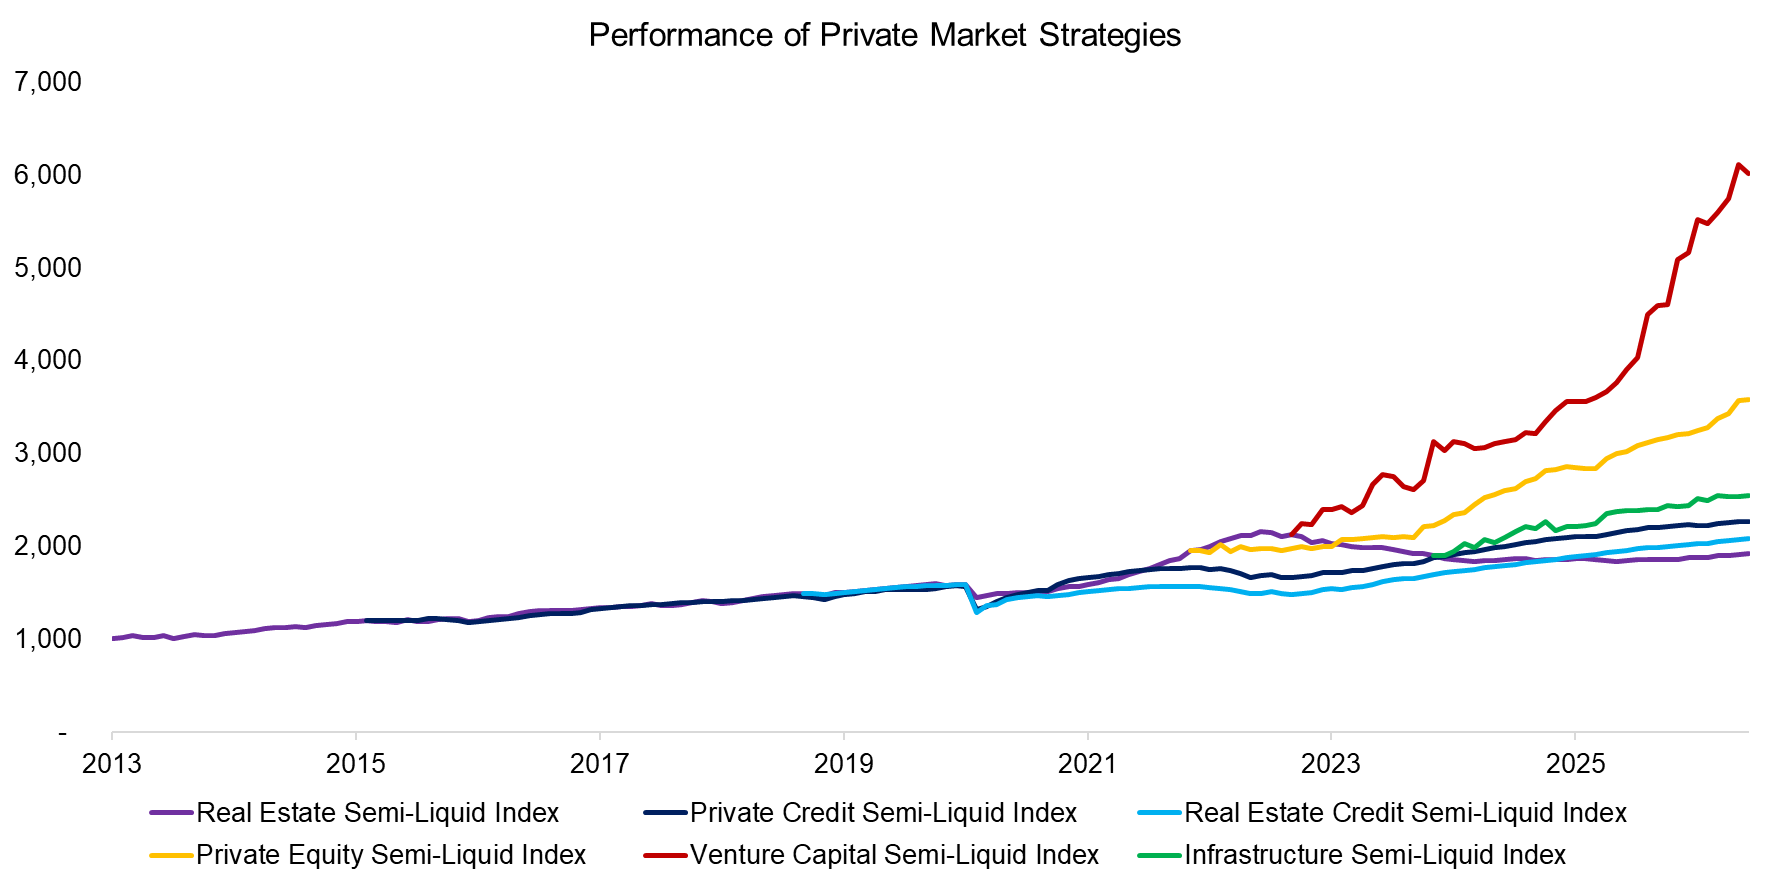
We recently launched multiple indices for private market strategies using listed and delisted interval funds in the U.S., where the underlying funds were equally weighted. Most of these funds have a limited track record, except for real estate and private credit, which have more than 10 years of data.
Reviewing the performance of these different private market strategies highlights that venture capital and private equity generated higher returns than fixed income strategies, as expected. It is worth noting that real estate has performed poorly since 2022, which could be explained by higher financing costs and lower demand for office space given the work-from-home trend since the COVID-19 crisis.
Source: Finominal
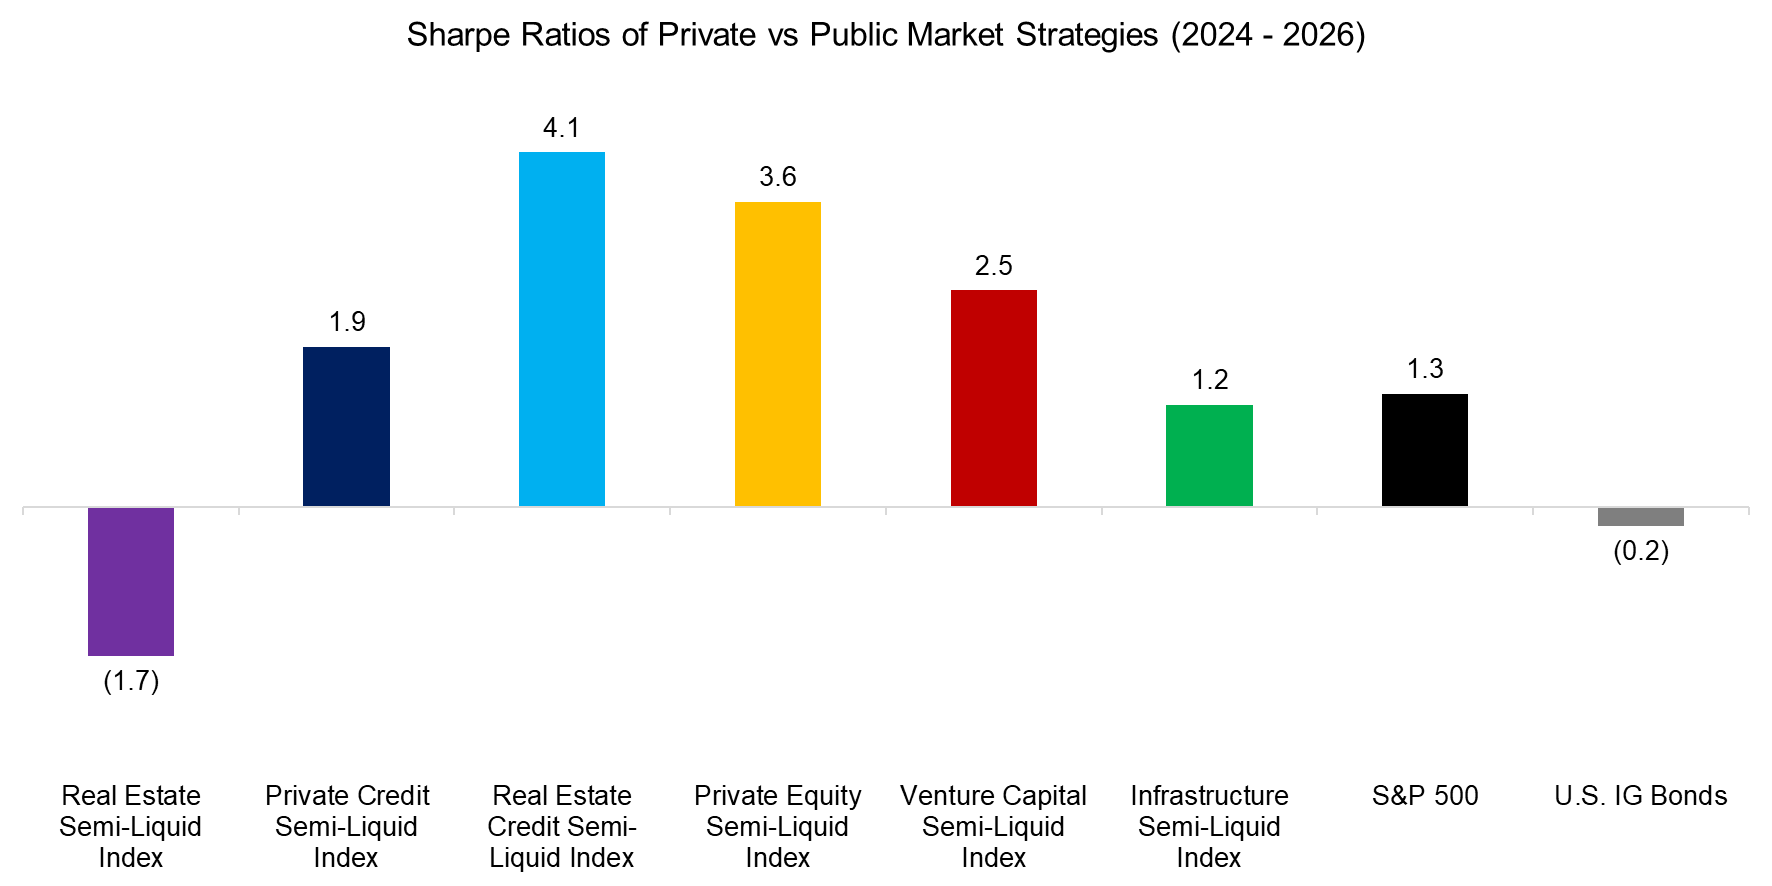
Next, we compute the Sharpe ratios of the various private market strategies using the common starting point in February 2024, which implies a short track record of 2.4 years. During this period, the S&P 500 generated a Sharpe ratio of 1.3, compared to its long-term average of 0.4. However, four of the private market strategies generated significantly higher Sharpe ratios, which is impressive given that the S&P 500 produced strong returns driven by the AI investment theme.
Source: Finominal
CORRELATION ANALYSIS
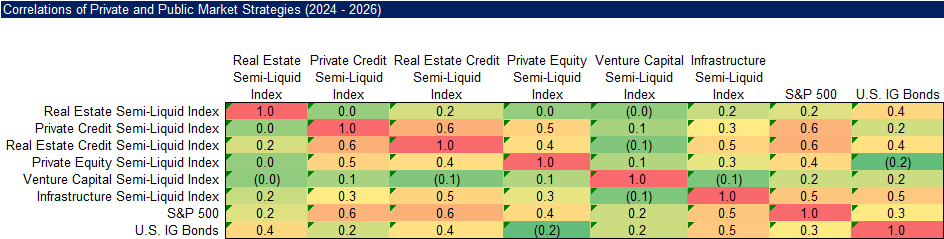
Alternative asset managers focus on highlighting the potential diversification benefits of allocating to private markets. Reviewing the correlations to the S&P 500 and U.S. investment-grade bonds confirms a maximum correlation of 0.6 to equities and 0.5 to bonds.
However, these correlations should be viewed skeptically. For example, the correlation between venture capital and the S&P 500 was a mere 0.2 over the last two years, which makes little sense, as both represent economic interests in the equity of companies. The S&P 500 is dominated by technology companies like NVIDIA and Amazon, which operate in the same ecosystem as the holdings of venture capital funds (read Venture Capital: Worth Venturing Into?).
Source: Finominal
PRIVATE VS PUBLIC MARKET VALUATIONS
The exceptionally high Sharpe ratios and low correlations can be explained by how interval funds value their assets. A publicly traded mutual fund or ETF computes its NAV based on the valuations of its holdings, which are mostly stocks with a daily price. In contrast, interval funds either allocate to funds, making them fund-of-funds, or hold assets directly, but these are illiquid assets like private companies, loans, or property. Therefore, these are marked-to-model rather than marked-to-market.
As a consequence, the NAVs of interval funds continuously lag public market valuations, which leads to low correlations. The valuations also change infrequently, which reduces volatility. Naturally, such holdings could be marked-to-market using publicly traded proxies, but the smoothed valuations serve the interests of alternative asset managers.
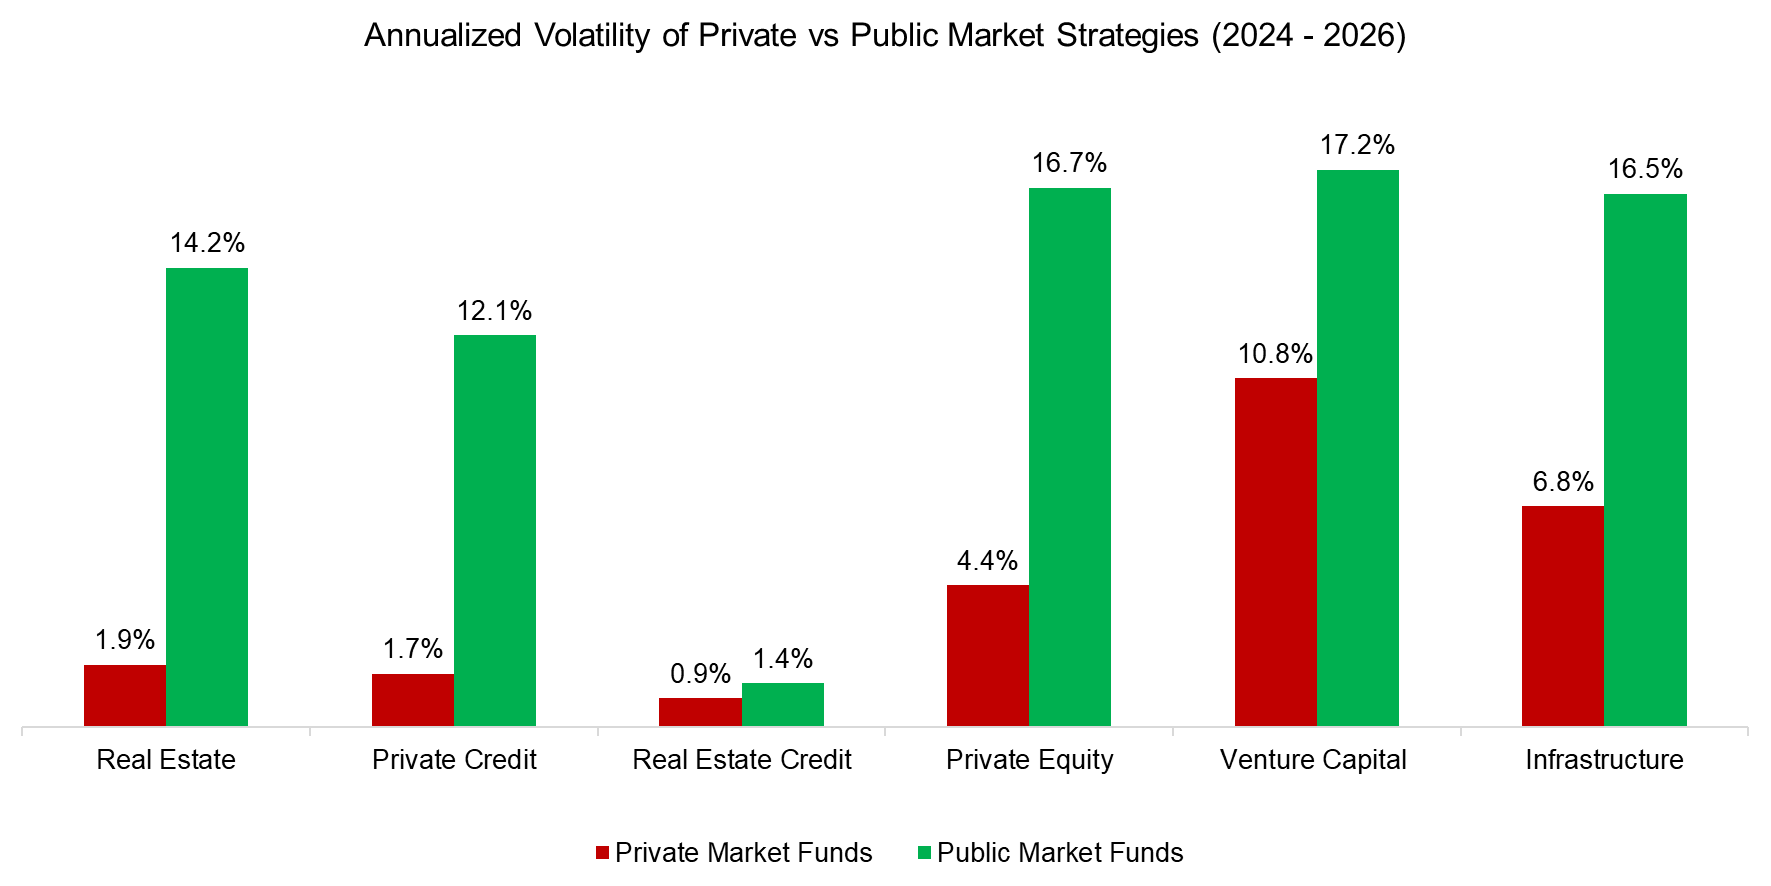
We can illustrate the difference in volatility by selecting publicly traded equivalents, e.g., REITs for real estate. We observe that the annualized volatility of interval funds is typically a fraction of that of publicly traded funds, despite holding similar assets. Sophisticated investors understand the valuations are fake, but it looks great on paper (read Private Equity: Fooling Some People All the Time?).
Source: Finominal
FURTHER THOUGHTS
Offering access to an illiquid asset class via semi-liquid funds is a poor marriage, as seen in many countries. Real estate funds in the UK and Germany have gone through multiple cycles of investors trying to exit en masse, only to be gated by fund managers who could not, or would not, sell assets to service redemptions. In the UK, this happened following the Brexit referendum in 2016; in Germany, it happened during the global financial crisis. It is a classic mismatch of marrying liquidity with an illiquid asset class.
Although the boom in U.S. interval funds is recent and likely to continue, it is a fool’s game that has ended in tears for investors multiple times before.
RELATED RESEARCH
The Case Against Private Markets
Private Equity Performance Tracker 2025
Private Equity Without the Lag
Style Analysis of Private Equity Funds
Private Equity: The Emperor has No Clothes
Private Equity: Fooling Some People All the Time?
Private Equity Is Still Equity, Nothing Special Here
Private Equity Managers vs Private Equity Funds
Listed Private Equity ETFs: The Real Deal?
Venture Capital: Worth Venturing Into?
BDCs: Better Don’t Choose?
The Case Against REITs
A Crescendo in Private Credit?
ABOUT THE AUTHOR
Nicolas Rabener is the CEO & Founder of Finominal, which empowers professional investors with data, technology, and research insights to improve their investment outcomes. Previously he created Jackdaw Capital, an award-winning quantitative hedge fund. Before that Nicolas worked at GIC and Citigroup in London and New York. Nicolas holds a Master of Finance from HHL Leipzig Graduate School of Management, is a CAIA charter holder, and enjoys endurance sports (Ironman & 100km Ultramarathon).
Connect with me on LinkedIn or X.