Quality versus Low Volatility ETFs
As different as night and day
April 2024. Reading Time: 10 Minutes. Author: Nicolas Rabener.
SUMMARY
- Quality and low volatility stocks provide substantially different exposures
- Neither has outperformed the stock market, but both were less volatile
- Low volatility stocks have done poorly in recent years
INTRODUCTION
If you believe that the economy is entering a recession and can only invest in equities, what stocks should you select?
Well, first we should probably acknowledge that we are terrible at predicting recessions, and even measuring them in hindsight, so whatever strategy we come up with to select stocks bears a significant risk of backfiring.
However, ignoring this unpleasant fact, then most investors would likely go for quality or low volatility stocks when having a negative economic outlook. Given the COVID-19 crisis in 2020 and the bear market in 2022, it is a good time to reflect on how well either strategy has performed.
In this research article, we will compare quality versus low volatility ETFs.
FACTOR EXPOSURE ANALYSIS
We focus on quality and low volatility ETFs trading in the U.S. stock market, where iShares dominates both categories with their products, namely iShares MSCI USA Quality Factor ETF (QUAL) and iShares MSCI USA Min Vol Factor ETF (USMV), which have captured more than 70% of the assets under management.
In addition to these two funds, we include SPHQ, JQUA, FQAL, VFQY, and PSET as additional quality and SPLV, FDLO, ONEV, FLLV, LVOL, and SPMV as further low volatility ETFs. The fees range between 0.10% and 0.29% per annum, and quality ETFs are cheaper than low volatility ETFs with an average management fee of 0.17% versus 0.23%.
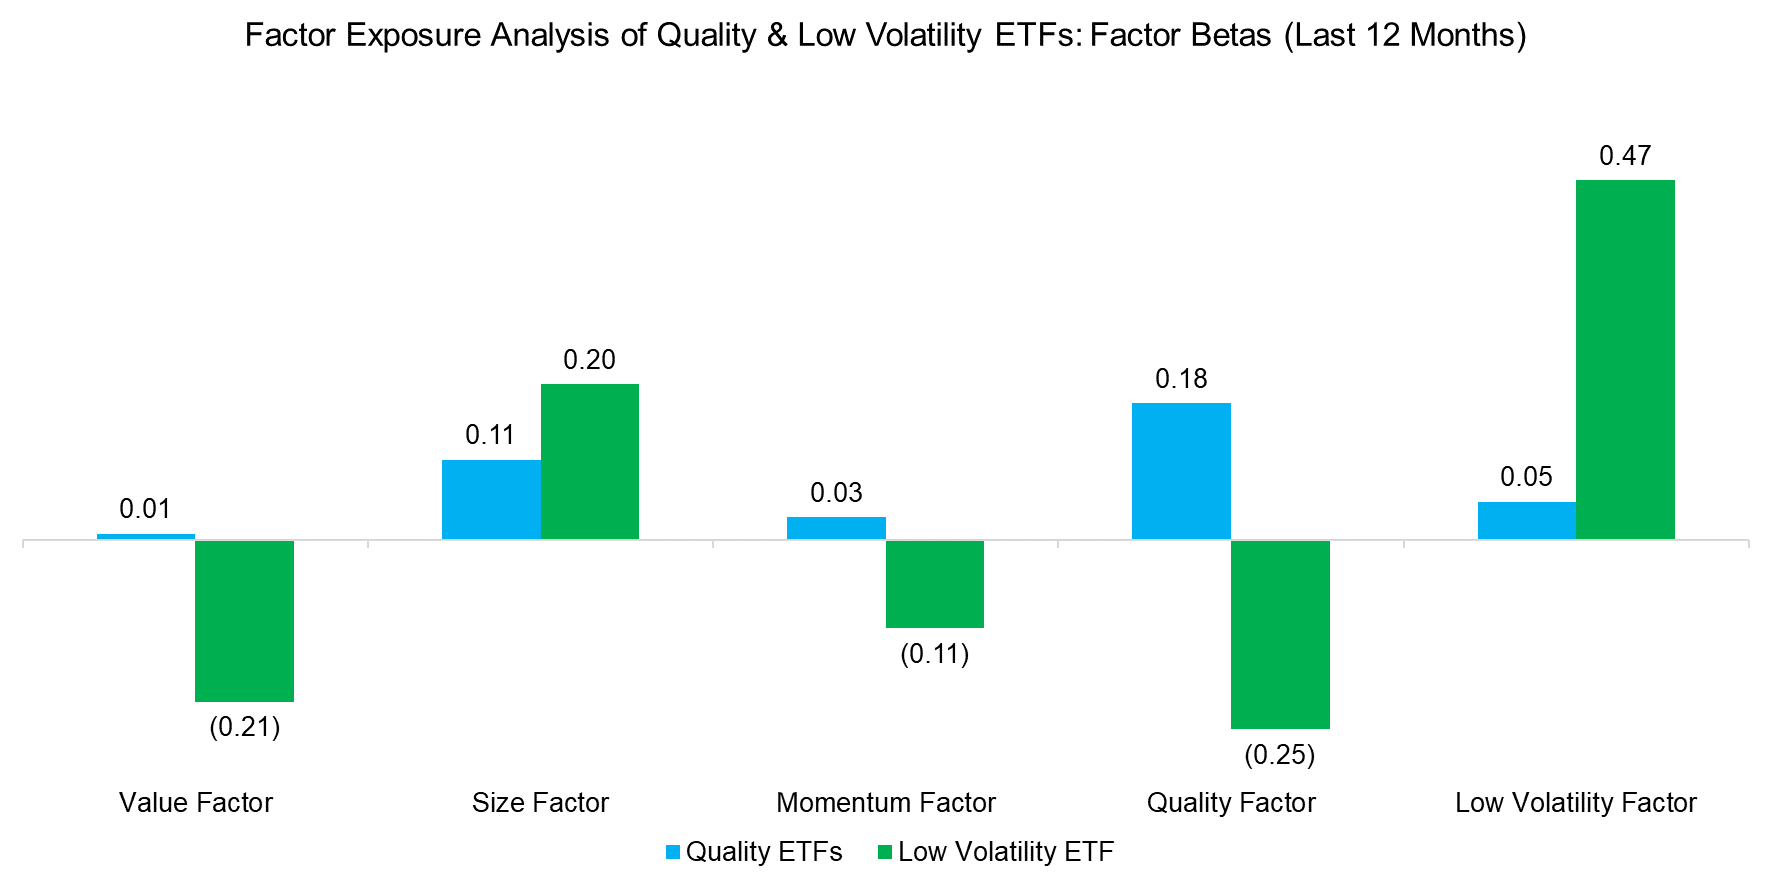
First, we run a factor exposure analysis using five equity factors and a one-year lookback, which highlights that the two strategies are quite different. The factor betas for the size and low volatility factors are positive for both strategies, but diverge for other factors. Most interesting is that low volatility ETFs have a negative beta to the quality factor.
Source: Finominal
BREAKDOWN BY SECTORS
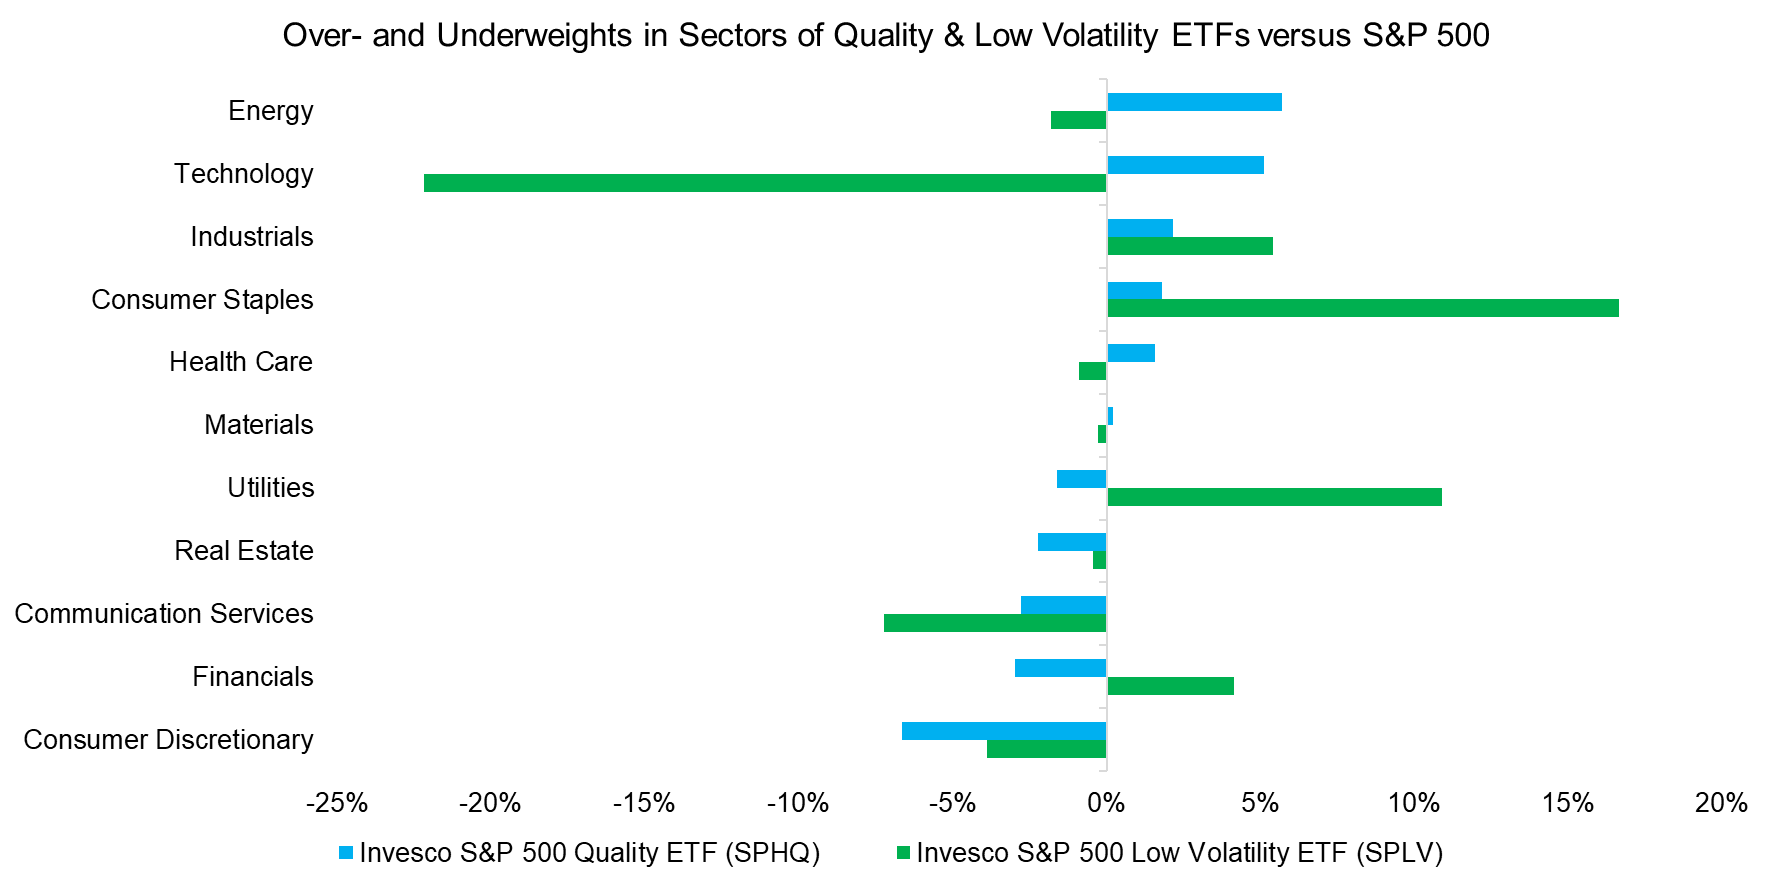
The divergent factor exposures are mirrored in substantially different over- and underweights in sectors versus the benchmark index, where we use the Invesco S&P 500 Quality ETF (SPHQ) and Invesco S&P 500 Low Volatility ETF (SPLV) as case studies. We observe that the quality ETF has significant overweights in energy and technology, and an underweight in consumer discretionary stocks. In contrast, the low volatility ETF has overweights in consumer staples and utilities, as well as an underweight in technology stocks.
The difference in weights towards the technology sector also explains why low volatility ETFs have negative exposure to the quality factor on average. Tech companies rank high on quality metrics as most have low or zero financial leverage and some are highly profitable, but they tend to be quite volatile stocks.
Source: Finominal
EXCESS RETURNS
One of the great misconceptions in investing is that quality stocks outperform, which perhaps has been fueled by Warren Buffett who frequently talks about selecting quality businesses for Berkshire Hathaway’s portfolio. He has achieved a fantastic track record, but it is worth highlighting that his stock portfolio also has exposure to value and low volatility factors (read Warren Buffett: The Greatest Factor Investor of All Time?).
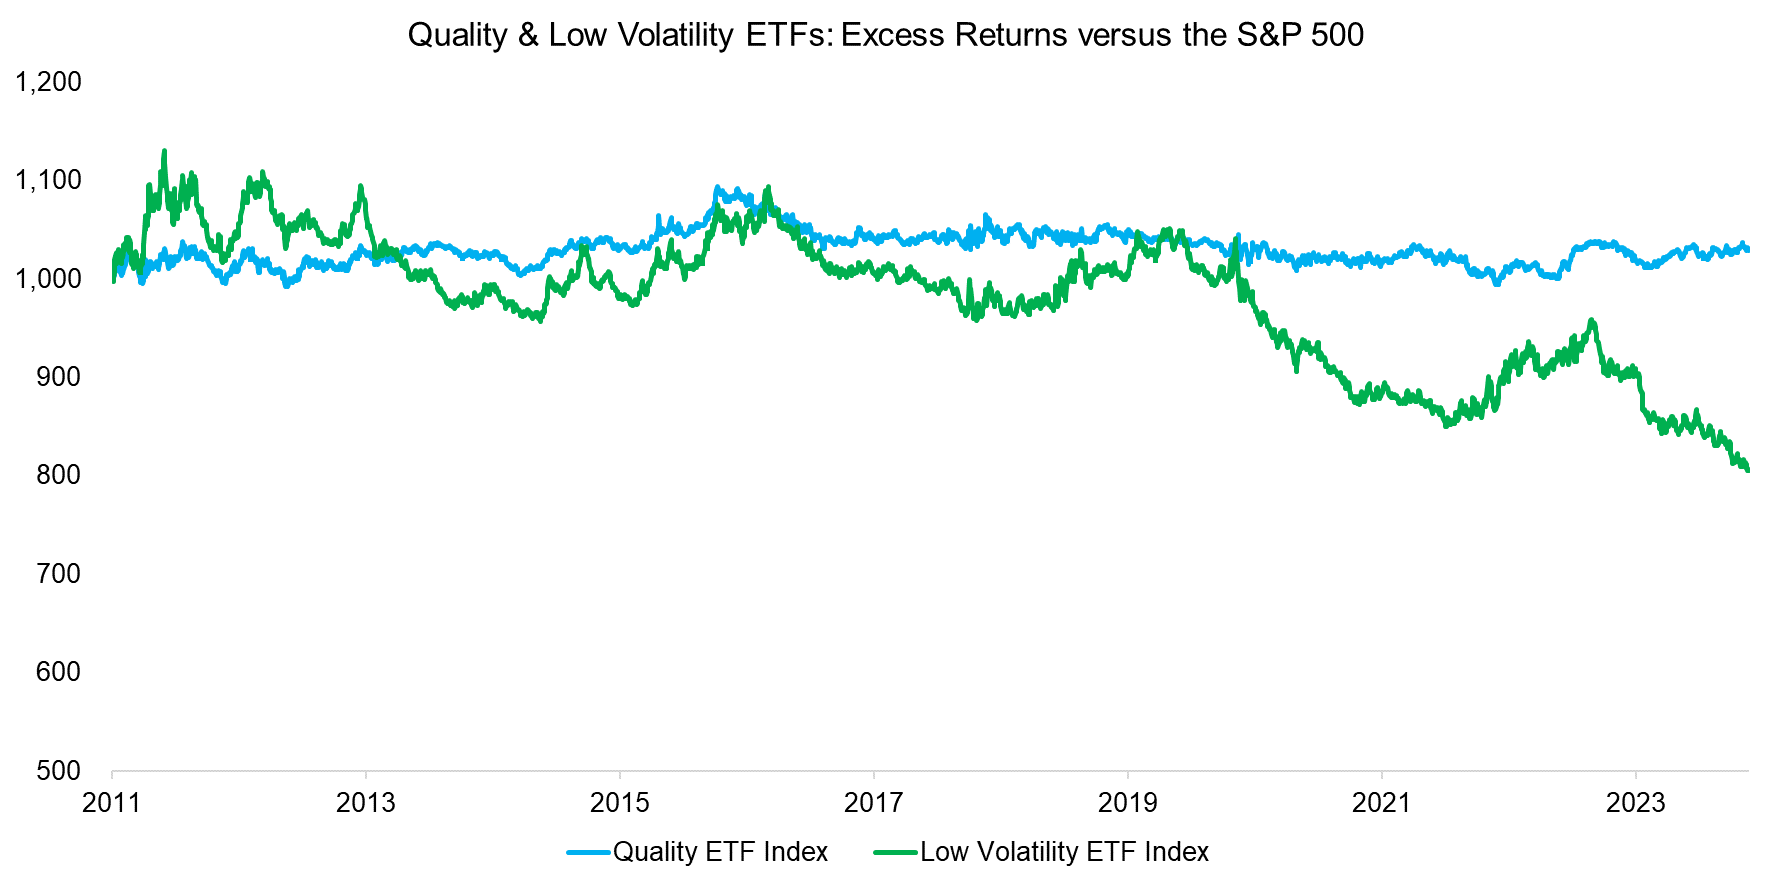
There is simply no rationale for why investors should get compensated for holding stocks that feature low leverage and high profitability, which is reflected by the lack of excess returns of an equal-weighted index of quality ETFs in the period between 2011 and 2023 versus the S&P 500 (read Oh, Quality, Where Art Thou?).
However, allocating to low volatility ETFs would have been even worse, especially during the COVID-19 crisis in 2020 when low-risk stocks like real estate underperformed significantly.
Source: Finominal
RISK & RETURN CHARACTERISTICS
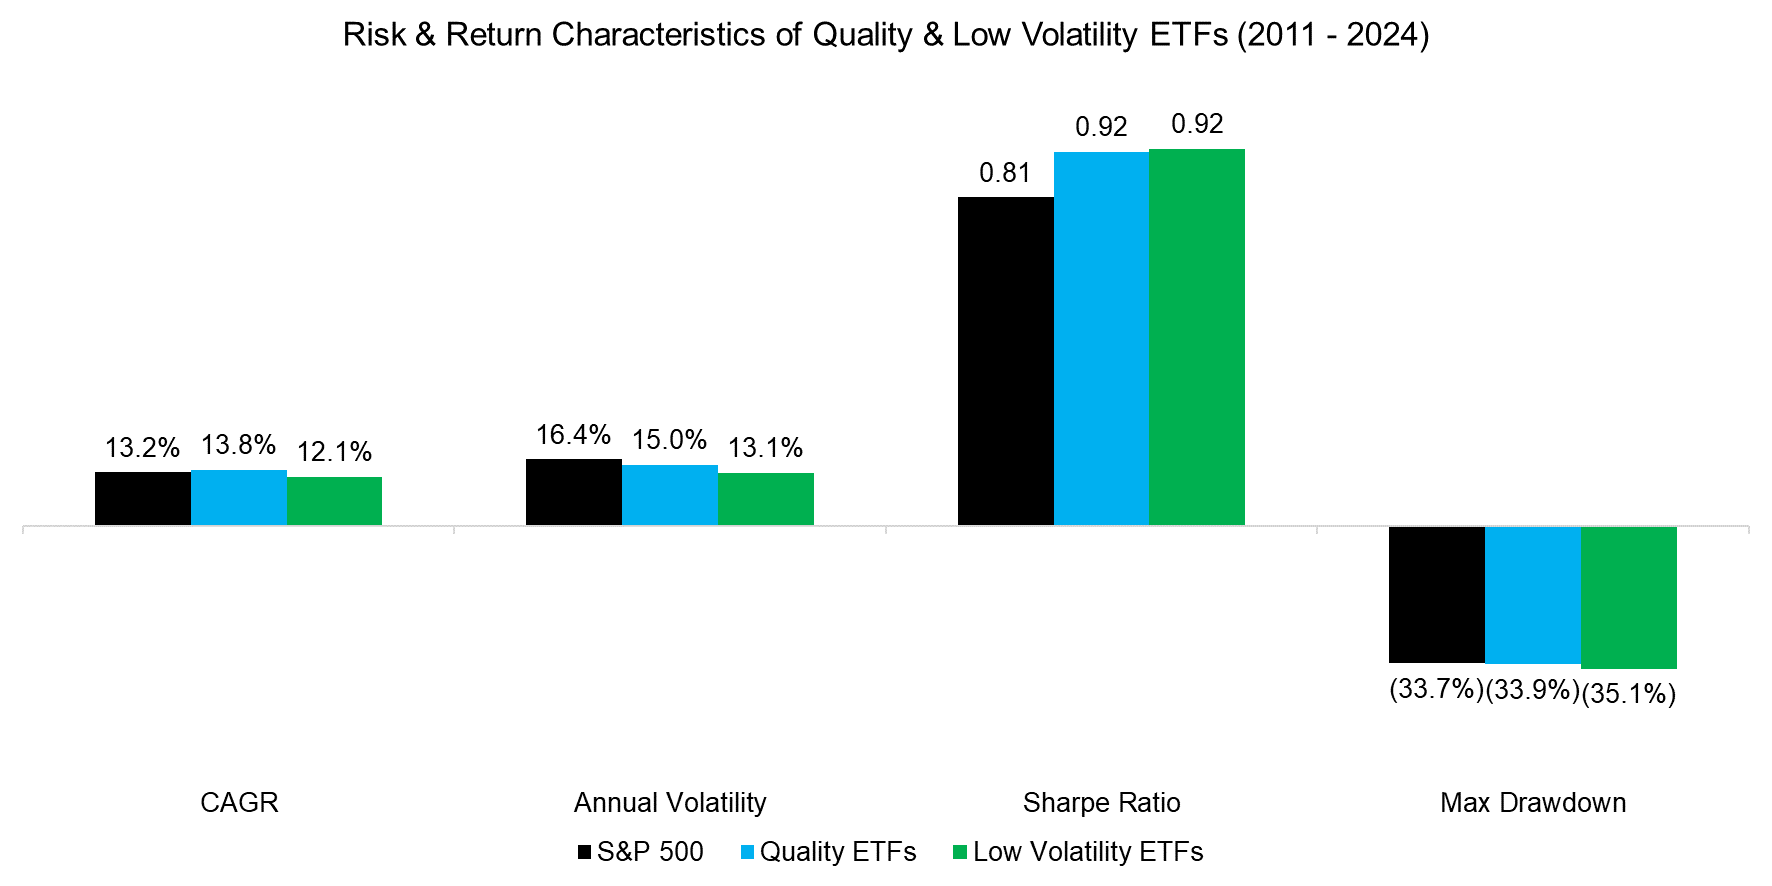
If we measure the return of quality stocks in the period from 2011 to 2024, then we see that they outperformed the S&P 500, but all of that outperformance can be attributed to the last two years, so that should be discounted as that represents rebalancing luck.
However, although investors should not expect quality and low volatility stocks to beat the stock market, they can be expected to generate higher risk-adjusted returns as they tend to be less volatile. The Sharpe ratios of quality and low volatility ETFs were significantly higher at 0.92 versus 0.81 for the S&P 500.
Somewhat surprising is that the maximum drawdown of the low volatility ETFs was higher than that of the S&P 500, which can be attributed to the poor performance during the bear market in 2022. Low volatility portfolios have an overweight to highly leveraged but stable stocks like utilities, which underperformed when interest rates started increasing (read The Dark Side of Low Volatility-Stocks).
Source: Finominal
QUANTIFYING DIVERSIFICATION BENEFITS
Does it make sense for investors to add quality and low volatility ETFs to an equities portfolio?
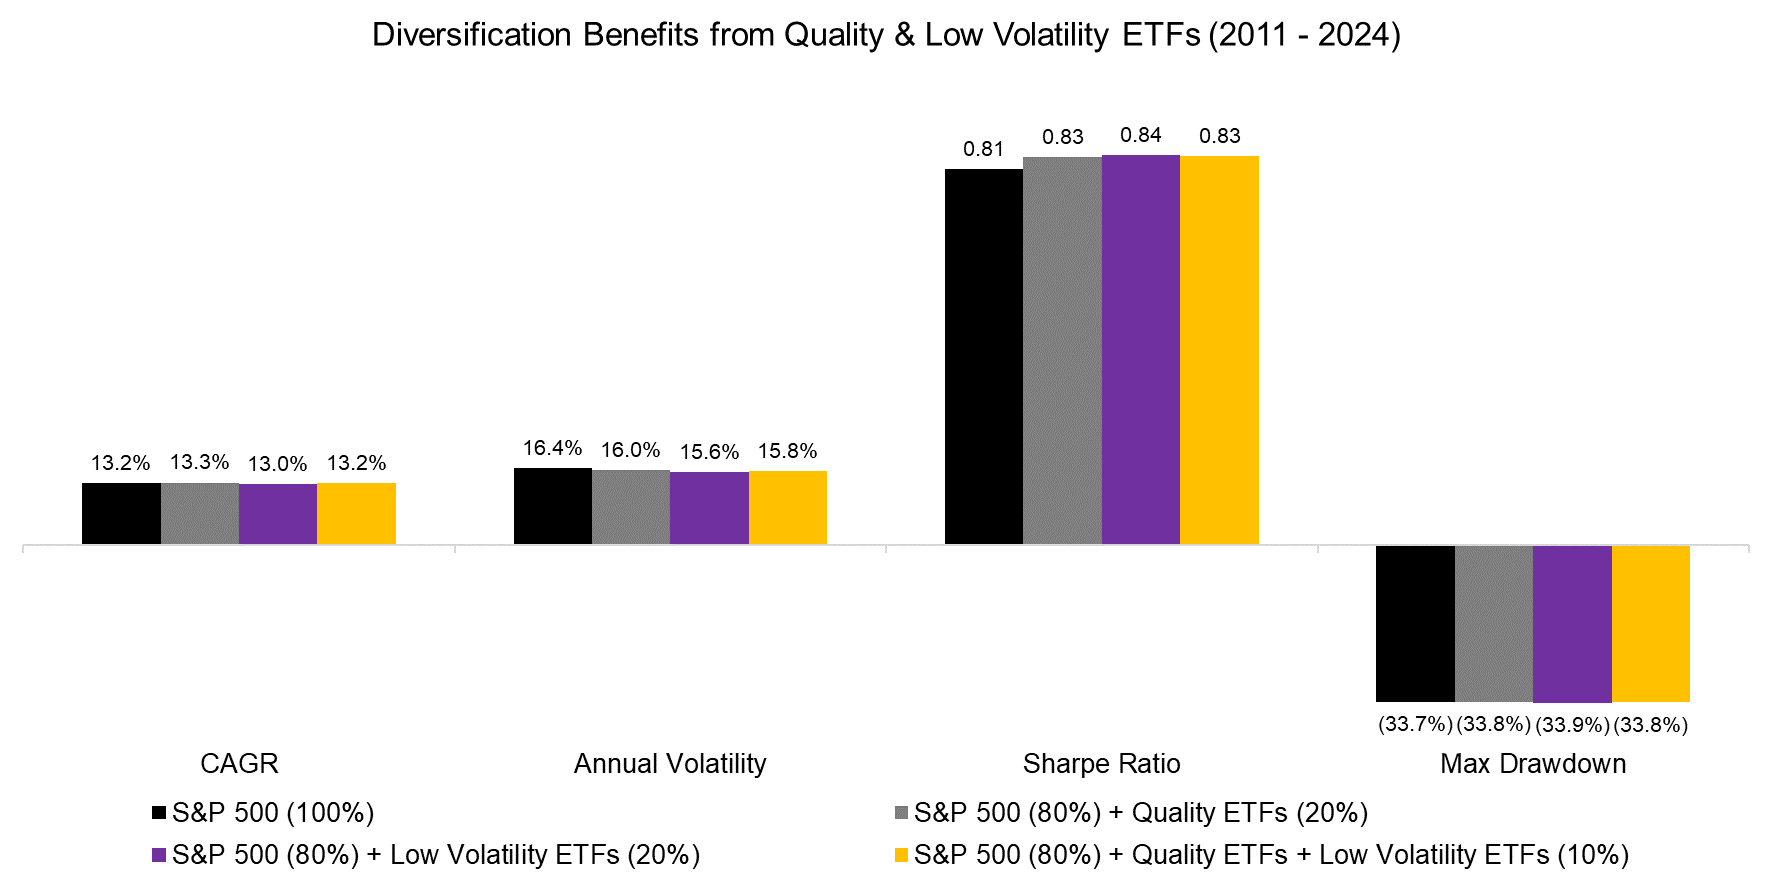
We simulate adding a 20% allocation to either strategy as well as an equal-weighted combination of quality and low volatility ETFs, but the benefits would have been marginal in the period from 2011 to 2024. The CAGR would have been almost unchanged at 13.2% while the annual volatility decreased, leading to a small improvement in the Sharpe ratio. However, the maximum drawdown would not have changed.
Source: Finominal
FURTHER THOUGHTS
Based on this analysis, investing in quality or low volatility stocks might seem to have little benefit.
However, as usual in investing, it is more complicated. Quality stocks have not outperformed significantly over the last 13 years but have also not underperformed and generated a higher Sharpe ratio. Low Volatility stocks have done poorly during the COVID-19 crisis in 2020 and the bear market in 2022, but they exhibited a much lower drawdown than the S&P 500 during the global financial crisis in 2009. Although painful, no strategy performs consistently and it is usually wise to take the long-term perspective.
RELATED RESEARCH
Oh, Quality, Where Art Thou?
Picking Profitable Companies Can Be Unprofitable
Quality Factor: Zero Alpha for Most Investors
Building a Stock Portfolio for a Debt-Averse World
Musings on Low Volatility
Is Low Vol the New Value?
Low Vol Factor: From Obscurity to Stardom
The Dark Side of Low Volatility-Stocks
Timing Low Volatility with Factor Valuations
ABOUT THE AUTHOR
Nicolas Rabener is the CEO & Founder of Finominal, which empowers professional investors with data, technology, and research insights to improve their investment outcomes. Previously he created Jackdaw Capital, an award-winning quantitative hedge fund. Before that Nicolas worked at GIC and Citigroup in London and New York. Nicolas holds a Master of Finance from HHL Leipzig Graduate School of Management, is a CAIA charter holder, and enjoys endurance sports (Ironman & 100km Ultramarathon).
Connect with me on LinkedIn or X.

