Replicating Popular Investment Strategies with Equities + Cash
Many strategies are just offering diluted equity exposure
July 2023. Reading Time: 10 Minutes. Author: Nicolas Rabener.
SUMMARY
- Most investment products offer straight or diluted exposure to the stock market
- Even complex strategies often can be replicated via a combination of the S&P 500 and cash
- However, this questions the utility of these strategies given a lack of diversification benefits
INTRODUCTION
When ETFs were conceived in the 1990s, the primary goals were to reduce cost and simplify investing. If fund managers can’t beat their benchmarks, then allow investors to invest directly in benchmarks. Cheap and simple.
However, given the excellent survival skills of the asset management industry, there are now ETFs available for every conceivable strategy, sector, or geography. Somewhat ironically, there are more ETFs than stocks trading in the US equity market. Investing has become cheaper, but not simpler.
In our research efforts over the years, we have analyzed many different types of ETFs, and often found that even complex strategies simply provide diluted equity exposure. For example, long-short equity hedge funds, which have become available as ETFs, can often be simply replicated via allocating to the S&P 500 and cash.
In this research article, we will look under the hood of some popular ETFs that have gathered large amounts of assets under management.
ETF CANDIDATES
We evaluate 10 ETFs that are typically viewed as alternative or diversifying strategies. Specifically, these are:
- First Trust Long/Short Equity ETF (FTLS): $690m AUM, 1.36% management fee
- IQ Merger Arbitrage ETF (MNA): $469m AUM, 0.77%
- IQ Hedge Multi-Strategy Tracker ETF (QAI): $632m AUM, 0.79%
- ProShares Hedge Replication ETF (HDG): $33m AUM, 0.95%
- JPMorgan Equity Premium Income ETF (JEPI): $27,200m AUM, 0.35%
- SPDR Blackstone Senior Loan ETF (SRLN): $4,440m AUM, 0.70%
- Global X S&P 500 Covered Call ETF (XYLD): $2,800m AUM, 0.60%
- iShares Preferred and Income Securities ETF (PFF): $12,850m AUM, 0.45%
- iShares iBoxx $ High Yield Corporate Bond ETF (HYG): $15,150m AUM, 0.48%
- iShares JPMorgan USD Emerging Markets Bond ETF (EMB): $14,980m AUM, 0.39%
Our approach to replication is simple: we consider the entire track record of a product and target to achieve the same volatility using only a combination of the S&P 500 and cash. Although there is no guarantee that a product’s future volatility will be the same as its historical one, approximately it should as investors expect fund managers to have a consistent investment style. Naturally, this applies more to strategies rather than asset classes.
The returns of the replication portfolios could be enhanced by investing in interest-bearing money market funds, rather than zero-yielding cash, but we want to keep the analysis as simple as possible.
FIRST TRUST LONG/SHORT EQUITY ETF (FTLS)
The First Trust Long/Short Equity ETF (FTLS) is the largest product by assets under management in the hedge fund category of the ETF industry and provides exposure to a diversified portfolio of long and short positions in stocks. The investment process is based primarily on earnings quality, ie go long stocks with high and short stocks with low earnings quality.
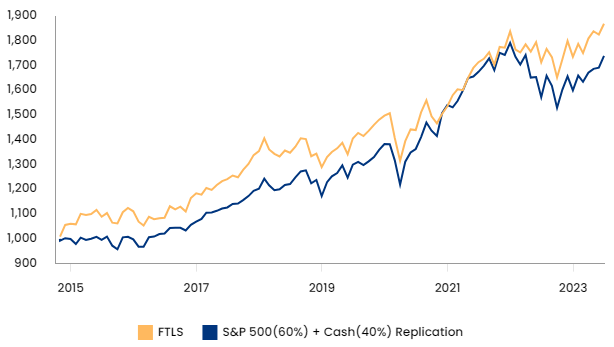
The ETF has been trading for almost a decade, so can be evaluated over different market environments. Applying our simple replication methodology highlights that the strategy could have been replicated via a 60% allocation to the S&P 500 and a 40% allocation to cash. There were periods of outperformance compared to the replication portfolio, but also periods of underperformance.
Source: Finominal
IQ MERGER ARBITRAGE ETF (MNA)
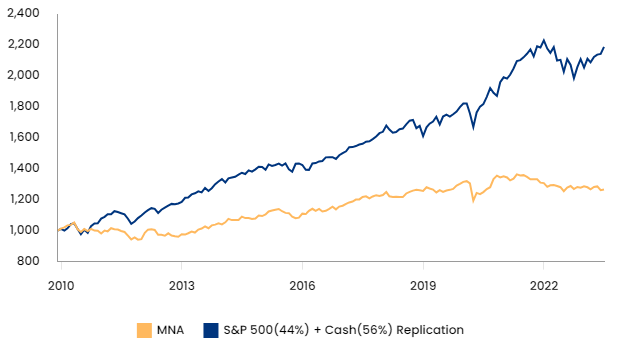
Similar to FTLS, the IQ Merger Arbitrage ETF (MNA) is one of the largest products in the alternative ETF space. The fund buys the stocks of companies to be acquired while shorting the stock market. Although the portfolio is constructed market neutral, we observe that the performance since 2010 seemed to provide primarily long exposure to the US stock market. The ETF’s factsheet states “as deal completion drives most of MNA’s returns, it doesn’t move with the markets”, which has not been true.
Assuming the same volatility, a 44% allocation to the S&P 500 and a 56% allocation to cash would have handsomely outperformed MNA.
Source: Finominal
IQ HEDGE MULTI-STRATEGY TRACKER ETF (QAI)
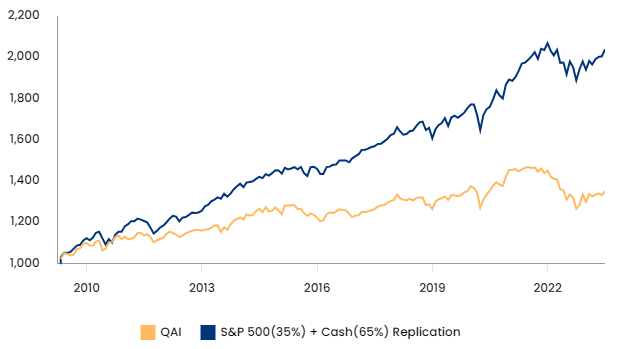
Another product from IQ, the IQ Hedge Multi-Strategy Tracker ETF (QAI), aims to provide replicate the risk-return characteristics of hedge funds in general. Although that may be true, it seems like another product that just offers diluted equity market exposure. Investors could have accepted the same risk profile, but achieved a significantly higher return via a 35% allocation to the S&P 500 and holding the residual in cash.
Source: Finominal
PROSHARES HEDGE REPLICATION ETF (HDG)
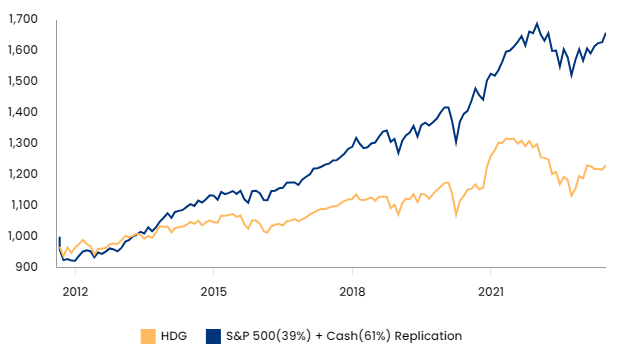
We review another hedge fund replication ETF, namely the ProShares Hedge Replication ETF (HDG), which has far fewer assets under management than QAI with $33m versus $632m. However, we observe again that an S&P 500 (39%) and cash (61%) replication would have provided a similar risk exposure, albeit with a significantly higher return since 2012.
Source: Finominal
JPMORGAN EQUITY PREMIUM INCOME (JEPI)
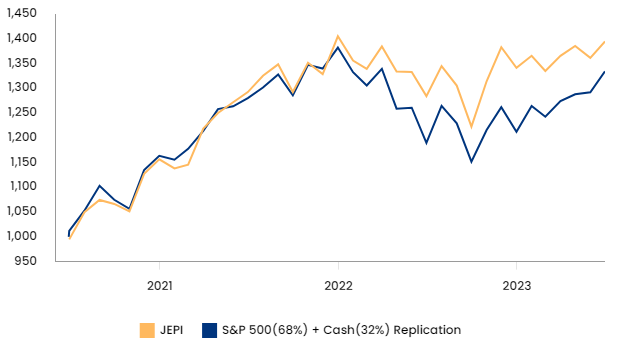
Next, we replicate the JPMorgan Equity Premium Income ETF (JEPI), which is the largest active ETF with $27 billion of assets under management. JEPI pursues a covered call strategy and distributes a dividend larger than 10%, so attracts primarily yield-seeking investors.
However, it seems that the performance can be simply replicated via 68% exposure to the S&P 500 and 32% cash, which could be invested in interest-paying bonds to provide income. The total return of such a combination would have been higher, and the risk likely lower as bonds tend to be negatively correlated with stocks.
Source: Finominal
GLOBAL X S&P 500 COVERED CALL ETF (XYLD)
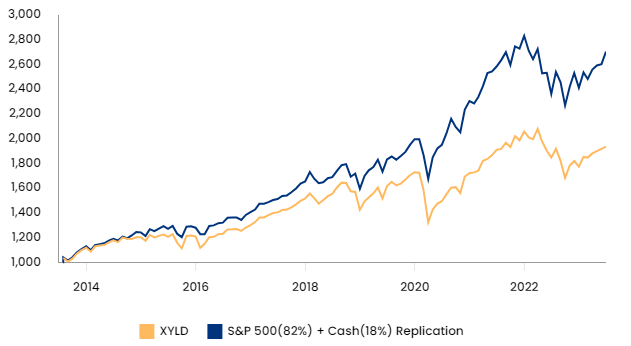
The Global X S&P 500 Covered Call ETF (XYLD) is a comparable product to JEPI, although only manages a 10th of its assets. The product could have been replicated by targeting the same level of volatility via an 82% allocation to US stocks and 18% to cash.
Source: Finominal
SPDR BLACKSTONE SENIOR LOAN ETF (SRLN)
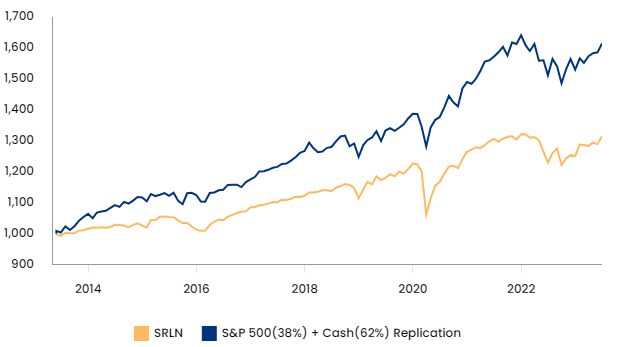
Senior loan products have become popular with investors during the low-interest-rate environment of the 2010s as they are perceived as having less interest-rate exposure than bonds. The SPDR Blackstone Senior Loan ETF (SRLN) offers exposure to such loans, but it seems that these are again just proxies for equity market risk. A 38% allocation to the S&P 500 and 62% to cash would have generated a much higher Sharpe ratio.
Source: Finominal
ISHARES PREFERRED AND INCOME SECURITIES ETF (PFF)
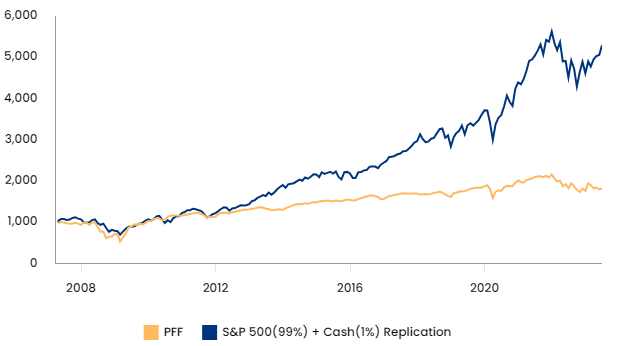
We continue our review of high-yielding products and analyze the iShares Preferred and Income Securities ETF (PFF), which managers more than $12 billion and offers a 7% yield. Although investors, especially retail, are drawn to high yields, such products typically offer poor total returns. And indeed, we observe that a simple stock + cash replication with the same volatility as PFF would have generated a higher return since 2008 (read Preferential Times for Preferred Income Strategies?).
Source: Finominal
ISHARES IBOXX $ HIGH YIELD CORPORATE BOND ETF (HYG)
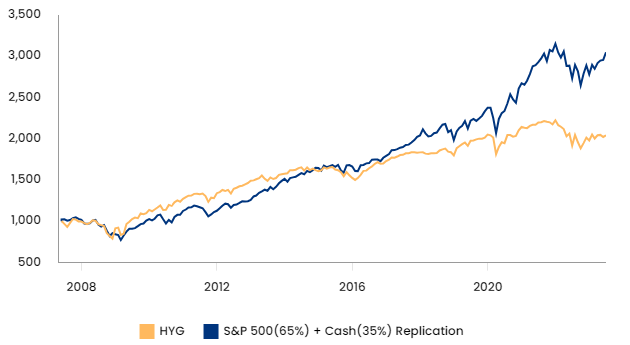
Our second-last analysis focuses on a high-yield product from iShares, the iBoxx $ High Yield Corporate Bond ETF (HYG), which manages more than $15 billion. High-yield bonds are positioned between senior bonds and equity in the capital structure of companies, which is nicely highlighted by the equity + cash replication that allocates 65% to the S&P 500 and 35% to cash.
Source: Finominal
ISHARES JPMORGAN USD EMERGING MARKETS BOND ETF (EMB)
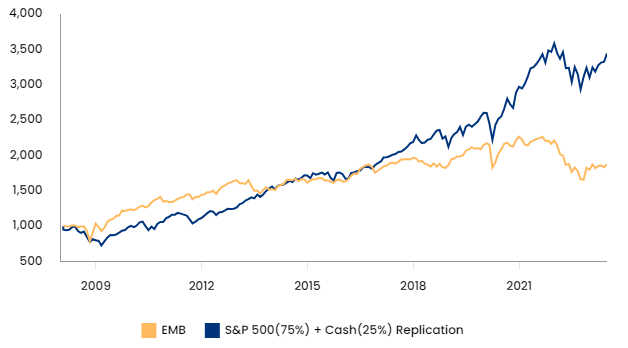
Finally, we review an emerging market bond product. Theoretically, EM bonds should be uncorrelated to the US stock market, but our equity + cash replication shows the trends were quite similar, especially during crisis periods like GFC in 2008, the COVID-19 crisis in 2020, and the bear market of 2022. It seems investors are treating US stocks and EM bonds the same when the risk sentiment turns negative (read EM Debt: To Hold, or Not to Hold?).
Source: Finominal
CORRELATION ANALYSIS
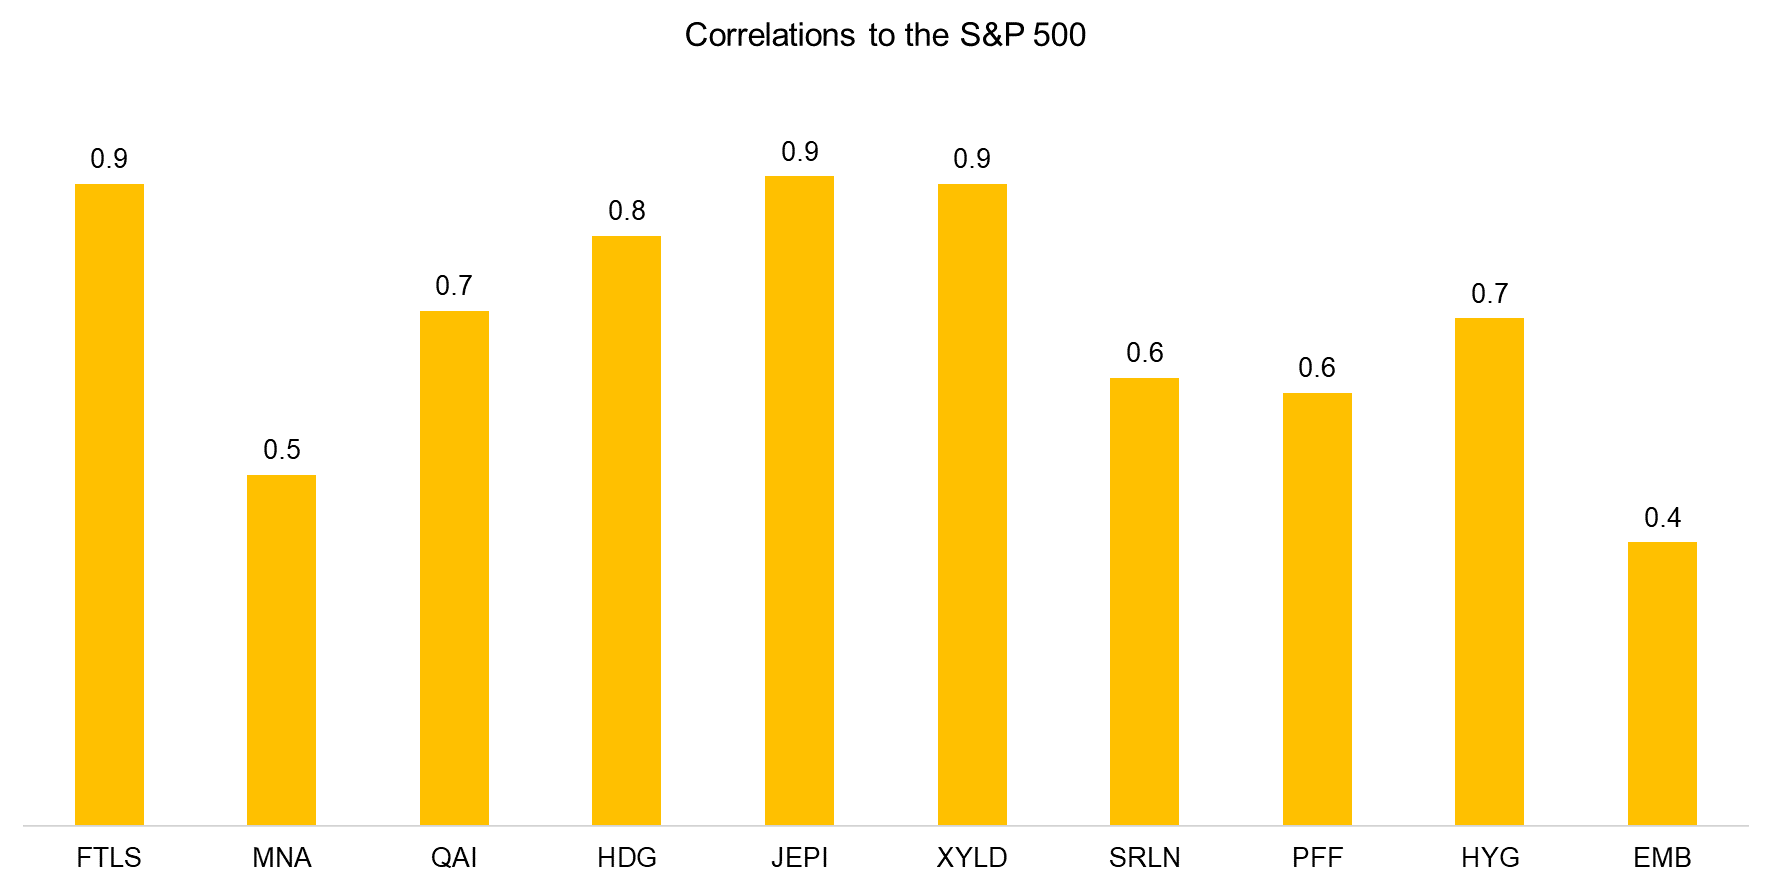
Our analysis highlights that all of these ten diverse strategies provide primary exposure to the stock market. Another way of demonstrating this is by simply calculating their correlations to the S&P 500, where we observe a range from 0.4 to 0.9. High correlations are expected for products like covered call strategies, but not for hedge funds ETFs that aim to provide uncorrelated returns.
Source: Finominal
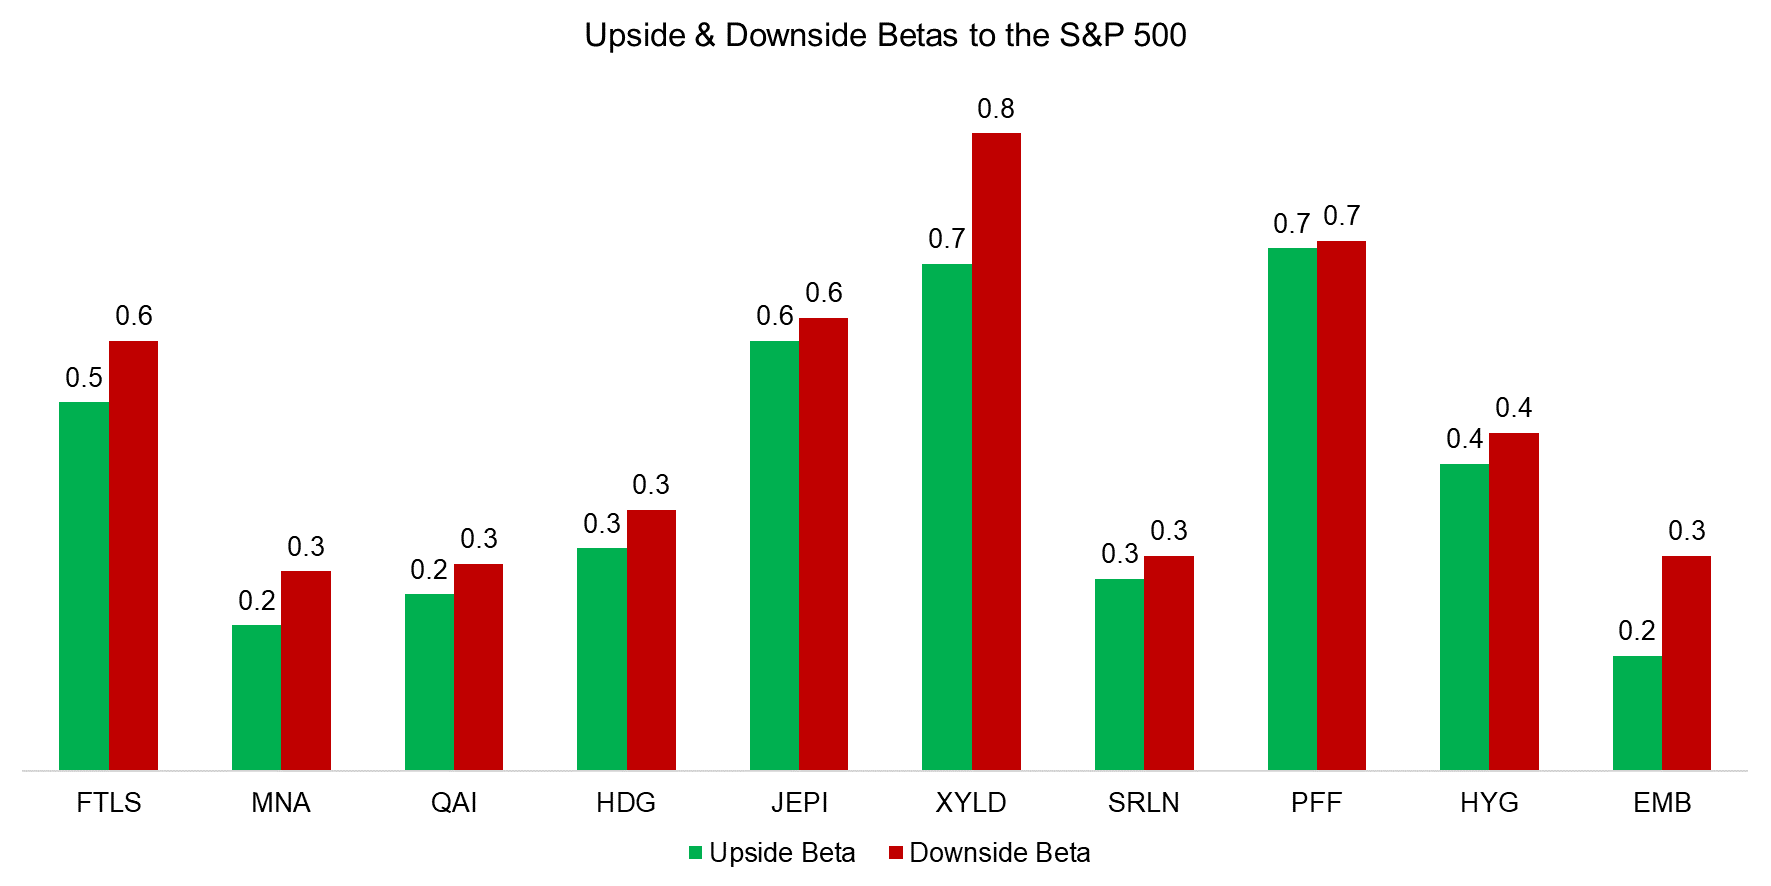
However, correlations are often deceiving as some strategies are lowly correlated to equities when markets are calm, but highly correlated when stocks crash. A better metric to evaluate the diversification benefits of strategies is the downside beta to the S&P 500, which describes the returns when the stocks decline. This can be compared to the upside beta, ie how a product performs when stocks rise. An attractive strategy should have a larger upside than downside beta (read Diversification versus Hedging II).
Out of the ten strategies, only PFF has a ratio of one, while the remaining offer unattractive ratios. For example, FTLS has an upside beta of 0.5, but a downside beta of 0.6. Stated differently, the ETF loses more in a bear market than it gains during a bull market.
Source: Finominal
FURTHER THOUGHTS
Investors often use factor exposure analysis to analyze investment products and learn what makes them tick. Although this is useful, sometimes more sophisticated analysis befuddles the mind and leads investors to not see the forest for the trees.
If a strategy exhibits the same trends as the stock market and underperforms a simple S&P 500 + cash replication portfolio, then this should raise questions on the utility of the strategy. If it looks like a duck, swims like a duck and quacks like a duck, then it probably is a duck.
RELATED RESEARCH
Replicating Famous Hedge Funds
Replicating a CTA via Factor Exposures
Time Machines for Investors
Factor Exposure Analysis 102: More or Less Independent Variables?
Factor Exposure Analysis 101: Linear vs Lasso Regression
ABOUT THE AUTHOR
Nicolas Rabener is the CEO & Founder of Finominal, which empowers professional investors with data, technology, and research insights to improve their investment outcomes. Previously he created Jackdaw Capital, an award-winning quantitative hedge fund. Before that Nicolas worked at GIC and Citigroup in London and New York. Nicolas holds a Master of Finance from HHL Leipzig Graduate School of Management, is a CAIA charter holder, and enjoys endurance sports (Ironman & 100km Ultramarathon).
Connect with me on LinkedIn or X.

