Revisiting the Performance of TAA ETFs
Tools for better equity exposure?
August 2022. Reading Time: 10 Minutes. Author: Nicolas Rabener.
SUMMARY
- There has been a boom in launching tactical asset allocation ETFs
- However, the recent track record of these has been poor
- Declining stock and bond markets have created a challenging environment for these
INTRODUCTION
Most investment strategies become popular through short rather than long periods, simply because no strategy works all the time. The longer the track record, the more explanation is required for why the strategy has merit as it will include periods of underperformance.
For example, the global financial crisis was great for tactical asset allocation strategies as it featured a slowly evolving bear market. By the time stock markets crashed seriously in 2008, many of these strategies were allocated out of equities and into bonds, thus preserving capital and increasing popularity with investors.
However, the decade thereafter was less attractive as there were many quick stock market crashes followed by even quicker recoveries due to central bank interventions. Most of these strategies are slow-moving and only managed to sell out of equities after stocks had fallen significantly, therefore often selling at the bottom, which became worse as they failed to reenter quickly and participate in the swift recoveries.
The year 2022 is reminiscent of 2001 and 2007 as the stock markets are declining, but not crashing yet. Perhaps it will be a year of redemption for tactical asset allocation strategies, perhaps not. In this research note, we will analyze the performance of tactical asset allocation ETFs (read Defining Tactical Asset Allocation).
TACTICAL ASSET ALLOCATION 101
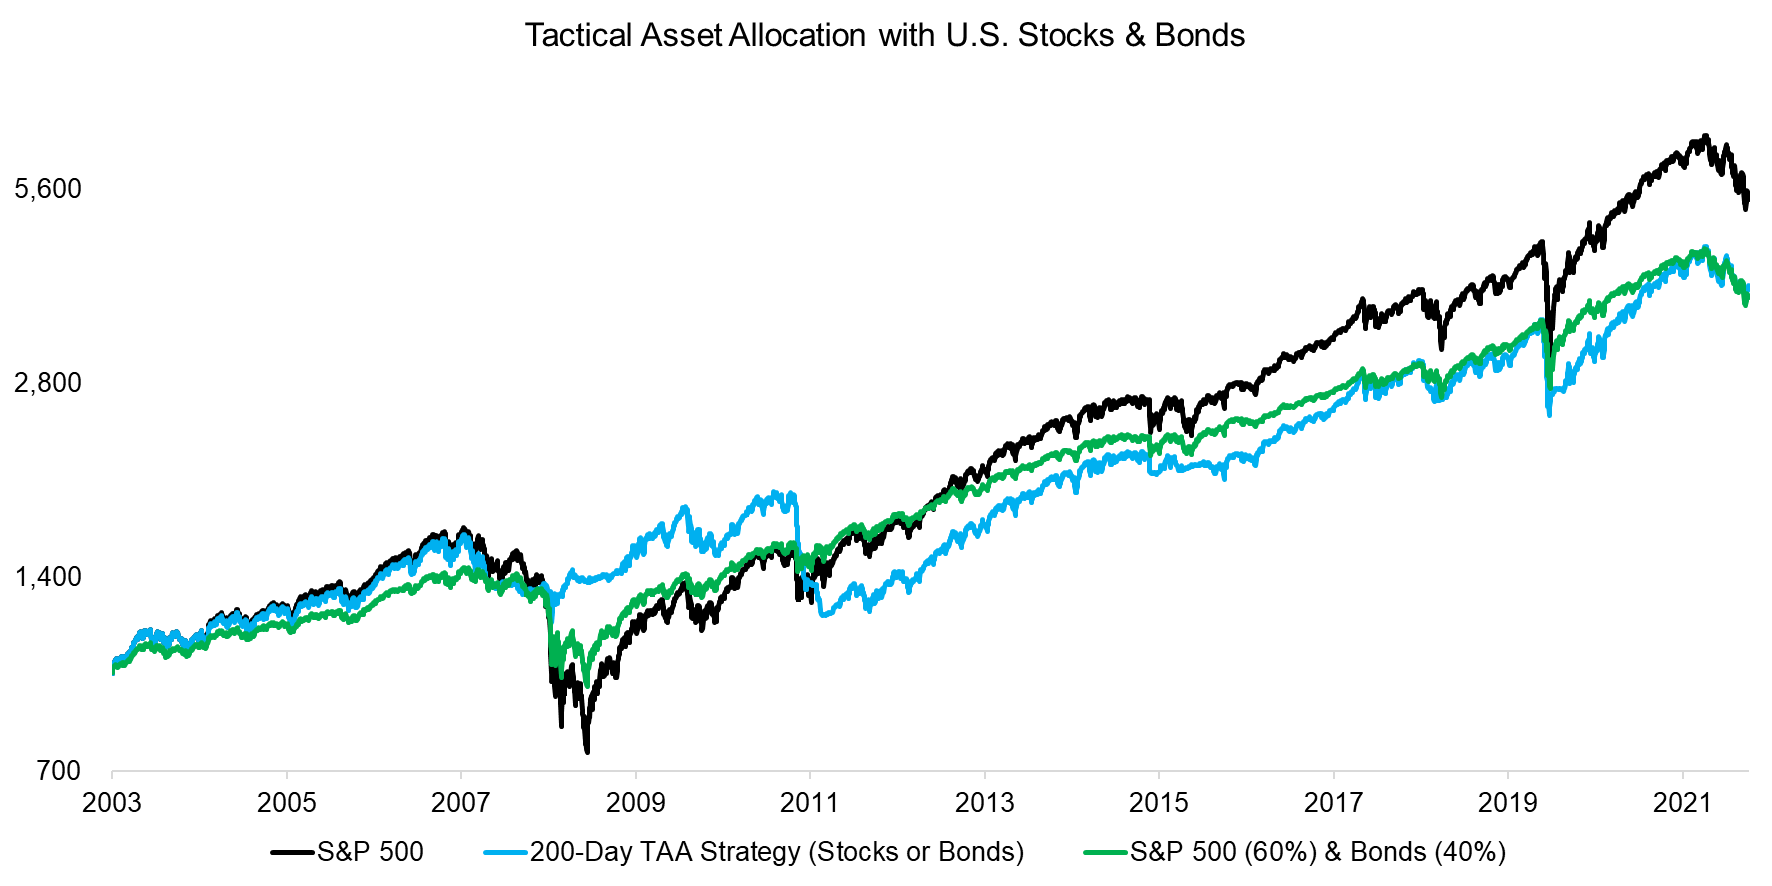
The likely most popular tactical asset allocation strategy is using the 200-day average on an equity index like the S&P 500 to determine allocations. If positive, ie stocks are up, then allocate 100% to U.S. stocks via an ETF, if negative, allocate 100% to bonds like U.S. Treasuries. It is a simple risk-on risk-off model.
We contrast the performance of this simple tactical asset allocation (“TAA”) strategy versus the S&P 500 and a static equity-bond (60% / 40%) portfolio. We observe that the stock market generated the largest return in the period from 2003 to 2022, but also featured the highest volatility. The TAA strategy preserved capital during the global financial crisis in 2008 and 2009, but did not perform well during minor stock market crashes like in 2011 and the COVID-19 crisis in 2020.
Source: FactorResearch
PERFORMANCE OF TAA ETFS
We focus on TAA ETFs trading in the U.S. stock market that have a track record of at least five years. Our universe includes only eight ETFs, although the definition of what constitutes a tactical asset allocation strategy varies across asset managers and investors. Some are more tactical than others (read Tactical ETFs: Tactfully No, Thank You?).
The combined assets under management of these eight ETFs accumulate to below $1 billion, which is a rounding error compared to the trillions invested in ETFs. The cheapest costs 0.35% per annum, while the most expensive charges 1.69%, which is exceptionally expensive for an ETF. Simple stock market exposure has become available at no cost.
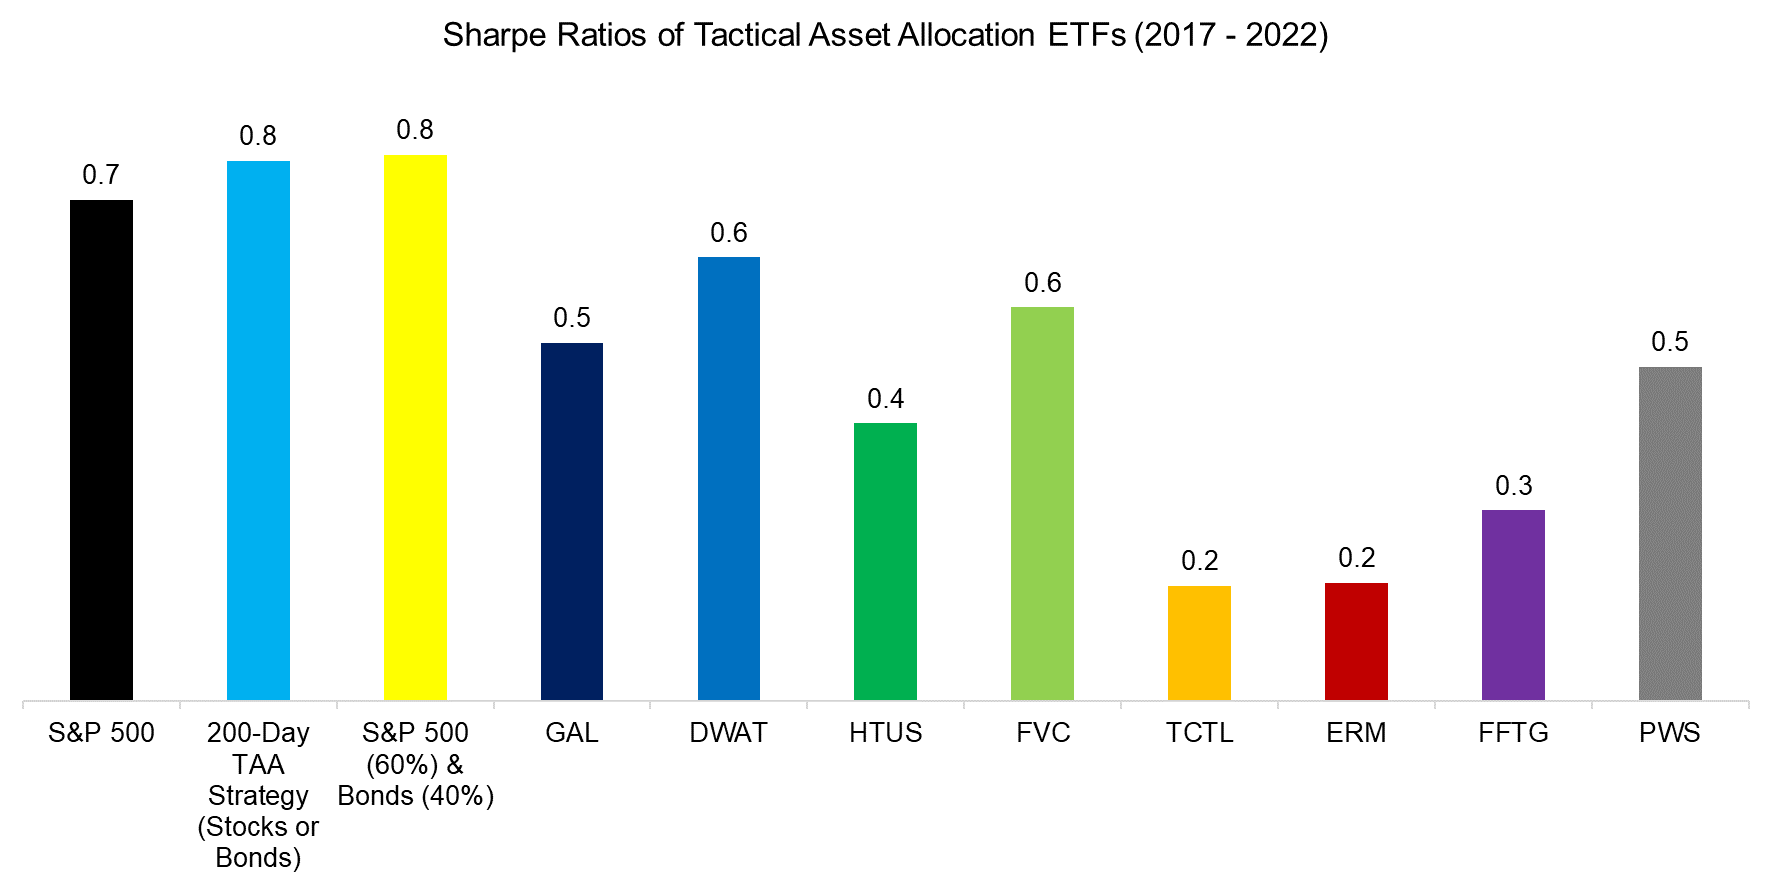
TAA strategies are typically marketed as providing higher risk-adjusted returns than the stock market. However, calculating the Sharpe ratios for the TAA ETFs for the period between 2017 and 2022 highlights that these were lower than those of the S&P 500, the simple TAA strategy using the 200-day average, or the 60/40 portfolio.
Source: FactorResearch
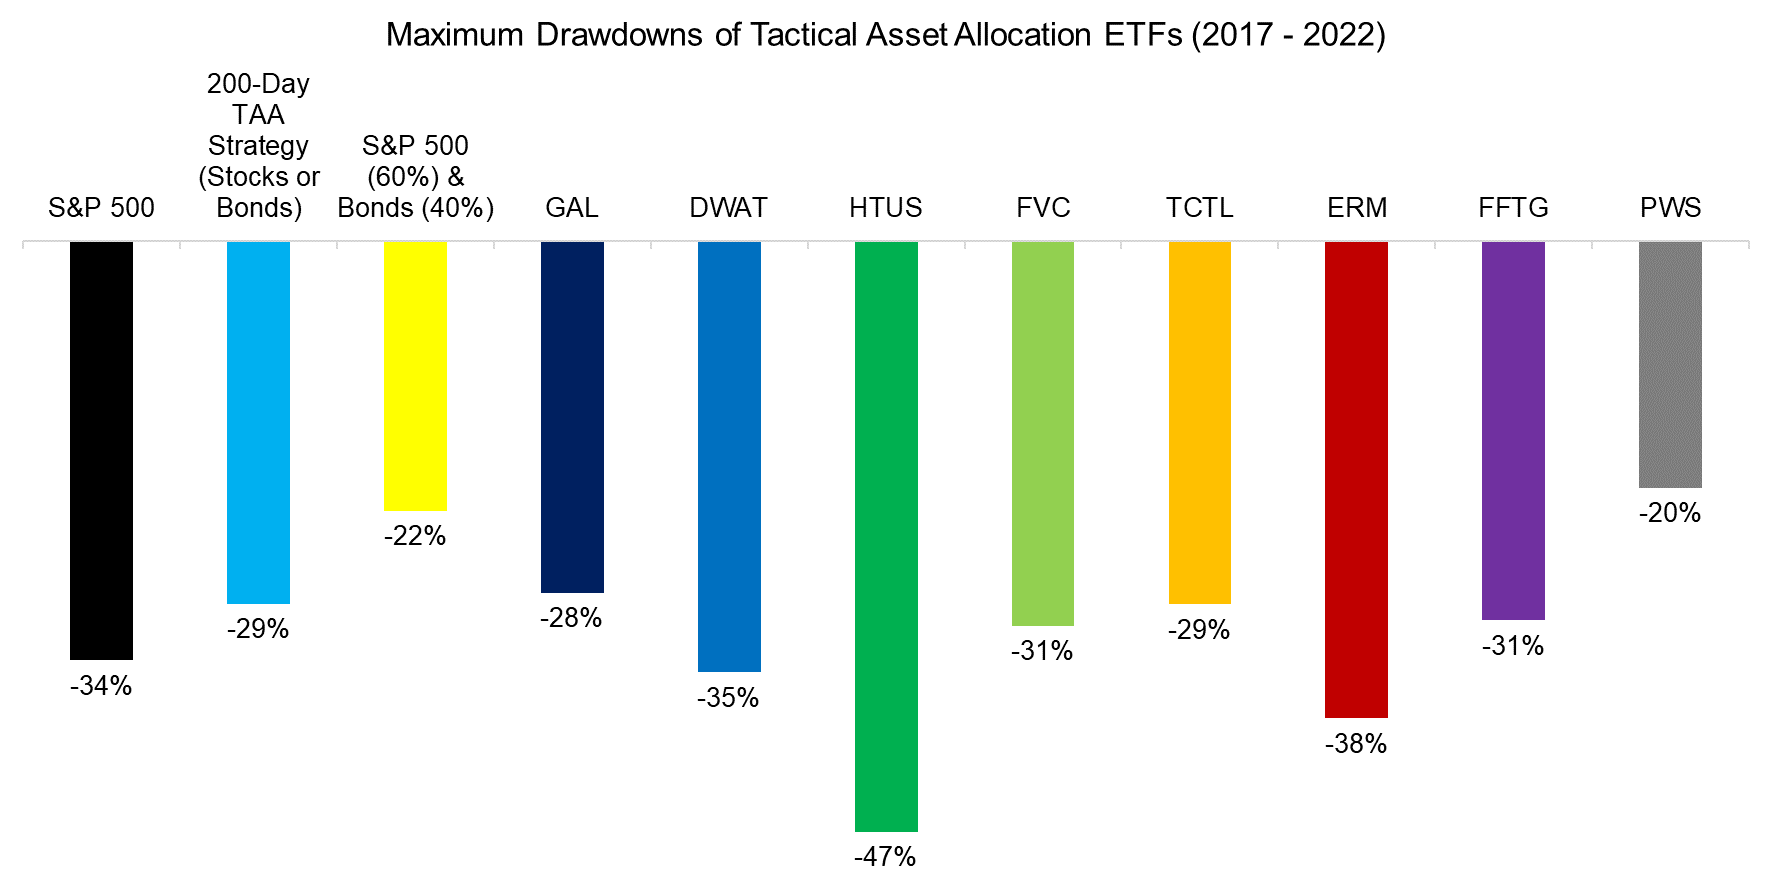
Aside from higher risk-adjusted returns, the second objective of TAA strategies is to reduce the risk. We compute the maximum drawdowns achieved in the period from 2017 and 2022, which highlights mixed results. Some TAA ETFs had larger drawdowns than that of the S&P 500 (-34%), and most were worse than that of a 60/40 portfolio, which is surprising.
Source: FactorResearch
CORRELATIONS OF TAA ETFS
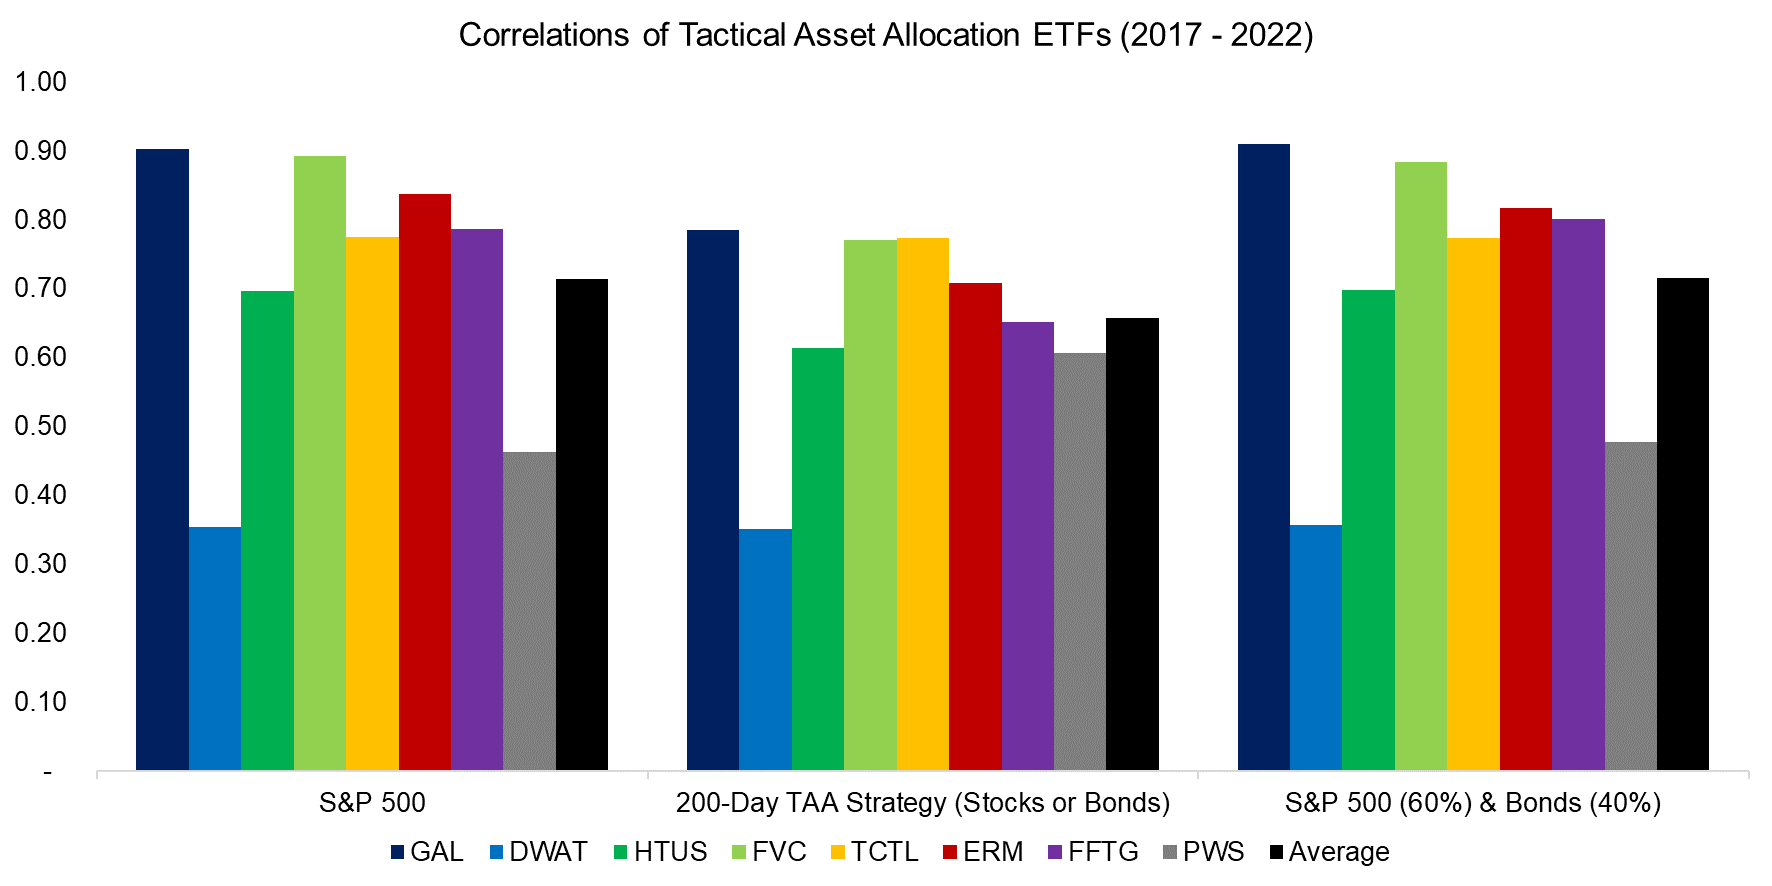
So far the TAA ETFs have not generated more attractive risk-adjusted returns than the simple 200-day TAA strategy. Most results were comparable, so we calculate the correlations of the ETFs to the TAA strategy. The average correlation was only 0.66, which indicates that these ETFs are doing something different than simply using the 200-day average to decide allocations between the S&P 500 and U.S. Treasuries. This may include more asset classes and indices, different or multiple lookback windows, scaling techniques, and so on.
However, we also observe that most strategies were highly correlated to the S&P 500, which indicates that these strategies should be considered as replacements for an equity allocation rather than a complementary position as the diversification benefits are limited.
Source: FactorResearch
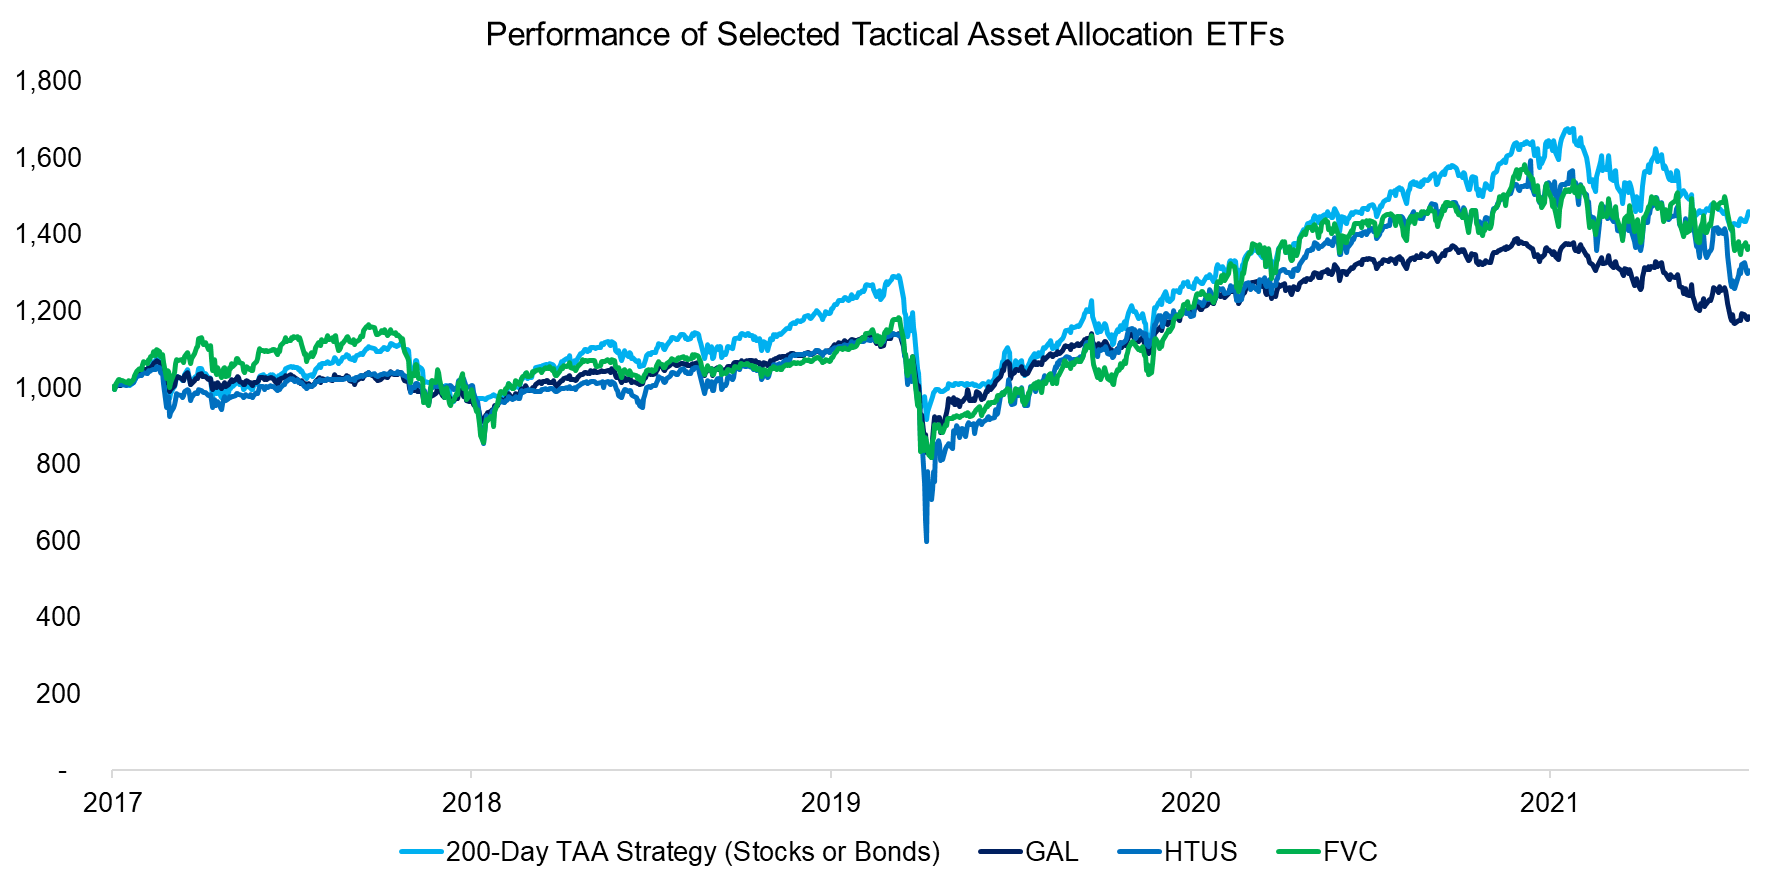
As a final step, we select the ETFs with correlations higher than 0.75 to the 200-day TAA strategy and compare their performance. As expected based on their correlations, their performance was comparable over the last five years and they exhibited the same trends.
This is surprising as the three ETFs seem to have differentiated strategies, ie GAL pursues a global asset allocation that is less tactical than HTUS, which uses leveraged and short positions, or FVC, which employs a momentum-based sector rotation that can go into cash. Despite the different strategies and portfolios, the outcome was quite similar.
Source: FactorResearch
FURTHER THOUGHTS
Although we only analyzed eight TAA ETFs that feature a track record of more than five years, there has been an abundance of new product launches in the last few years that expands the universe and highlights an investor demand for these strategies. It has been tough to stay in equity markets given high valuations and tactical exposure may be a sound strategy for this.
However, the track record of the ETFs we analyzed is less than stellar and the core thesis of most tactical asset allocation strategies, ie switching from equities to bonds when stock markets decline, has not worked out well in 2022. Bonds have also lost value given rising interest rates, even short-term U.S. Treasuries.
Holding ultra short-term government bonds might lower the loss compared to longer-term debt, but given that inflation is close to 10% in most developed markets, this implies a significant loss in real terms. Naturally, such a loss is preferable to participating in a stock market crash, but the opportunity set for TAA strategies has not become more attractive.
RELATED RESEARCH
Risk-Managed Equity Exposure II
Risk-Managed Equity Exposure
Market Timing vs Risk Management
Market Timing with Multiples, Momentum, and Volatility
ABOUT THE AUTHOR
Nicolas Rabener is the CEO & Founder of Finominal, which empowers professional investors with data, technology, and research insights to improve their investment outcomes. Previously he created Jackdaw Capital, an award-winning quantitative hedge fund. Before that Nicolas worked at GIC and Citigroup in London and New York. Nicolas holds a Master of Finance from HHL Leipzig Graduate School of Management, is a CAIA charter holder, and enjoys endurance sports (Ironman & 100km Ultramarathon).
Connect with me on LinkedIn or X.

