Risk Parity & Rising Rates
Risky Risk Parity?
May 2022. Reading Time: 10 Minutes. Author: Nicolas Rabener.
SUMMARY
- Risk parity strategies have become available via mutual funds and ETFs, but portfolio construction varies
- Rising interest rates are seen as a threat and recent performance was disappointing
- However, rising correlations between stocks and bonds would be more concerning
INTRODUCTION
Risk parity has been challenged ever since the world’s central banks have brought interest rates to approximately zero via quantitative easing programs post the global financial crisis in 2009.
The strategy aims to allocate the same risk to different asset classes, which results in bonds getting the largest allocation due to these being less volatile than stocks. Given that bonds have been in a bull market since the 1980s, having overweighted fixed income, often with leverage, has been a winning bet. It also created fortunes for early proponents of the strategy, like Ray Dalio at Bridgewater Associates.
Asset managers that offer risk parity products like to highlight that rising interest rates are not all bad for bond allocations as it does imply higher yields. After all, the long-term return of a bond is related to its starting yield. Naturally, this argumentation ignores any losses on bonds that are sold before maturity (read ETFs for Rising Interest Rates).
As inflation has reared its ugly head across nations, central bankers have started raising interest rates, which represents a new market environment for the majority of investors. In this research note, we will evaluate the recent performance of risk parity indices and products as interest rates have increased from record lows.
RISK PARITY INDICES & INTEREST RATES
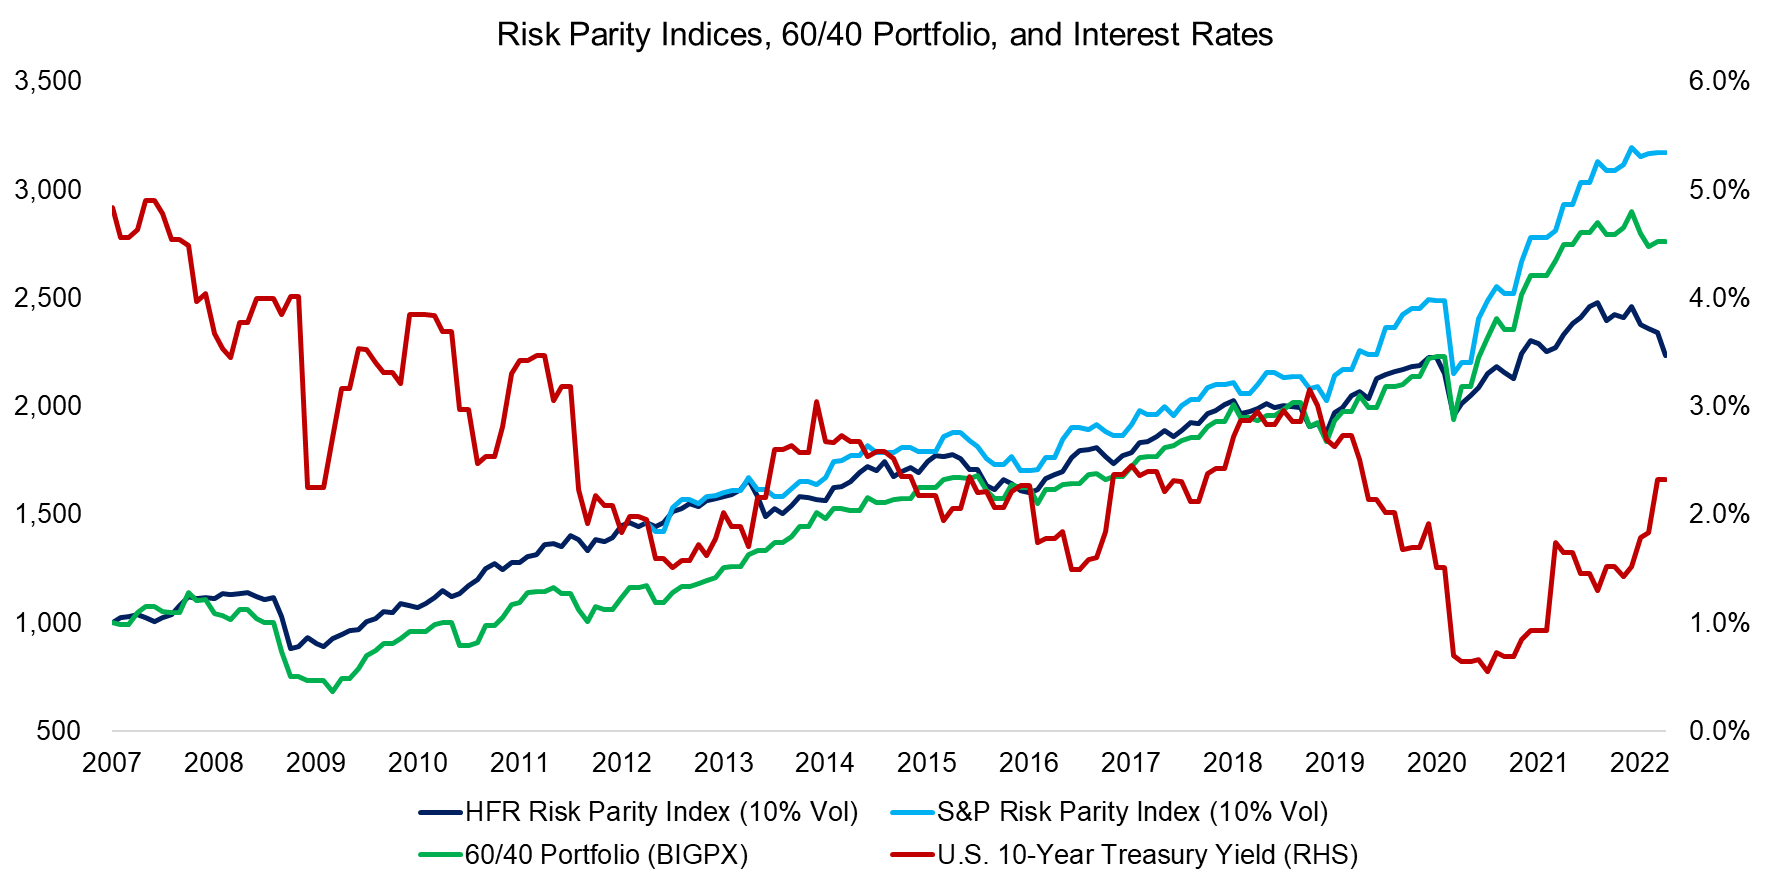
We use two risk parity indices namely the HFR Risk Parity Index and S&P Risk Parity Index as benchmarks in this analysis. The former consists of single fund managers pursuing the strategy, while the latter is simply an index calculated by S&P. Both target a volatility of 10% per annum on the index level, which is achieved via scaling the exposure to asset classes up and down. If required, leverage is used.
We observe that both indices featured the same trends over the last decade, which was similar to a 60/40 portfolio that allocates 60% to equities and 40% to bonds with quarterly rebalancing. However, we also see different total returns across the entire period, which is especially pronounced in 2022 when interest rates have increased. The index from S&P and the 60/40 portfolio are somewhat flat year-to-date, while the HFR Risk Parity Index has generated negative returns. Declining bond prices are partially responsible, but falling equity valuations also played a role (read Musing about S&P 500 Valuations).
Source: FactorResearch
RISK PARITY ETFS & MUTUAL FUNDS
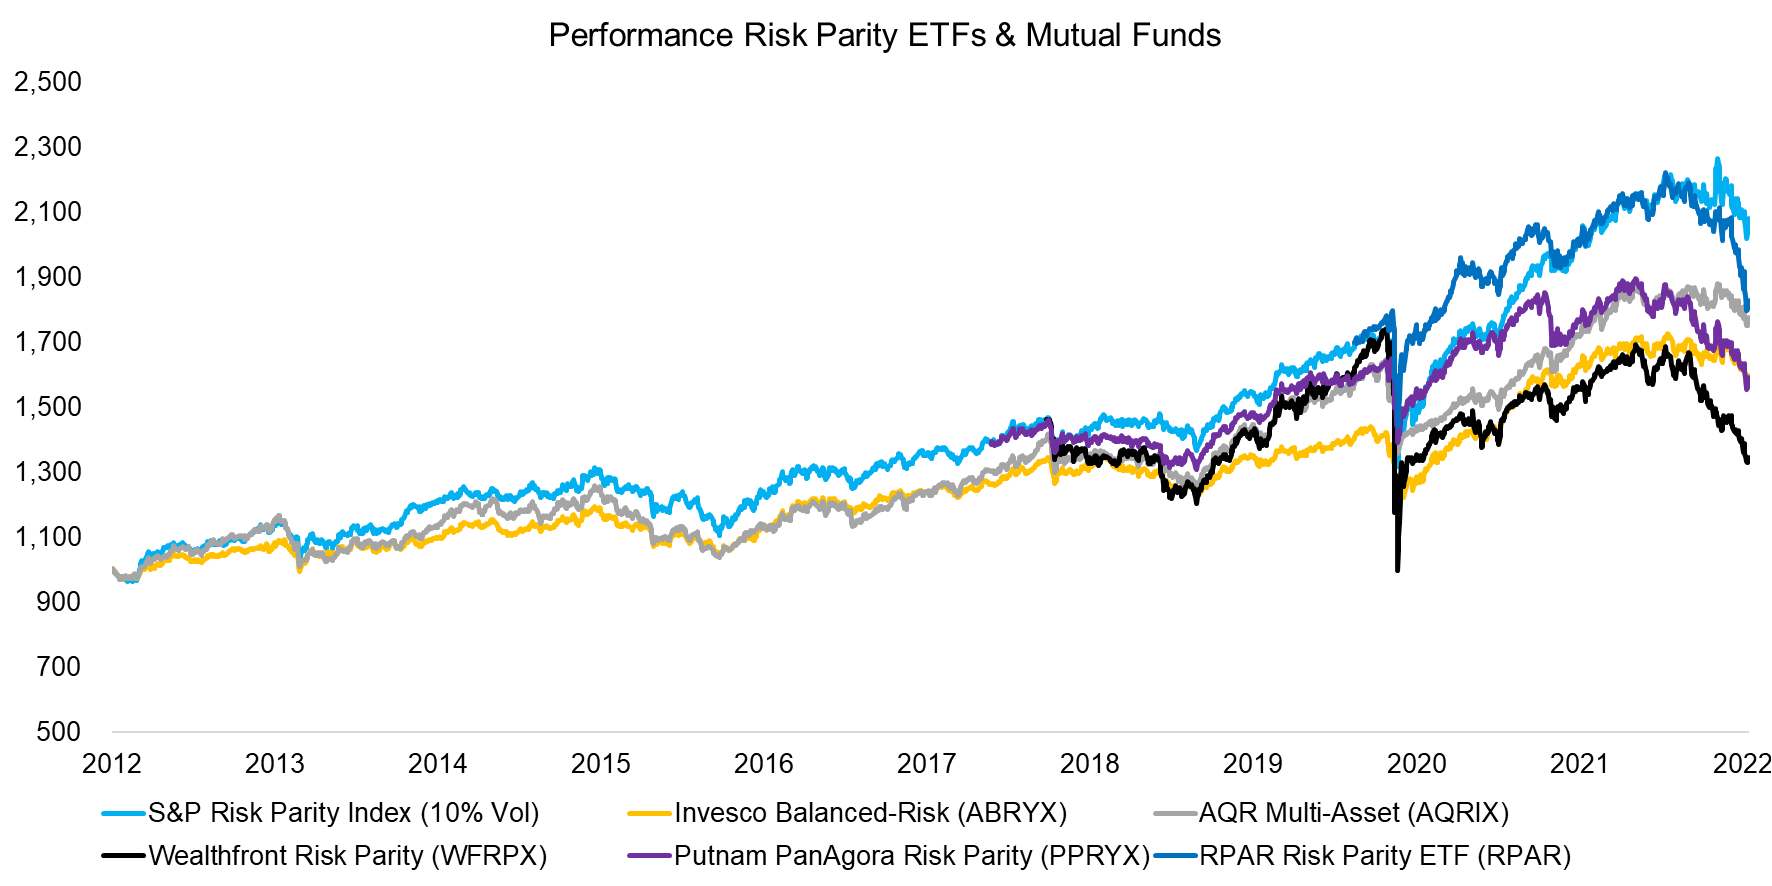
Risk parity has become available to investors via mutual funds and more recently via ETFs at fees ranging from 0.25% to 1.13% per annum. It is worth highlighting that these cumulatively only manage about $5 billion of assets, which is less than 10% of what Bridgewater Associates is managing in its equivalent product that is named the All Weather Fund.
We compare the performance of these five products and observe the same trends, which highlight similar risk exposures. However, the returns were different in the period from 2012 to 2022, which is explained by different allocation of weights, leverage, or a combination of these.
Source: FactorResearch.
MAX DRAWDOWNS OF RISK PARITY PRODUCTS
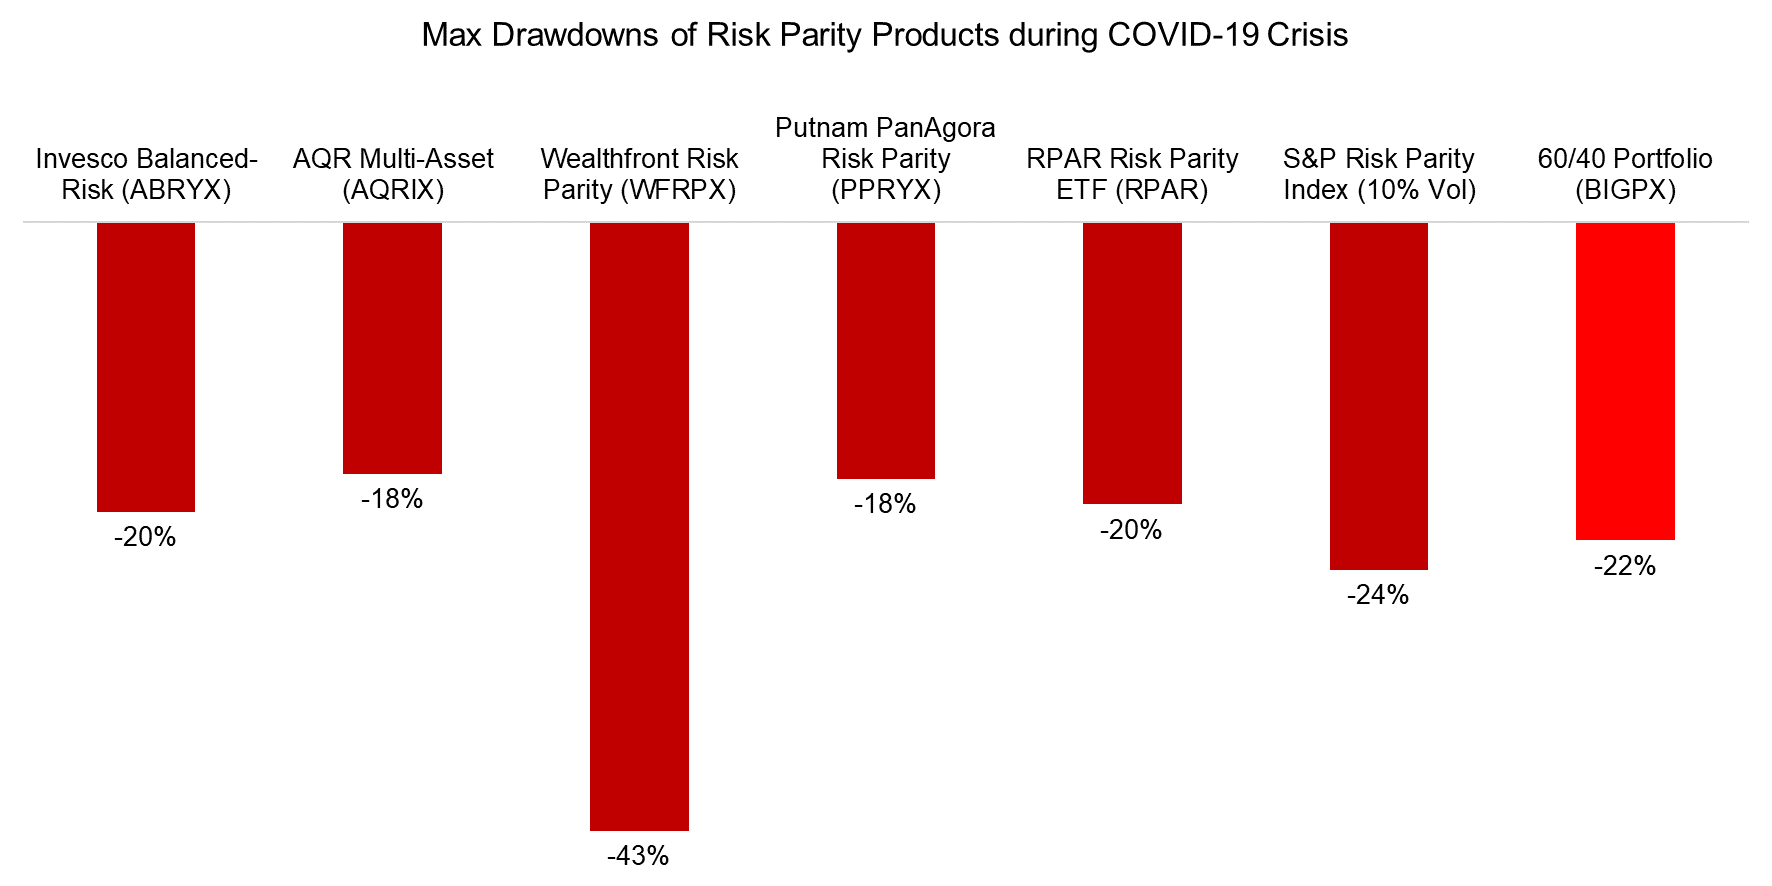
The differences in portfolio construction are best observed during the COVID-19 crisis in March 2020, where all strategies experienced significant drawdowns that can be attributed to the equity exposure. Although all products lost money and failed to be all weather strategies, some did considerably better.
For example, the Wealthfron Risk Parity product lost 43% of its value, compared to a mere 18% for Putnam PanAgora’s product. A 60/40 portfolio did remarkable well with a 22% loss.
Source: FactorResearch
FACTOR EXPOSURE ANALYSIS
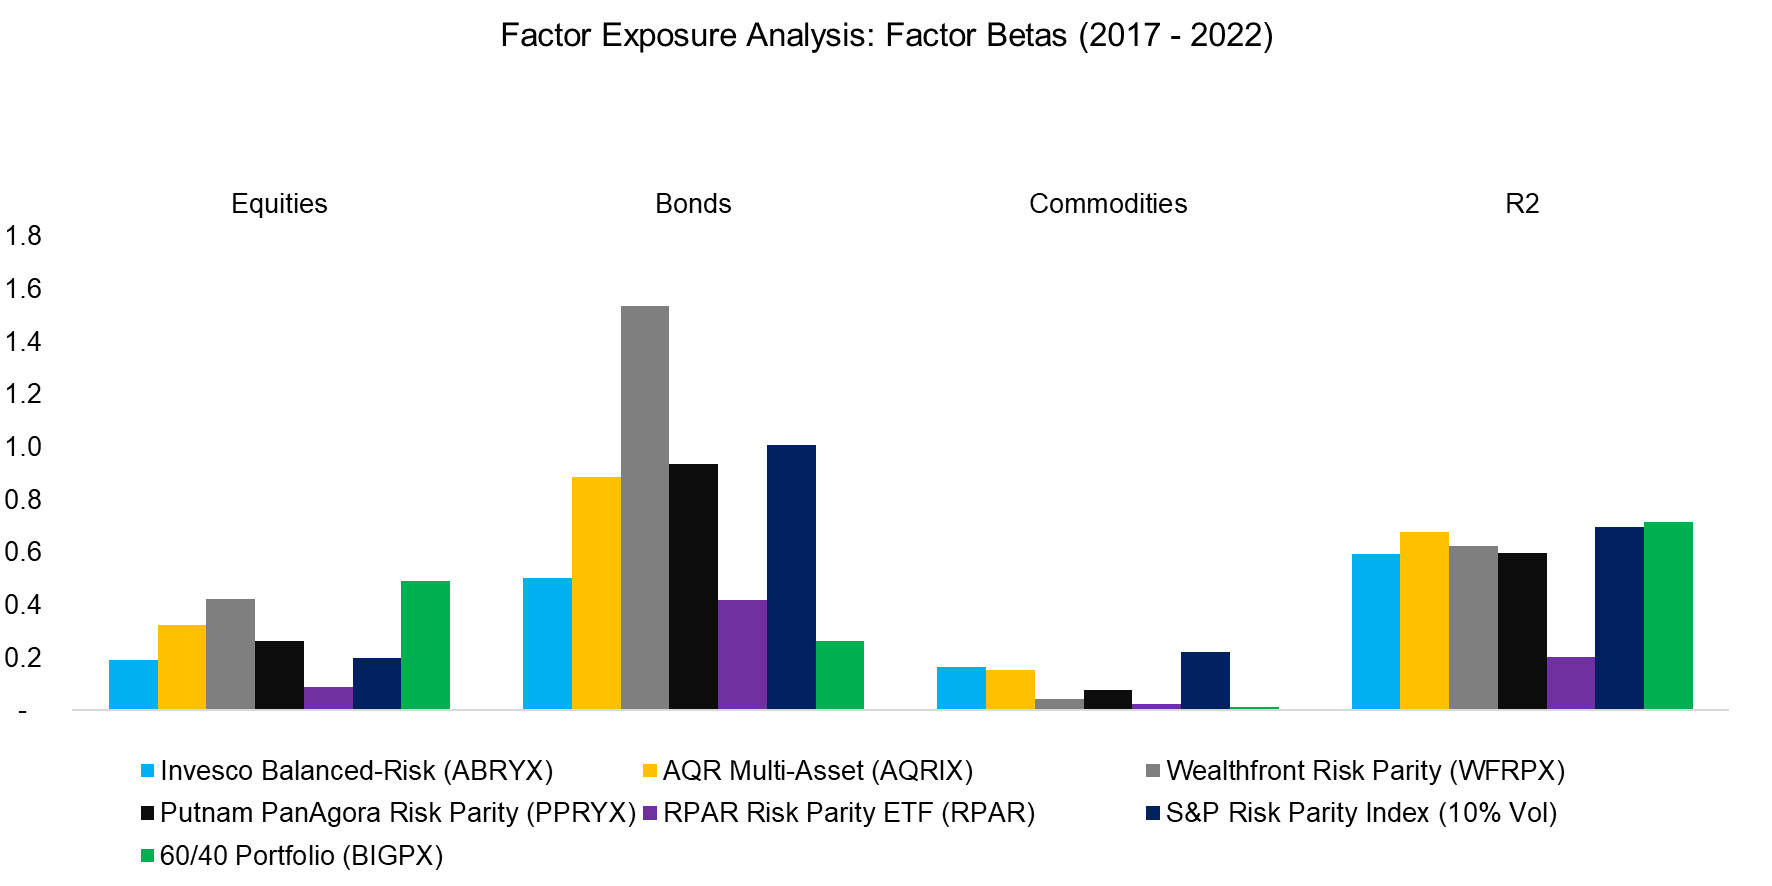
Asset managers tend to be scarce with details on their portfolios, except for the ETF issuers that are forced to disclose their holdings. However, we can run a factor exposure analysis to learn more about the portfolio construction. We only use three indices, the S&P 500, the Bloomberg US Aggregate Bond Index, and the S&P GSCI Commodity Index, as independent variables.
The analysis highlights that the exposure to asset classes varies across products as expected. Furthermore, fixed income dominates in line with the risk-based asset allocation framework, except for the 60/40 portfolio, which has a higher allocation to equities than bonds, per definition.
Source: FactorResearch
CONTRIBUTION ANALYSIS
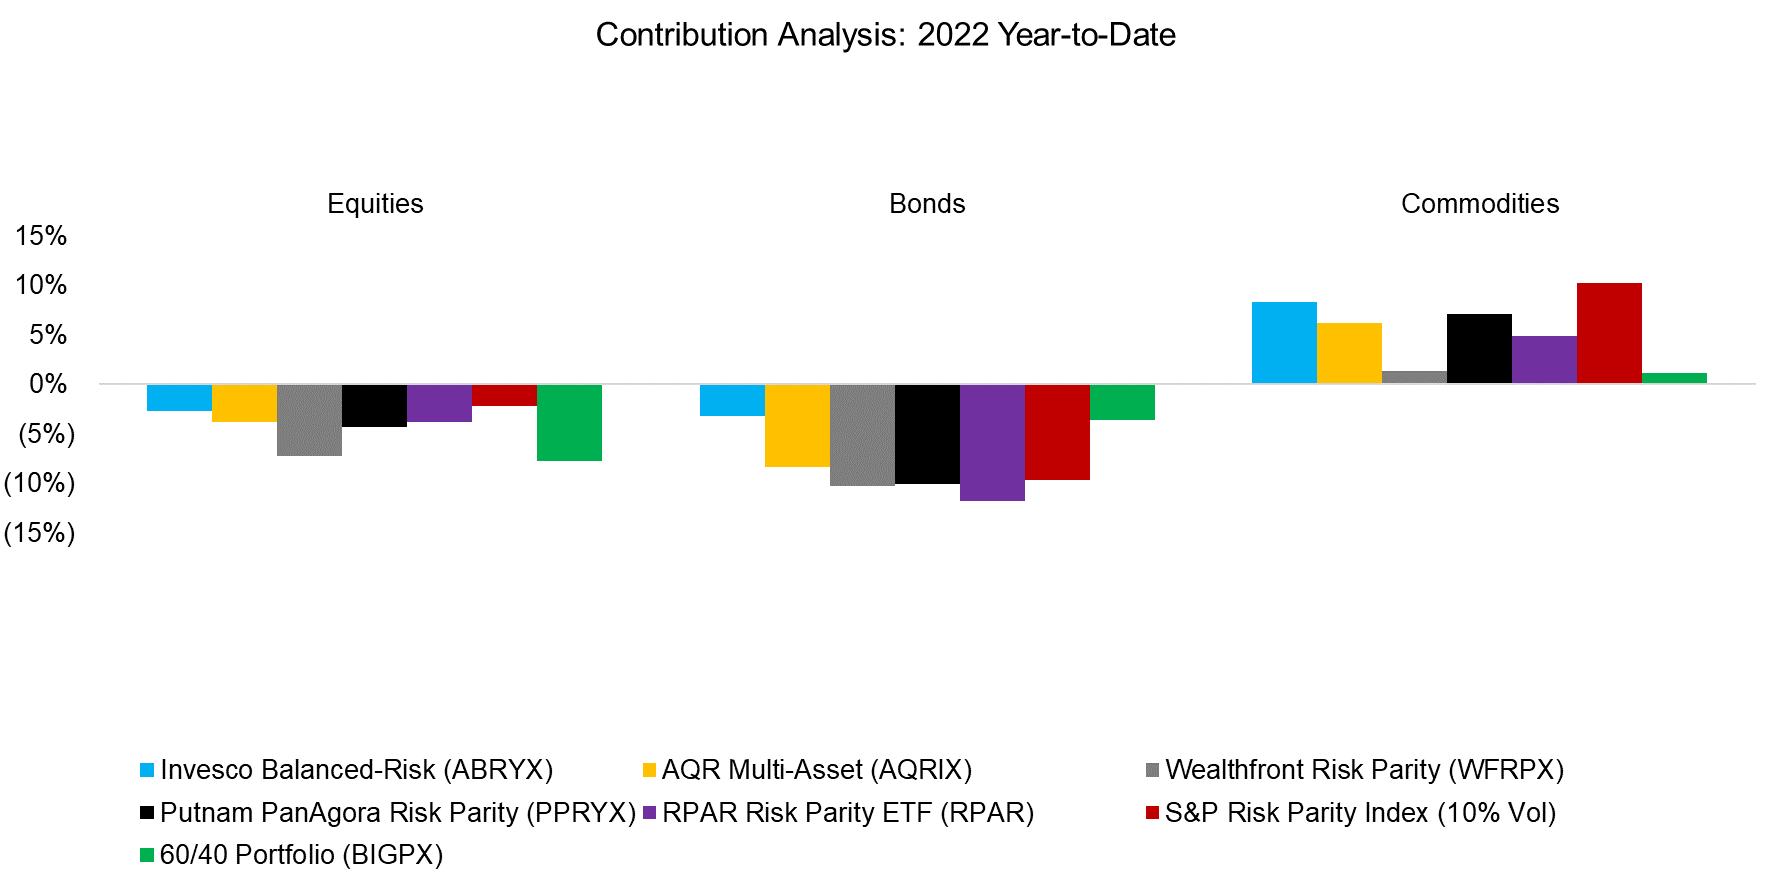
We can use the results from the factor exposure analysis to derive a contribution analysis and analyze the year-to-date 2022 performance of risk parity products. We observe that equities and bonds contributed negatively, while commodities offset some of these losses.
Inflation was high before the war in Ukraine but has reached new highs in some countries like Germany which are large importers of oil and gas. Rising commodity prices have contributed to inflation, where investors have benefitted from commodity exposure, which nicely highlights the case for diversification across asset classes, even if performance has been mediocre, which applies to commodities in the previous decade.
Source: FactorResearch
FURTHER THOUGHTS
Looking back, it is easy to see why risk parity worked wonderfully over the last few decades. However, looking forward, investors may be concerned about the strategy as there seems more downside from rising than upside from decreasing interest rates, given that they are still close to zero in most countries.
However, if bond prices decline rapidly, then their volatility would increase, and allocations to fixed income decrease in a risk parity portfolio accordingly. AQR recently highlighted that a risk-based allocation approach in commodities would have been superior to size-based weighting in the period from 1991 to 2021, providing support for the asset allocation framework.
Rising interest rates lower the expected return for risk parity strategies, but do not necessarily make the asset allocation framework unattractive. The more significant threat would be a rising correlation between stocks and bonds. Although less conceivable currently, a severe debt crisis and subsequent restructuring might create such a scenario, eg in Japan where public debt is unsustainably high, the population steadily shrinking, and the central bank is the top shareholder of domestic ETFs.
RELATED RESEARCH
No Longer Superheroes? The Twilight of Bonds
Bonds & the Invisible Thief
60/40 Portfolios Without Bonds
Building a Diversified Portfolio for the Long-Term – Part II
Building a Diversified Portfolio for the Long-Term
REFERENCED RESEARCH
ABOUT THE AUTHOR
Nicolas Rabener is the CEO & Founder of Finominal, which empowers professional investors with data, technology, and research insights to improve their investment outcomes. Previously he created Jackdaw Capital, an award-winning quantitative hedge fund. Before that Nicolas worked at GIC and Citigroup in London and New York. Nicolas holds a Master of Finance from HHL Leipzig Graduate School of Management, is a CAIA charter holder, and enjoys endurance sports (Ironman & 100km Ultramarathon).
Connect with me on LinkedIn or X.

