Sector versus Country Momentum
Does Performance Chasing Work?
June 2018. Reading Time: 10 Minutes. Author: Nicolas Rabener.
SUMMARY
- The Momentum strategy can be applied to stocks, sectors and countries
- Sector and country Momentum portfolios generate positive excess returns
- However, cross sector & country and single stock Momentum portfolios generate higher risk-return ratios
INTRODUCTION
When a graduate joins the M&A division of an investment bank in Europe he or she often has to decide between a country or sector focus. Both have advantages and disadvantages, but are difficult to evaluate at the start of a career as an investment banker. Joining the Technology team was highly desirable in 1999, but much less attractive in 2002. Focusing on M&A transactions in Russia tends to be more interesting when oil and gas prices are high, but energy prices are volatile and difficult to predict.
Investors analysing European stocks often face a similar choice: should they focus on all of Europe, on certain countries or sectors? Many investors decide to simply chase performance and allocate to whatever country or sector has recently performed best, which is often criticised as an investment philosophy. Naturally this strategy can be evaluated quantitatively as it represents the Momentum factor. In this short research note we compare Momentum in sectors versus countries in the European stock market (read Momentum Factor: Intra vs Cross-Sector).
METHODOLOGY
We focus on the Momentum factor across sectors and countries in Europe, which comprises 11 sectors and 17 countries that are available as market capitalisation-weighted indices. The Momentum factor is created via a long-short beta-neutral portfolio based on the top and bottom 3 sectors or countries ranked by the returns over the last 12 months excluding the last month. Only stocks with a minimum market capitalisation of $1 billion are included. Portfolios are rebalanced monthly and each transaction incurs costs of 10 basis points.
SECTORS VERSUS COUNTRIES
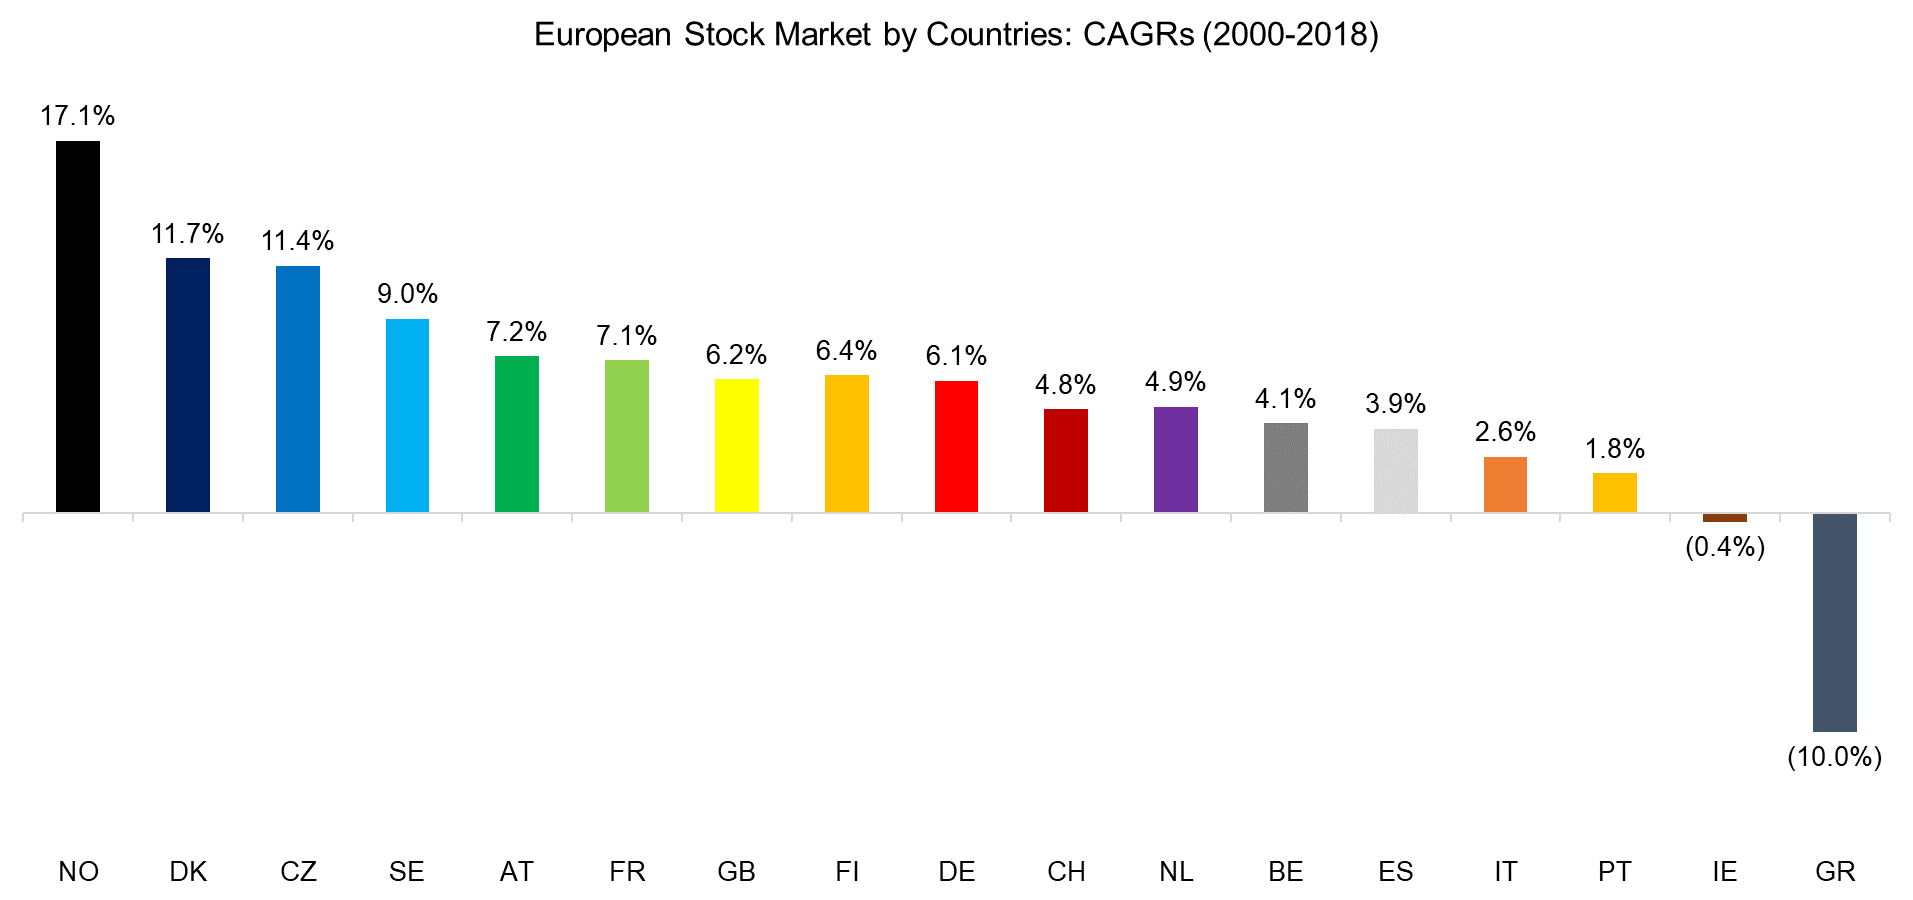
Analysing the performance of various European stock markets from 2000 to 2018 reveals quite divergent returns. The compounded annual returns highlighted in the chart below display an almost perfect geographical split: northern countries like Norway, which mostly have not adopted the Euro, generated the highest returns, central core Euro countries like Germany had average returns, while southern countries like Greece generated the lowest returns.
Source: FactorResearch
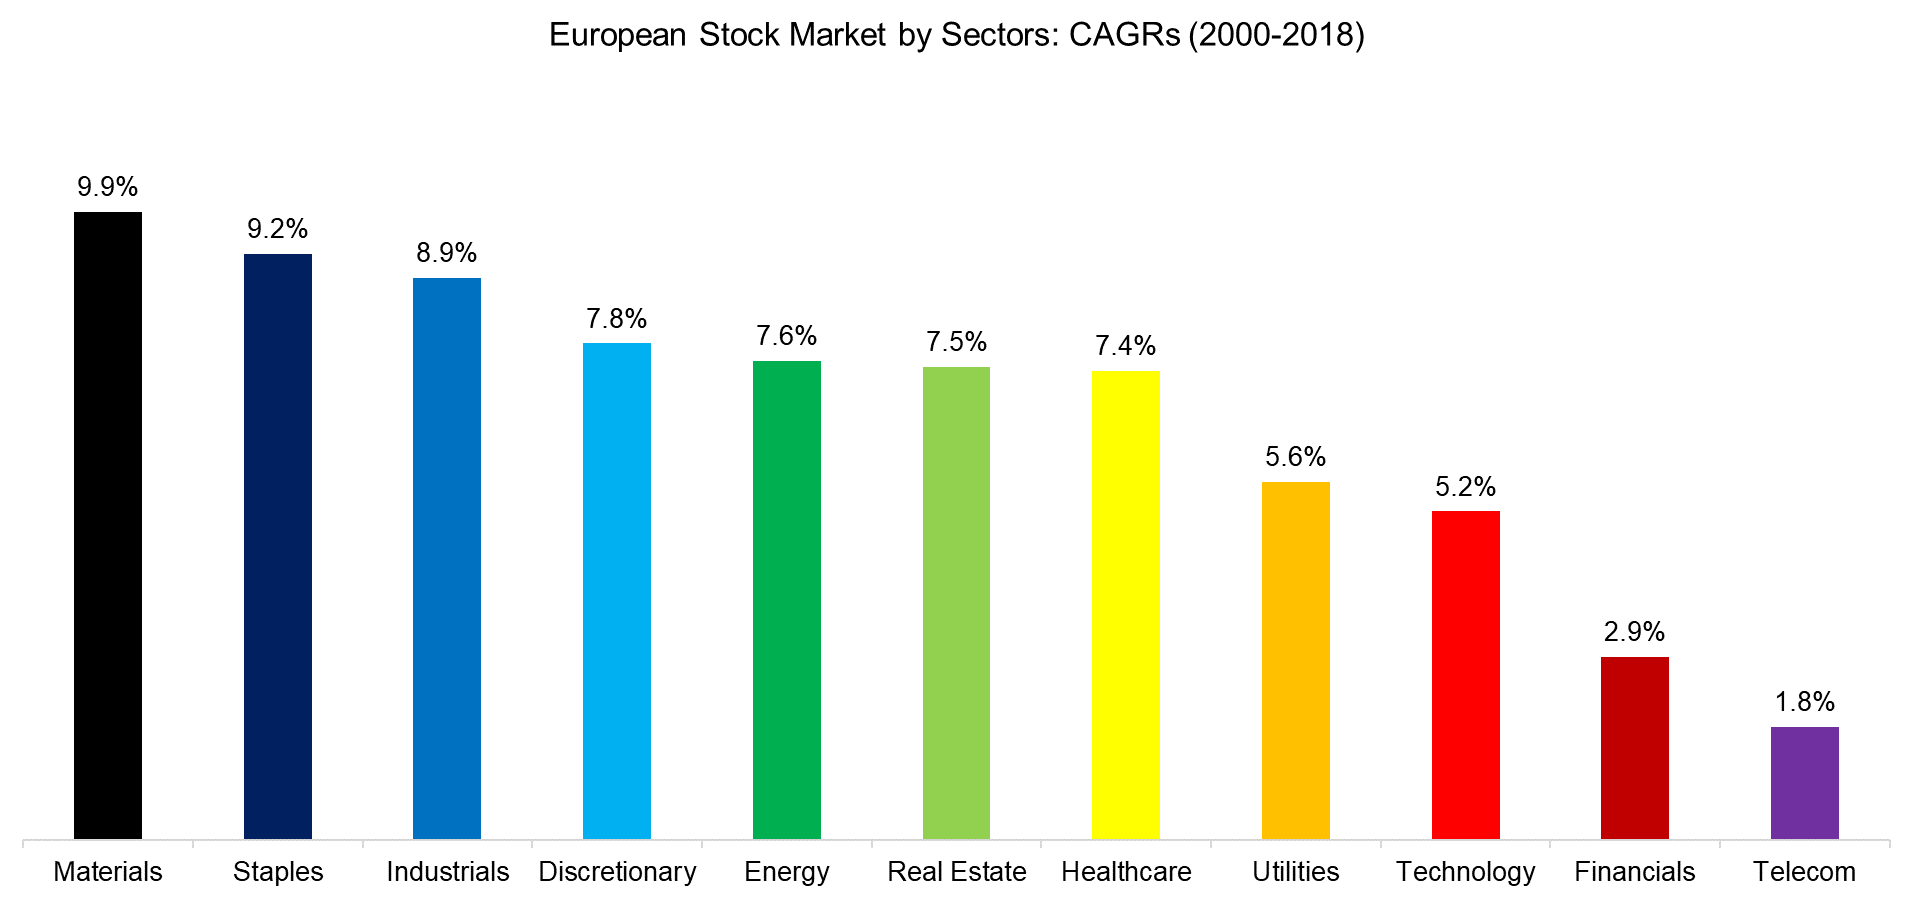
The performance of sectors is slightly less divergent than the performance of countries, but this can be explained by that there are only 11 sectors compared to 17 countries. Perhaps the most surprising performance is that of the Technology sector in Europe, which is below the average of all sectors. The performance is measured from 2000 onward, i.e. captures the implosion of the Technology bubble and the downfall of Nokia, which used to have a large weight in the sector index. There are also no European equivalents of the FAANG stocks, which have been driving the performance of the Technology sector in the US.
Source: FactorResearch
SECTOR VERSUS COUNTRY MOMENTUM
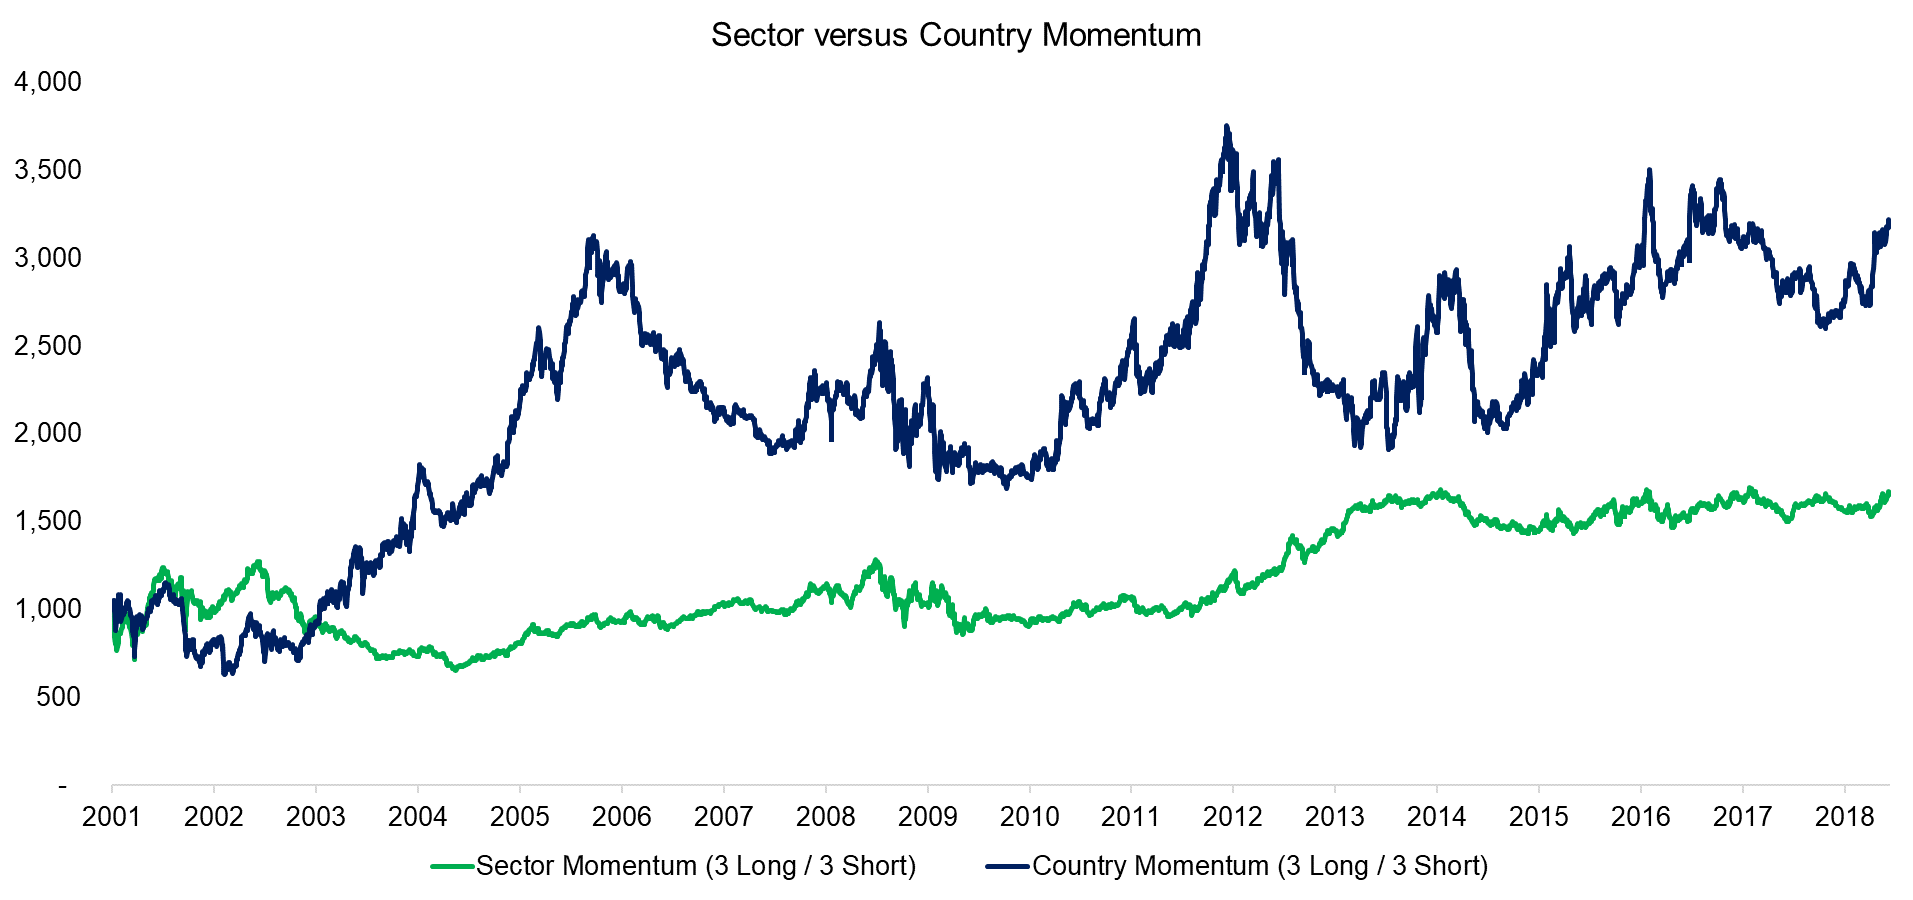
The Momentum factor is well documented on single stock level, where the strategy consists of buying the best performing and shorting the worst performing stocks. The same concept can be applied to sector and country indices and the results are shown below. We can observe that the performance of both long-short portfolios was positive, indicating that simple performance chasing with frequent rebalancing was an effective strategy. The performance of Momentum on country level is higher, but also more volatile than on sector level, which can be explained by that there are more countries than sectors. The Momentum factor benefits from a more diversified universe as the positions in the portfolio will be less correlated (read Factors: Correlation Check).
Source: FactorResearch
CROSS SECTOR & COUNTRY MOMENTUM
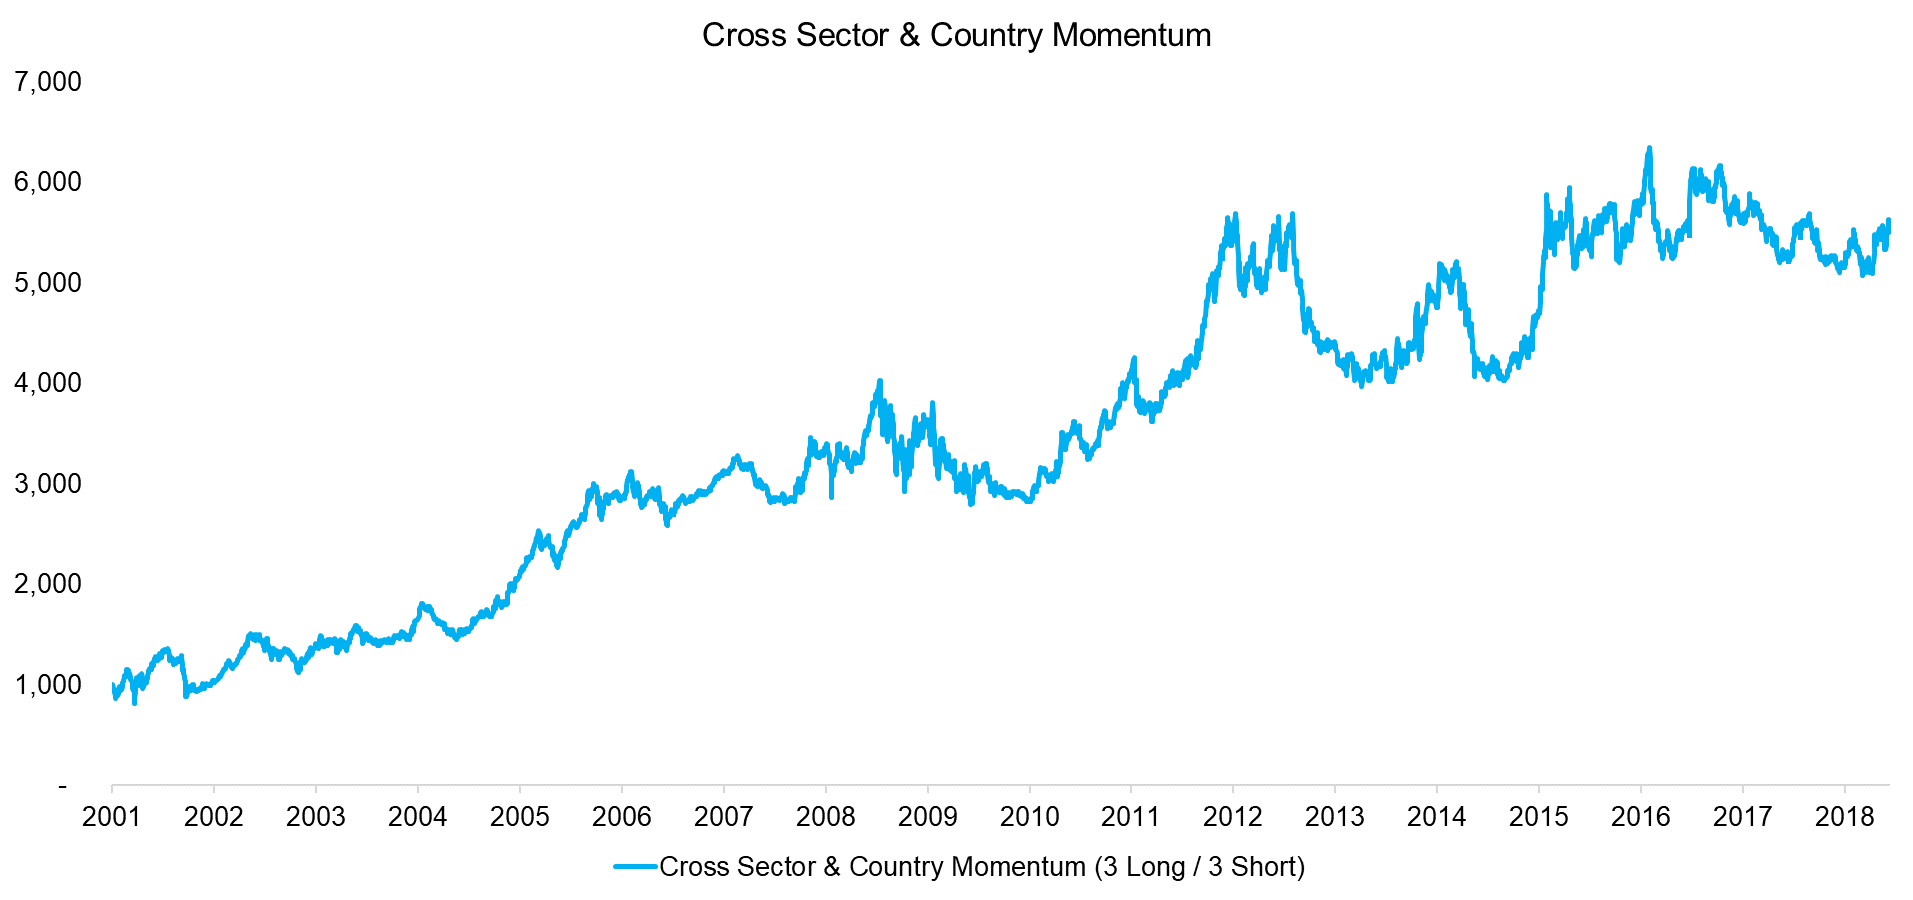
Given that the Momentum factor benefits from a larger number of securities, we can combine countries and sectors into one universe. The chart below shows the performance of the cross sector and country Momentum portfolio, which highlights a relatively consistent performance over time, albeit with high volatility. The performance achieved is significantly above the sector or country-only portfolios.
Source: FactorResearch
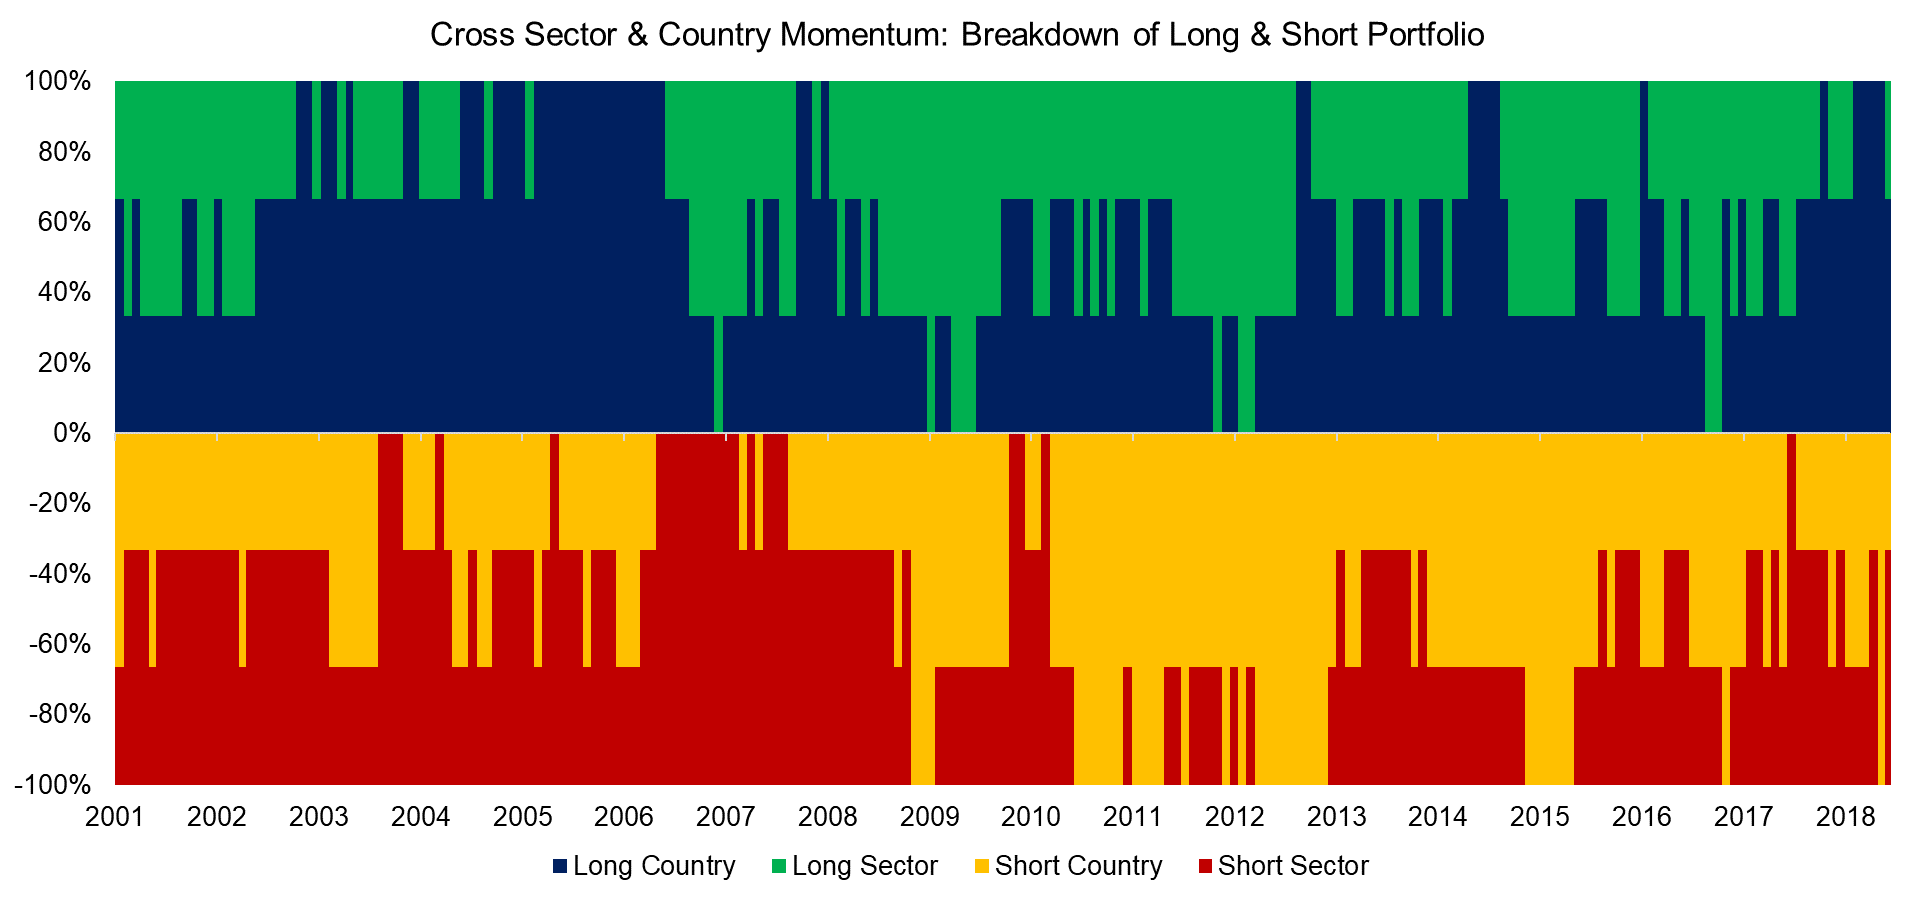
The analysis below highlights the portfolio composition over time, which reveals a diverse portfolio. There were few times where the long or short portfolio was exclusively allocated to sectors or countries. The latest portfolio consists of long positions in the energy sector, the Czech and Norwegian stock markets, and short positions in the healthcare and staples sectors as well as the Belgian stock market. The latest portfolio does highlight related positions, e.g. Norway’s economy is driven by oil, which is also driving the energy sector.
Source: FactorResearch
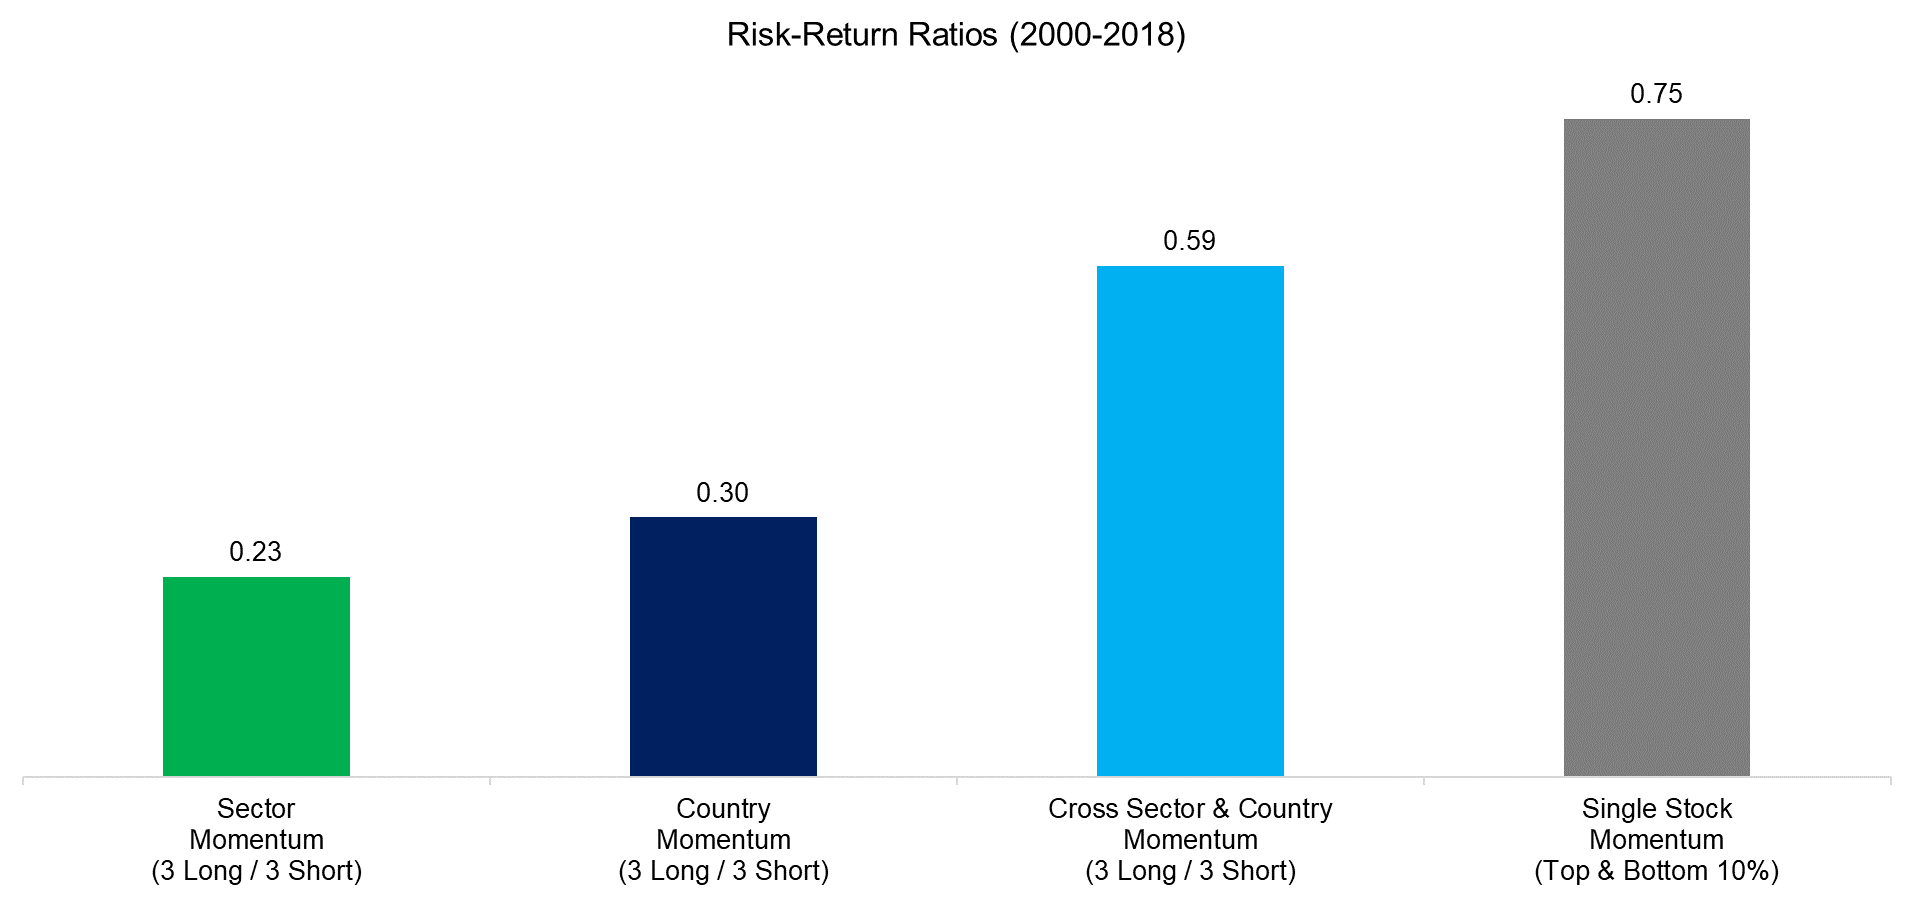
The cross sector and country Momentum portfolio generated the highest absolute and risk-adjusted returns compared to sector or country-only portfolios. However, the risk-return ratio of a Momentum portfolio created from single stocks is even more attractive, which perhaps can be explained by a much more diversified portfolio given the universe of approximately 600 European stocks with a minimum market capitalisation of $1 billion.
Source: FactorResearch
FURTHER THOUGHTS
This short research note shows that long-short Momentum portfolios of sectors or countries in European stock markets generated positive excess returns over the last two decades. However, there is solid empirical evidence that buying the mutual funds with the best recent performance is not an effective strategy, which may seem at odds with this analysis. These opposing views can potentially be explained by different portfolio construction. The Momentum factor requires frequent rebalancing to generate positive returns as the top and bottom sectors, countries or stocks change constantly. Less frequent rebalancing leads to a significant decay in returns. Performance chasing works, under certain assumptions.
ABOUT THE AUTHOR
Nicolas Rabener is the CEO & Founder of Finominal, which empowers professional investors with data, technology, and research insights to improve their investment outcomes. Previously he created Jackdaw Capital, an award-winning quantitative hedge fund. Before that Nicolas worked at GIC and Citigroup in London and New York. Nicolas holds a Master of Finance from HHL Leipzig Graduate School of Management, is a CAIA charter holder, and enjoys endurance sports (Ironman & 100km Ultramarathon).
Connect with me on LinkedIn or X.

