Factor Exposure Analysis 105: Sectors versus Factors
Why do investors prefer factors over sectors?
June 2022. Reading Time: 10 Minutes. Author: Nicolas Rabener.
SUMMARY
- Investors tend to talk more about sector than factor performance
- However, few investors conduct a regression-based sector exposure analysis
- The high correlations of sectors, even if structured market-neutral, makes this less meaningful
INTRODUCTION
Switch on CNBC or Bloomberg TV during US stock trading hours and there is a good probability of listening to a lively discussion on current sector performance, eg staples are down, tech stocks are up for the day. The price action is typically explained by economic or company-specific news such as “Microsoft reported quarterly EPS above estimates, dragging the sector along”.
There also tends to be talk about factors, but much less than on sectors. And it is almost exclusively about growth versus value stocks. Rarely do moderators and guests talk about the investment or low volatility factors, perhaps due to these being too abstract compared to sectors that most people are familiar with.
However, when doing due diligence on a mutual fund investors prefer a factor over a sector exposure analysis. Why is that?
In this research article, we will contrast regression-based sector versus factor exposure analysis (read Factor Exposure Analysis 100: Holdings vs Regression-Based).
SECURITY SELECTION
We use 30 ETFs in this analysis that are trading in the US stock market, which includes actively and passively managed strategies. We create three groups that are comprised of the following ETFs:
- Smart Beta ETFs: Vanguard Value ETF (VTV), iShares Core S&P Small-Cap ETF (IJR), WisdomTree U.S. Value Fund (WTV), Alpha Architect U.S. Quantitative Value ETF (QVAL), Vanguard Small-Cap Value ETF (VBR), Vanguard Small-Cap Growth ETF (VBK), Franklin Liberty U.S. Low Volatility ETF (FLLV), Vanguard U.S. Minimum Volatility ETF (VFMV), iShares MSCI USA Quality Factor ETF (QUAL), Vanguard U.S. Multifactor ETF (VFMF)
- Random ETFs: ARK Innovation ETF (ARKK), Invesco Solar ETF (TAN), ARK Genomic Revolution ETF (ARKG), WisdomTree U.S. ESG Fund (RESP), VanEck Agribusiness ETF (MOO), AI Powered Equity ETF (AIEQ), ETFMG Alternative Harvest ETF (MJ), ProShares Pet Care ETF (PAWZ), Global X Millennial Consumer ETF (MILN), U.S. Vegan Climate ETF (VEGN)
- Sector ETFs: Invesco Active U.S. Real Estate ETF (PSR), Schwab U.S. REIT ETF (SCHH), First Trust North American Energy Infrastructure Fund (EMLP), Virtus Reaves Utilities ETF (UTES), Health Care Select Sector SPDR Fund (XLV), Financial Select Sector SPDR Fund (XLF), Consumer Staples Select Sector SPDR Fund (XLP), Materials Select Sector SPDR Fund (XLB), Main Sector Rotation ETF (SECT), Anfield U.S. Equity Sector Rotation ETF (AESR)
FACTOR EXPOSURE ANALYSIS
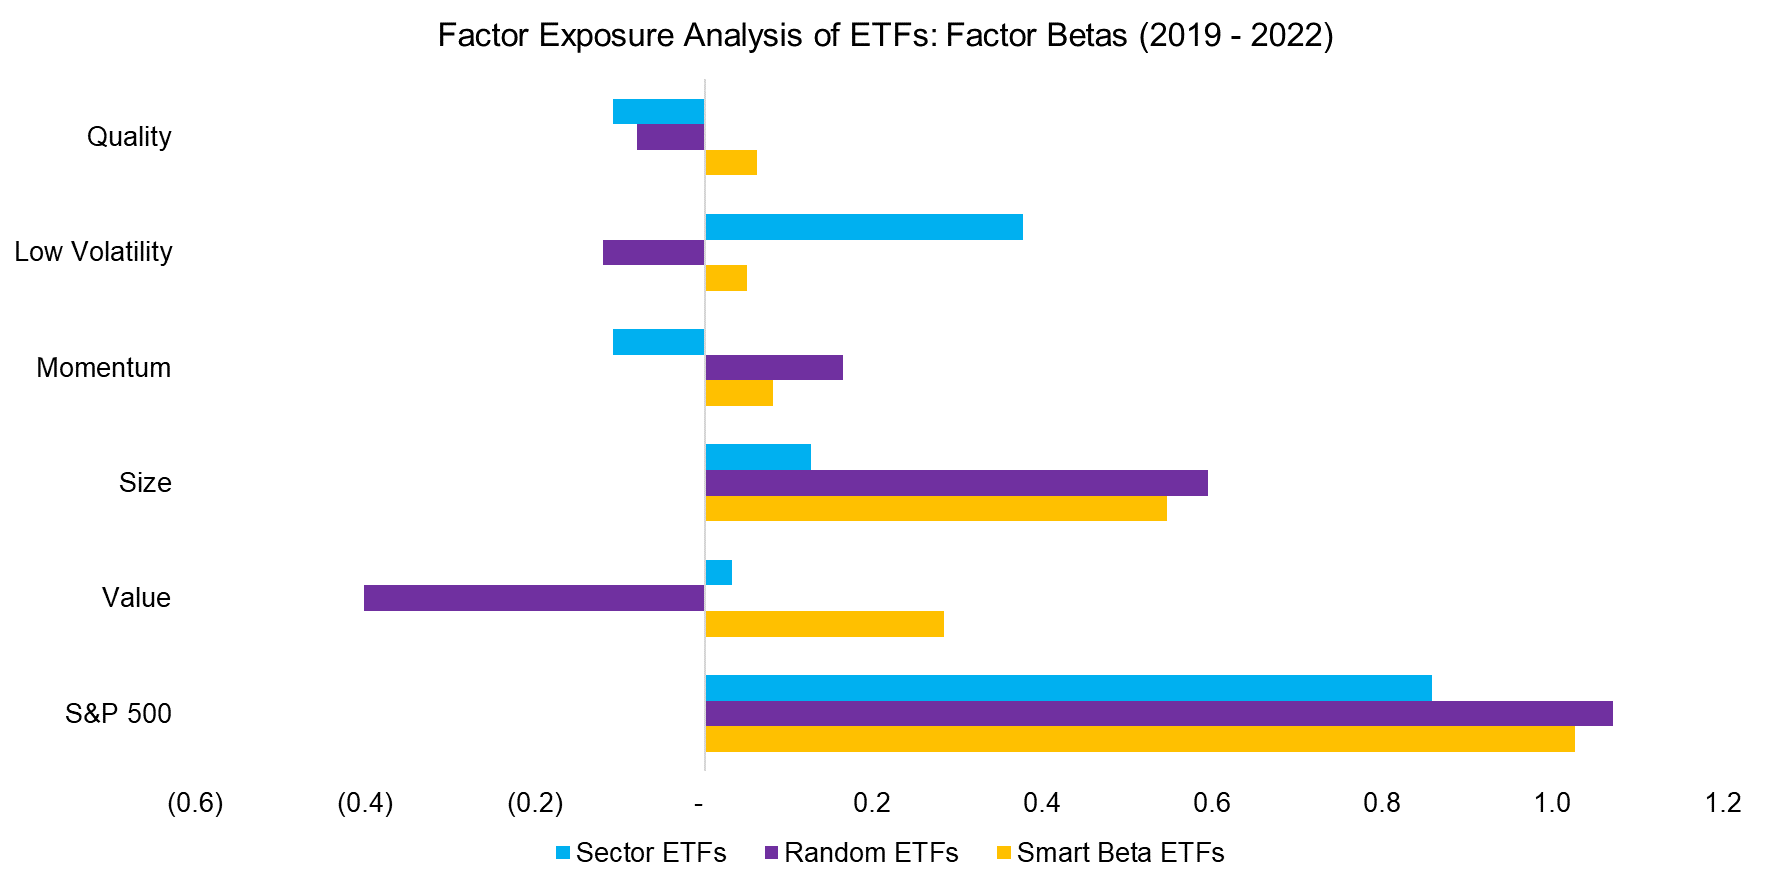
We start with a simple factor exposure analysis that provides the factor betas for each ETF to the stock market and five academically recognized factors. The factor betas are calculated based on daily data for the last three years.
We observe that these ETFs primarily provide long-only exposure to the US stock market as the median factor betas were close to one to the S&P 500. However, the exposure to factors differs across the three ETF categories and includes negative and positive exposures.
Noteworthy is the negative exposure to the value factor from the Random ETFs, which can be attributed to the ARK Innovation ETF (ARKK) and ARK Genomic Revolution ETF (ARKG). These two ETFs have concentrated portfolios and contain stocks that are extremely expensive, eg Telsa.
The Smart Beta ETFs have significant positive exposure to value and size, which can be attributed to the small-cap and value ETFs we selected. The Sector ETFs only have significant positive exposure to the low volatility factor, which is explained by the real estate and utilities ETFs. These stocks exhibit lower volatility given the nature of their industries.

Source: FactorResearch
SECTOR EXPOSURE ANALYSIS
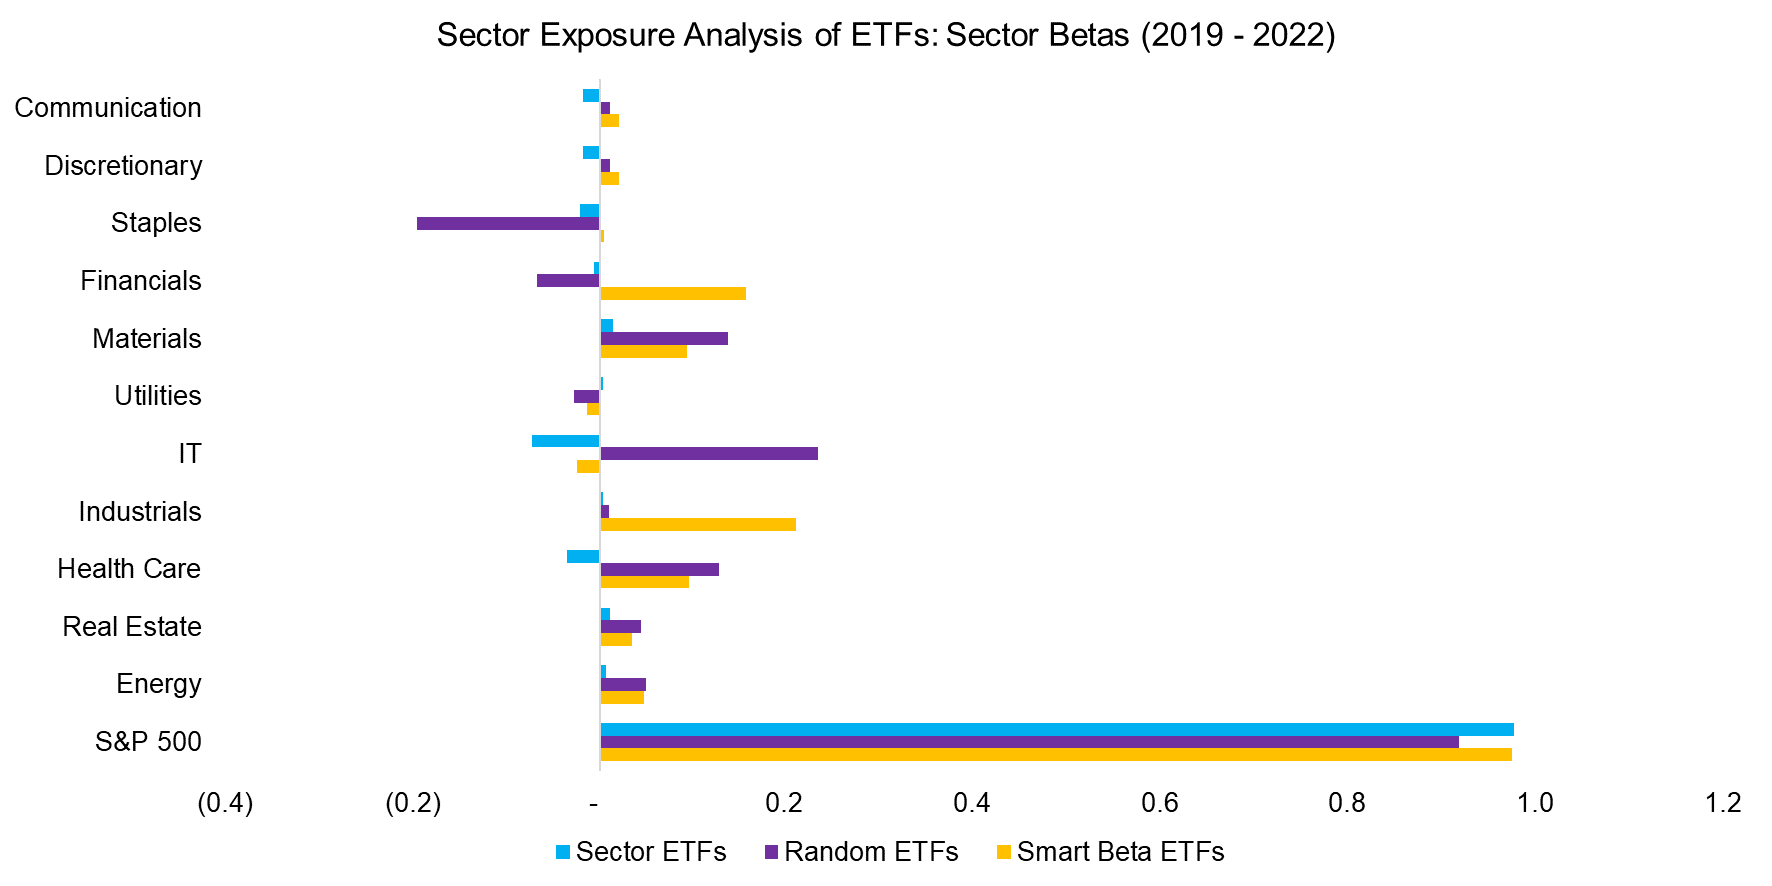
Next, we use 13 sector indices based on the US stock market and transform these into market-neutral indices by stripping out the exposure to the stock market. We then run a regression analysis for each of the 30 ETFs against these 13 market-neutral sector indices and the stock market.
We again observe that the stock market, ie the S&P 500, explains most of the returns. Somewhat surprisingly, Sector ETFs had less positive and negative factor betas compared to Smart Beta and Random ETFs. However, this makes sense as most of these ETFs only have exposure to one sector, therefore the average across 10 ETFs will be close to zero given that we selected different sector ETFs. For example, the Virtus Reaves Utilities ETF (UTES) has a factor beta of 0.8 to the utilities sector index, but the betas of almost all other ETFs was zero to utilities.
The Random and Smart Beta ETFs had significant positive and negative exposure to sectors, which highlights the bets that investors are taking. For example, the Invesco Solar ETF (TAN) had strongly negative exposure to consumer staple stocks.

Source: FactorResearch
COMPARING SECTOR VS FACTOR BASED EXPOSURE ANALYSIS
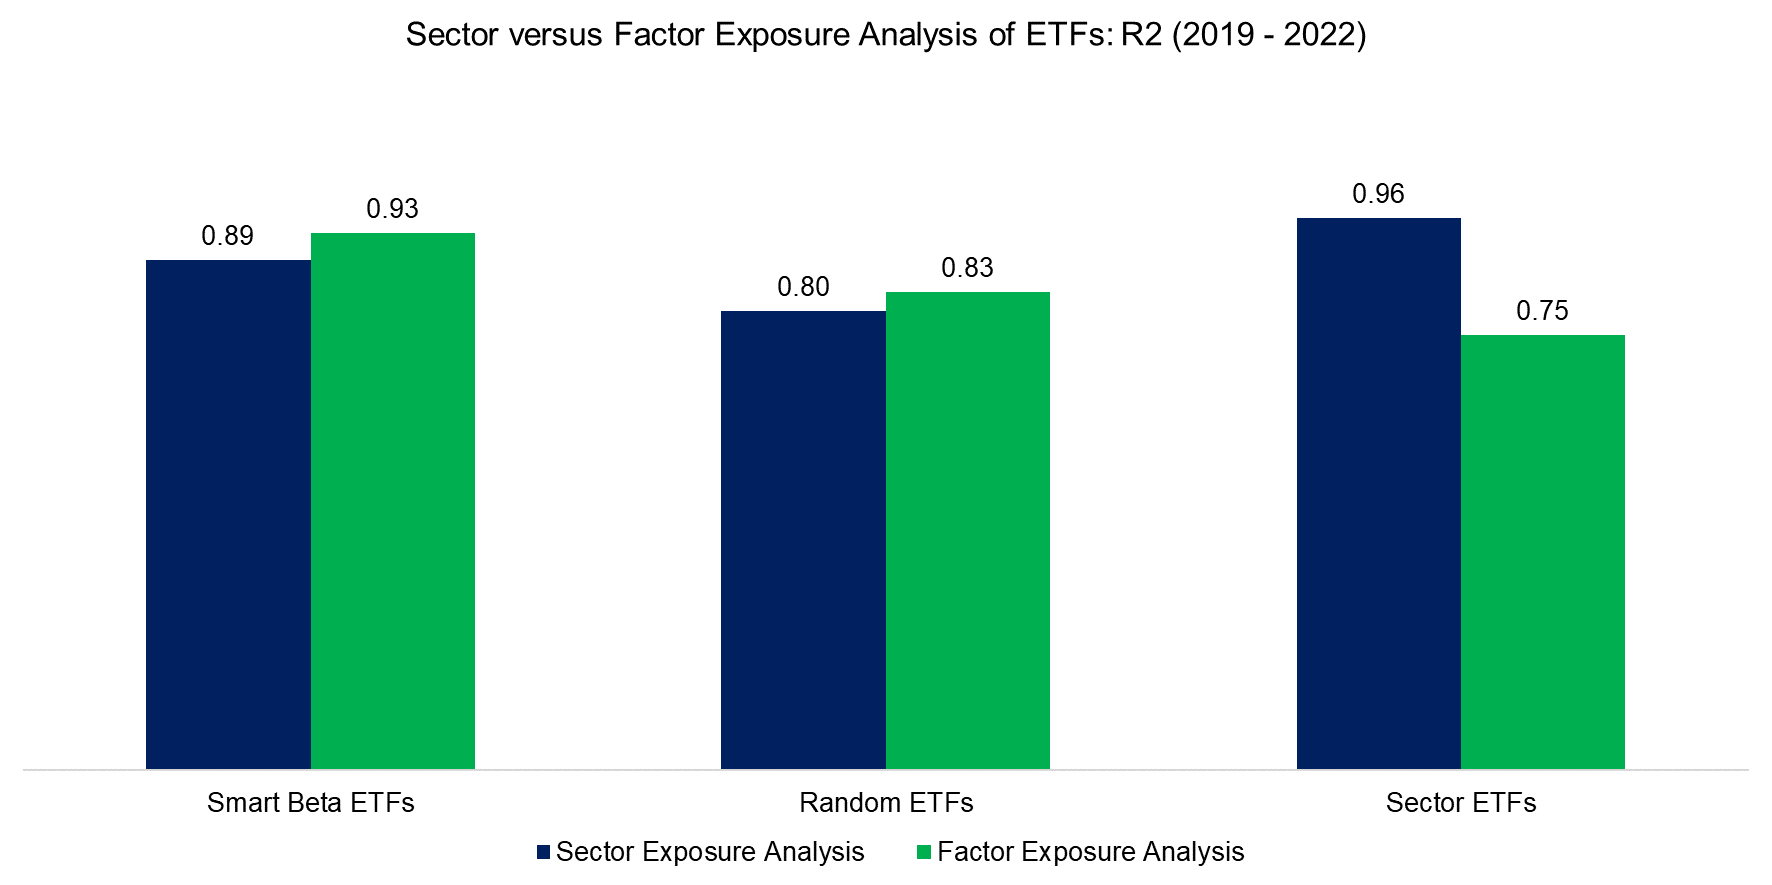
Given that we have been running regression analyses to derive the factor betas, we can compare the R2 of both data sets to see which one offered a higher explanatory power. However, contrasting the R2 does not favor the factor over the sector exposure analysis (read What’s in a Factor? Breakdown by Sectors).
As expected, the median R2 was higher when using factors to analyze smart beta ETFs, and similarly higher when using sector indices for sector ETFs. The R2 for Random ETFs was almost the same when using factors or sectors.

Source: FactorResearch
Although the R2 of the regression analysis did not indicate that factors are superior to sectors, these two data sets have some fundamental differences. All sectors are bets on economic growth as companies can increase earnings easier when GDP growth is positive. Essentially this means that the sector indices, even after removing the stock market exposure, remain correlated.
However, the correlations are critical for a regression analysis as the methodology requires independent variables to be meaningful. We observe that none of the market-neutral sector indices were negatively correlated, and some were highly positively correlated.

Source: FactorResearch
In contrast to sectors, there are less clear relationships between factors. Some are structurally correlated, eg value and size positively and value and momentum negatively, but this is highly time-dependent.
Factors represent investment styles that have different return drivers, which means that these are less correlated and are better independent variables than sectors for a regression analysis.

Source: FactorResearch
FURTHER THOUGHTS
Although there is a stronger case for a factor than a sector exposure analysis, there is little harm in doing both. In fact, other variables like inflation or interest rates should be used to complement the picture of what is driving the risk and return of a portfolio. Such analysis might not help in increasing the expected returns, but it does highlight potential risks. The more data, the merrier.
RELATED RESEARCH
Time Machines for Investors
Factor Exposure Analysis 104: Fixed Income ETFs
Factor Exposure Analysis 103: Exploring Residualization
Factor Exposure Analysis 102: More or Less Independent Variables?
Factor Exposure Analysis 101: Linear vs Lasso Regression
Factor Exposure Analysis 100: Holdings vs Regression-Based
ABOUT THE AUTHOR
Nicolas Rabener is the CEO & Founder of Finominal, which empowers professional investors with data, technology, and research insights to improve their investment outcomes. Previously he created Jackdaw Capital, an award-winning quantitative hedge fund. Before that Nicolas worked at GIC and Citigroup in London and New York. Nicolas holds a Master of Finance from HHL Leipzig Graduate School of Management, is a CAIA charter holder, and enjoys endurance sports (Ironman & 100km Ultramarathon).
Connect with me on LinkedIn or X.

