Sector vs Factor-based Benchmark Selection
Same, same, but different?
September 2022. Reading Time: 10 Minutes. Author: Nicolas Rabener.
SUMMARY
- Manager-selected benchmarks are suboptimal as they are not free of conflict of interests
- Investors can use sectors to identify more appropriate benchmarks
- However, this ignores factors, which are better at explaining investment returns
INTRODUCTION
In our last research article (read Mirror, Mirror on the Wall, which is the fairest Benchmark of them All?) we highlighted that investors can use factor exposure analysis to identify and select the most appropriate benchmark for a mutual fund, or even a portfolio with diverse assets.
Investors generally rely on the choice of benchmark provided by the asset manager, but these are not necessarily the most suitable as fund managers want to portray their performance in the most favorable way, i.e. there is a conflict of interests. The mantra should be “trust, but verify”.
However, instead of using factors, investors could also use sectors for creating a systematic benchmark selection process, which may seem to be more intuitive, especially when evaluating sector-focused funds.
In this research article, we will contrast sector with factor-based benchmark selection.
ARKK’S BREAKDOWN BY SECTORS
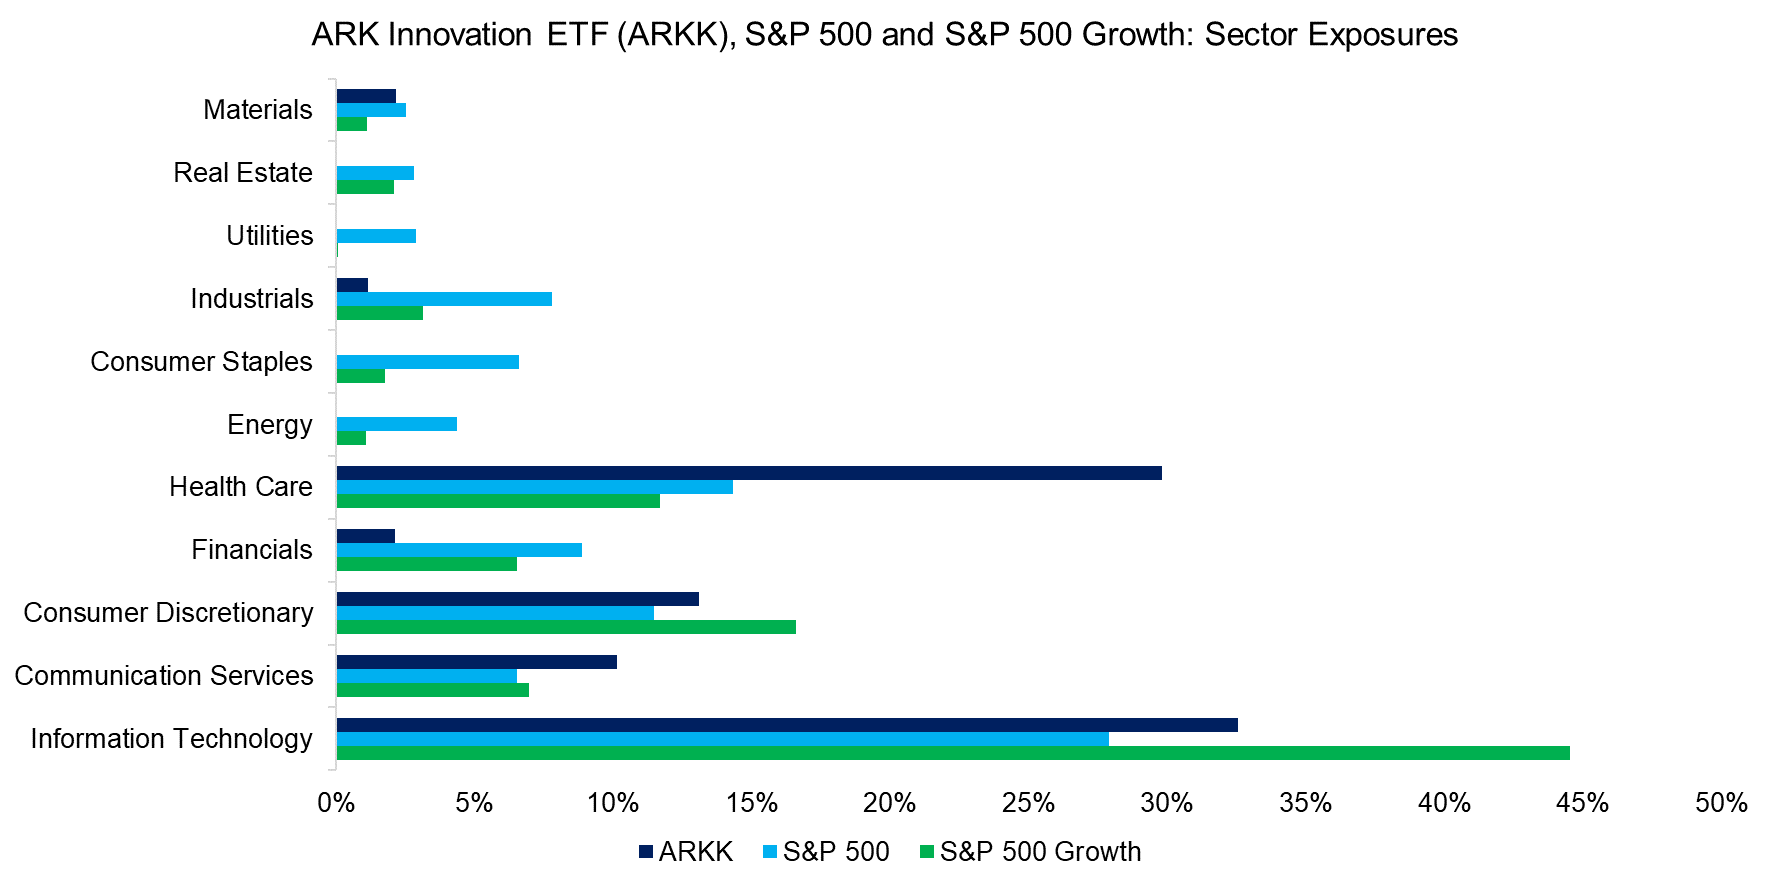
As in the previous analysis, we use the ARKK Innovation ETF (ARKK) as a case study. The ETF’s primary benchmark is the S&P 500 as per the asset manager’s factsheet. ARKK’s portfolio is highly concentrated and holds mainly growth stocks like Tesla, while the S&P 500 represents a diversified portfolio across all sectors, i.e. is unlikely the optimal benchmark.
Given this, we include the S&P 500 Growth index when conducting a simple breakdown by sector analysis. We observe there was some overlap in sectors between ARKK and the two indices, but in some cases, the ETF’s exposure was closer to the S&P 500 Growth than that of the broader S&P 500 index, eg utilities, industrials, or consumer staples.
Source: FactorResearch
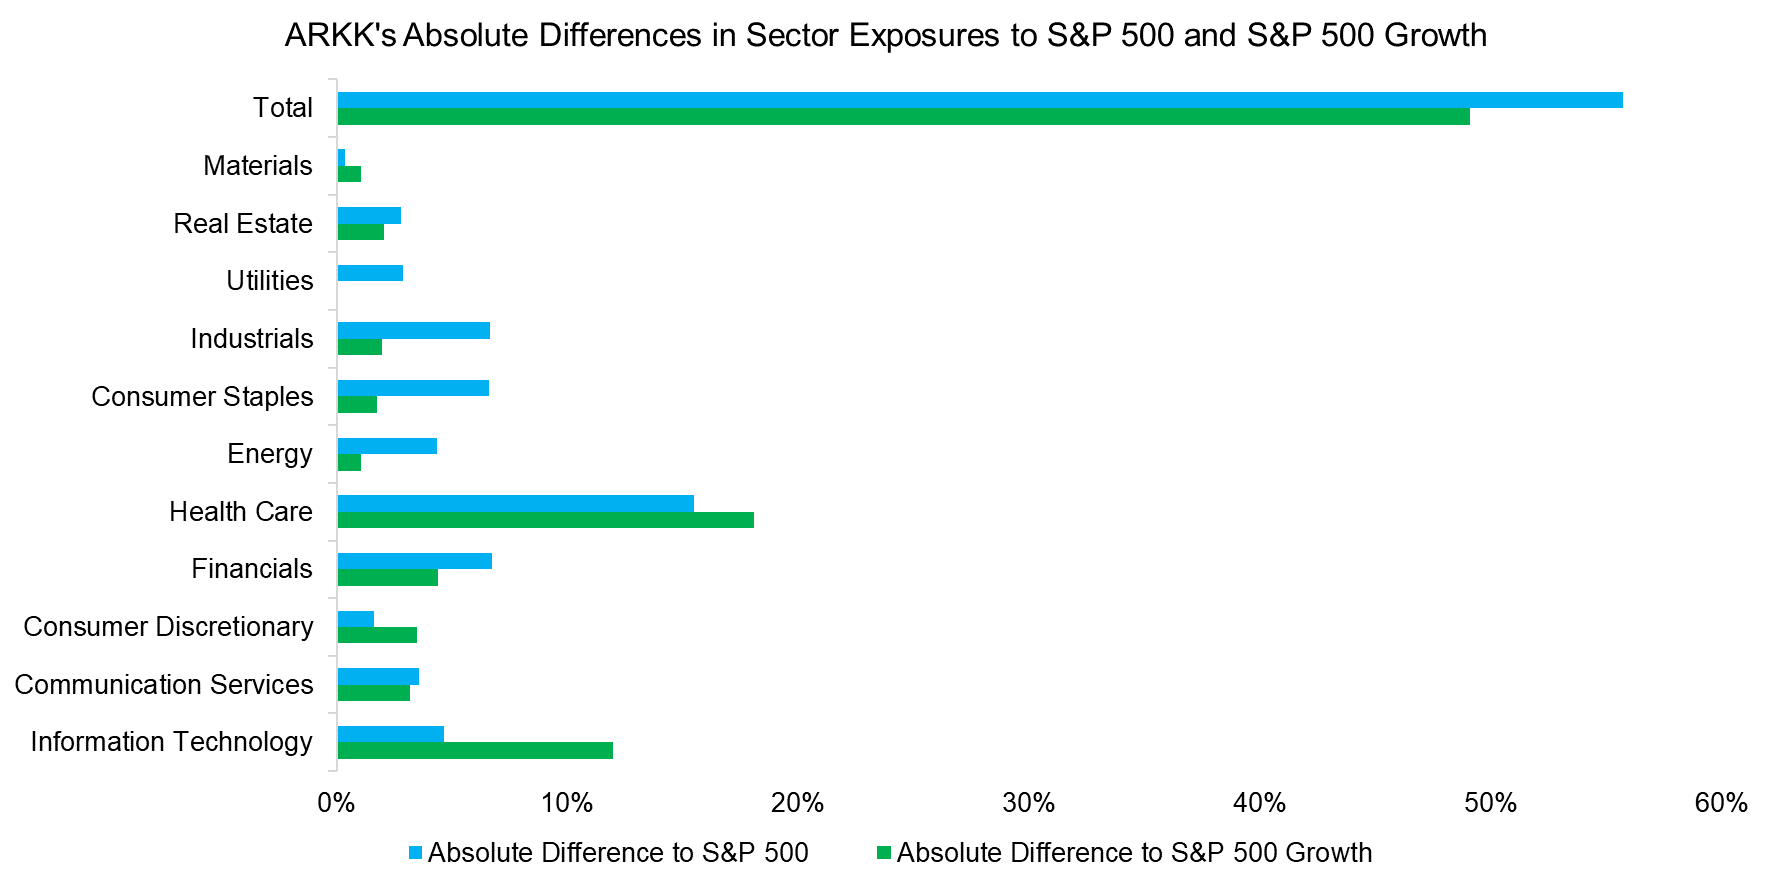
We can highlight the differences between ARKK and the two indices by subtracting their sector exposures from the ETFs. Furthermore, we calculate the sum of the absolute differences, which shows that the S&P 500 Growth index had a smaller absolute difference, which can be interpreted as being more similar to ARKK than the S&P 500.
Naturally, this result is intuitive given that ARKK’s portfolio is primarily comprised of growth stocks that have larger weights in the S&P 500 Growth than the S&P 500 index.
Source: FactorResearch
SECTOR-BASED BENCHMARK SELECTION
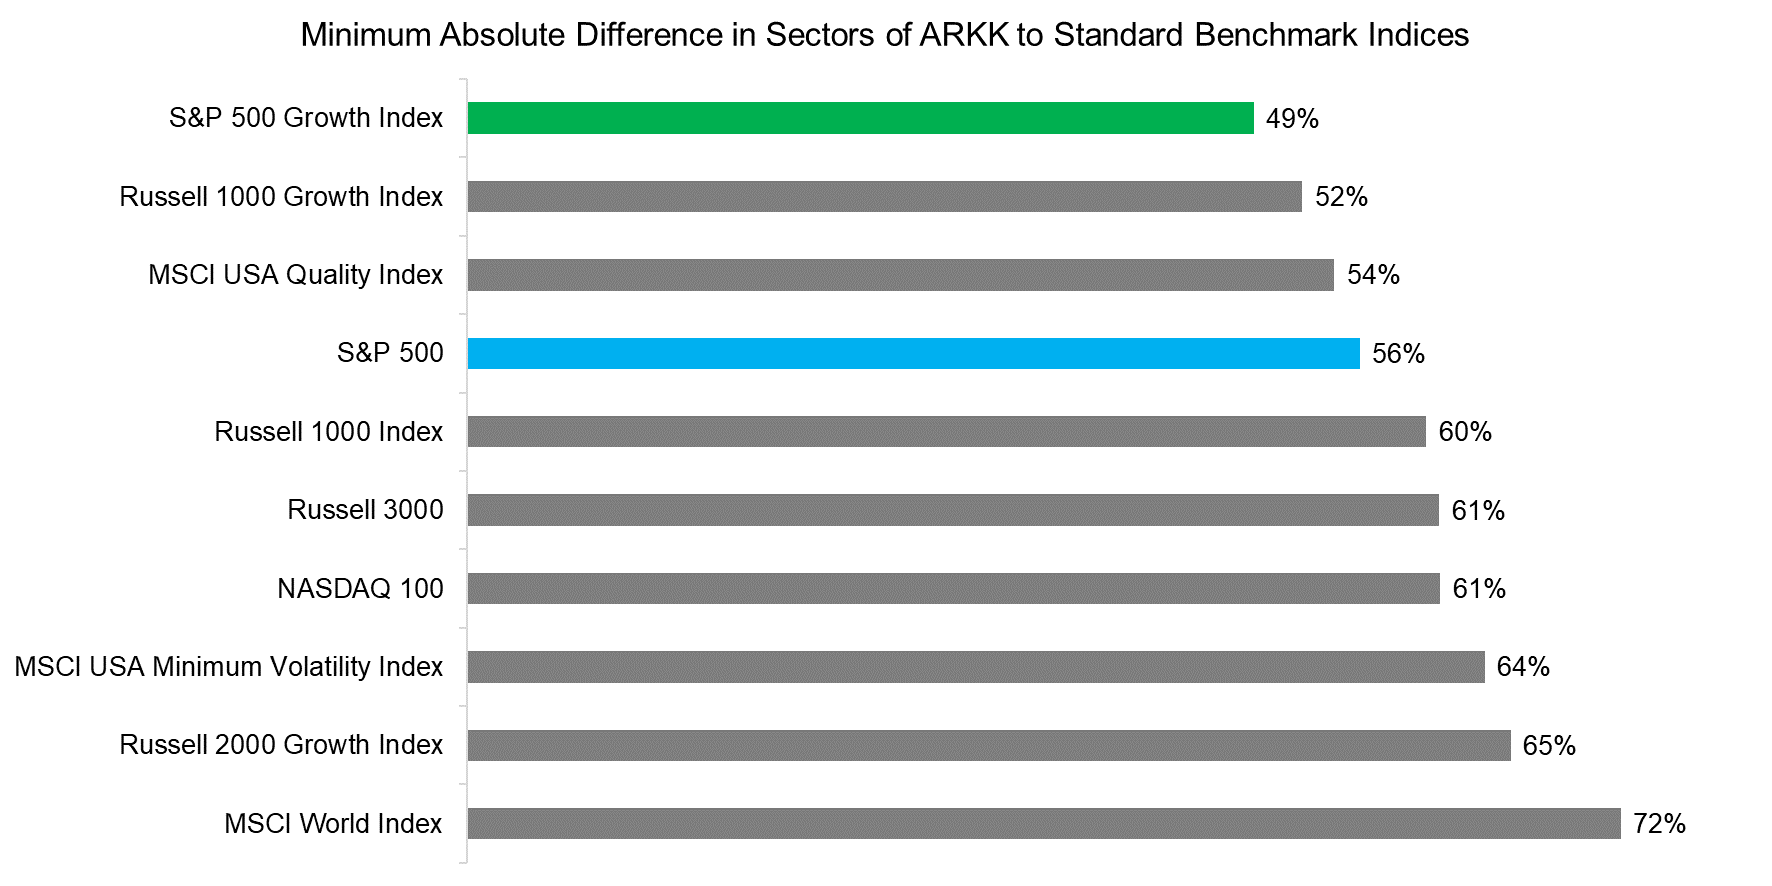
Next, we calculate the sum of absolute sector differences of ARKK and 40 well-known indices, which highlights that the S&P 500 Growth index has the most comparable portfolio from a sector perspective given the smallest absolute difference. The S&P 500, which is the asset manager’s designated benchmark, ranks fourth on this list.
Source: FactorResearch
FACTOR EXPOSURE ANALYSIS
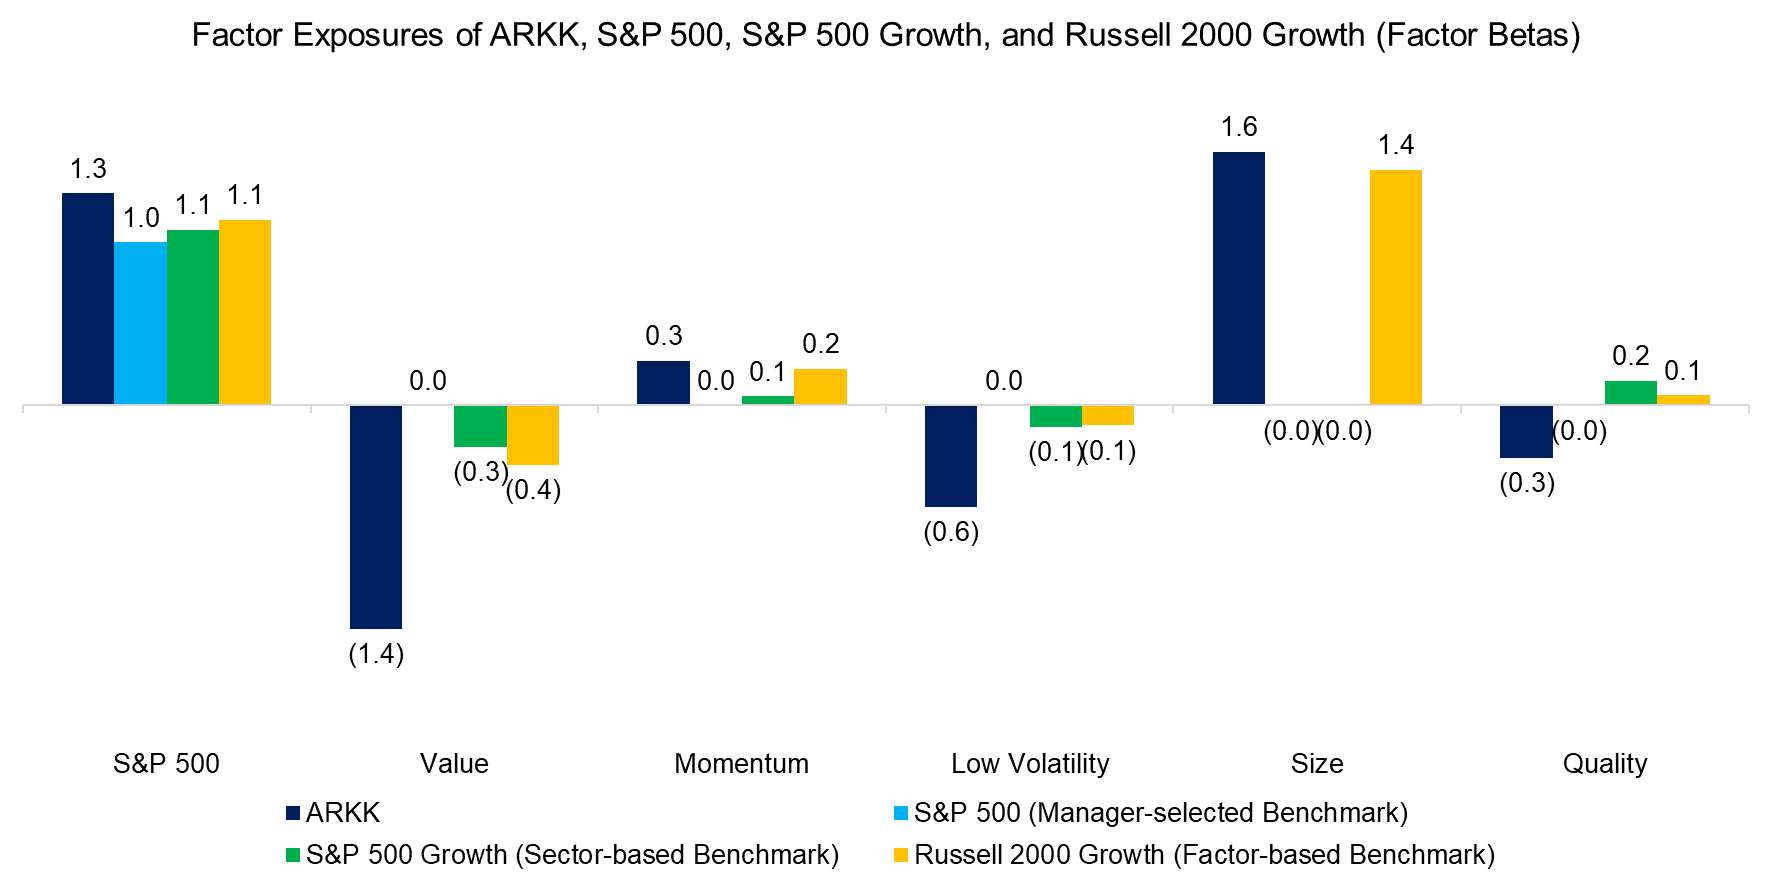
Next, we run a factor exposure analysis on the three benchmark indices, which shows that the Russell 2000 Growth index has the most similar factor exposure to ARKK. The S&P 500 Growth index has negative exposure to the value and low volatility factors like ARKK, but it lacks the positive exposure to the Size factor. The S&P 500 consists of large caps, compared to small and mid-caps for the Russell 2000 and ARKK.
Source: FactorResearch
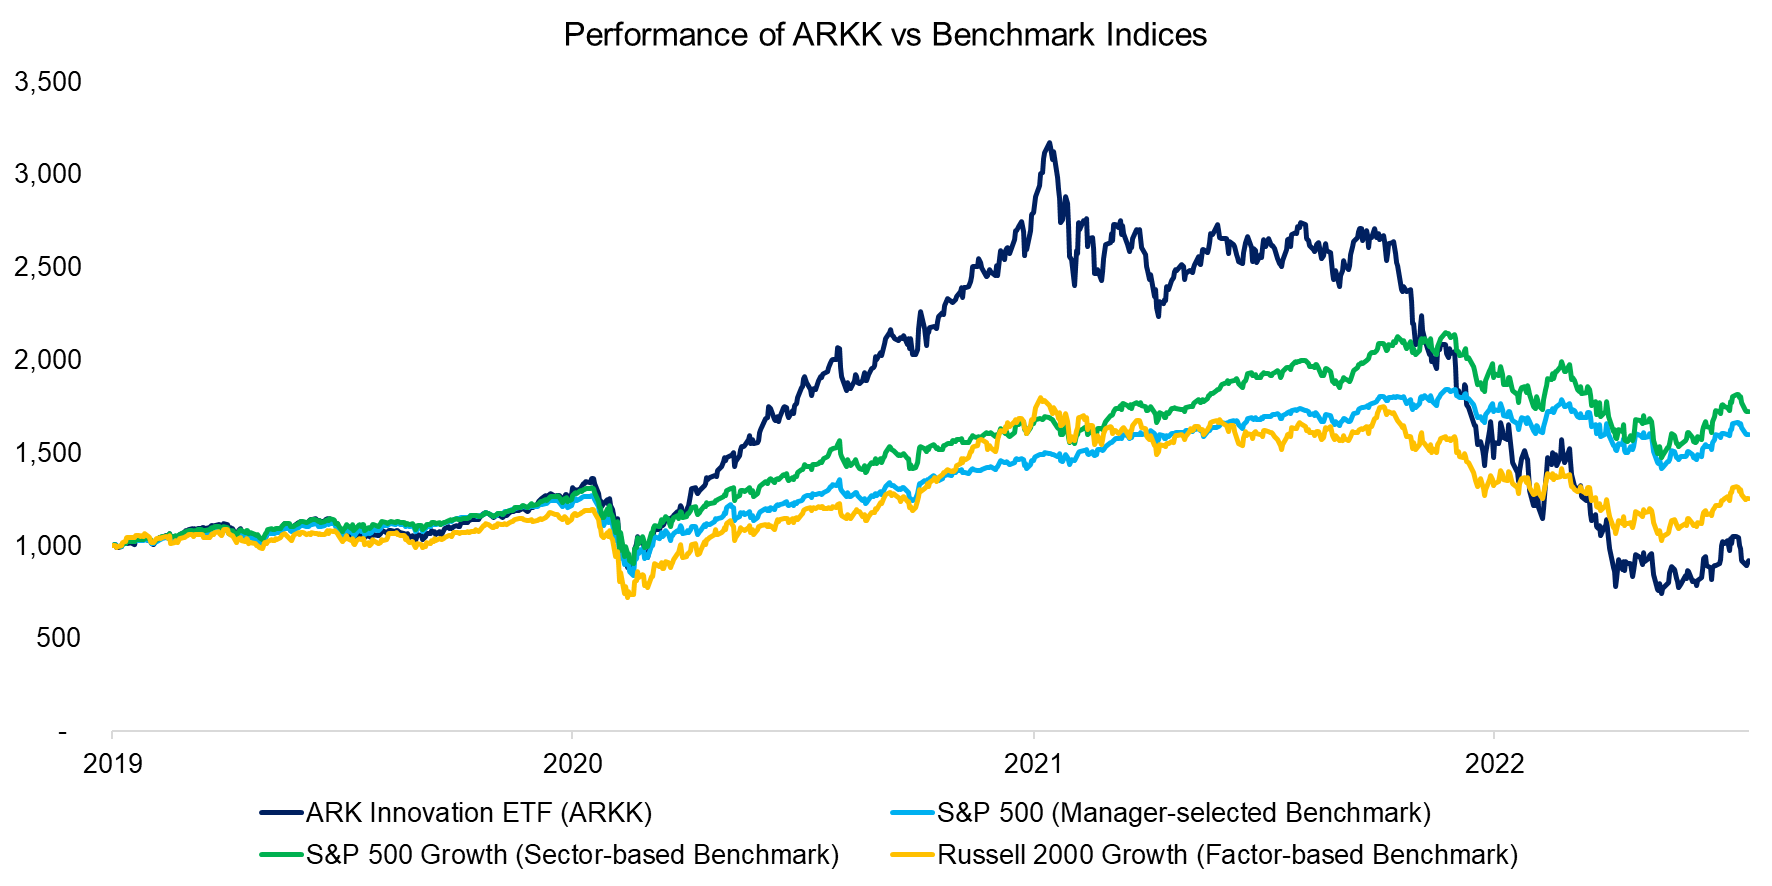
We contrast the performance of ARKK and the three benchmarks over the last three years, which highlights a significant outperformance followed by a severe underperformance of the ETF.
It does appear that the trends in performance were more similar between ARKK and the Russell 2000 Growth than to S&P 500 indices. The ETF’s correlations were 0.73 to the S&P 500, 0.80 to the S&P 500 Growth, and 0.81 to the Russell 2000 Growth in the period from 2009 and 2022.
Source: FactorResearch
OUTPERFORMANCE VERSUS BENCHMARKS
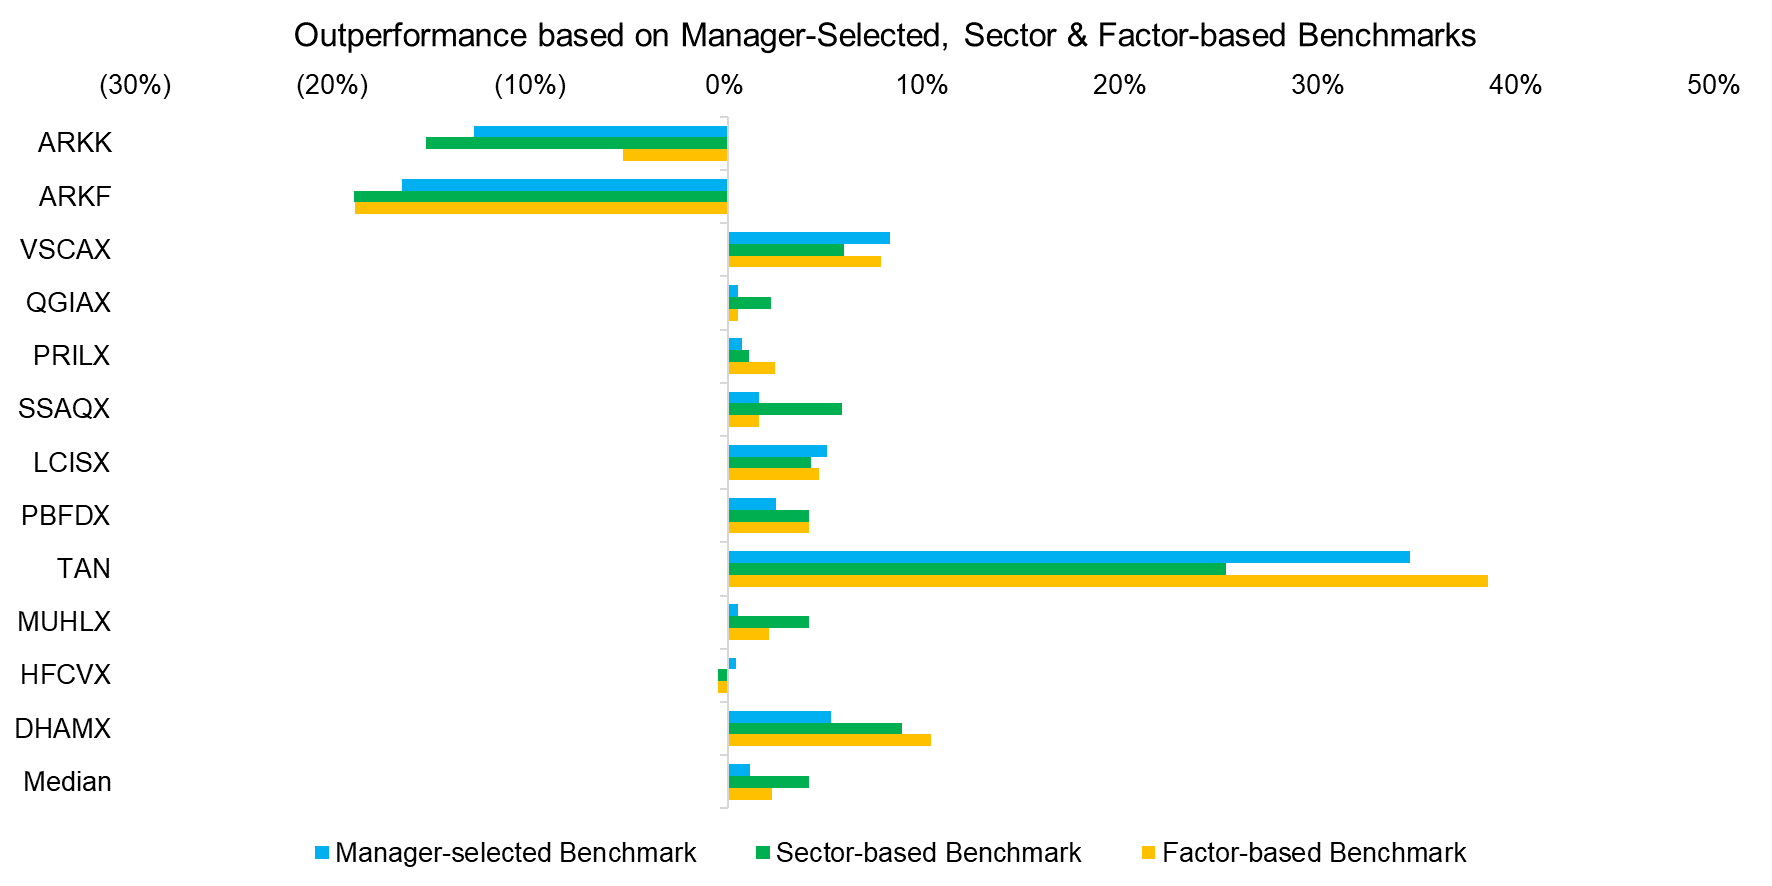
Finally, we randomly select 12 actively-managed U.S. mutual funds and ETFs where we contrast the outperformance to a benchmark index chosen by the asset manager versus the sector- and factor-based selections.
In almost all of the 12 funds the direction of the outperformance was the same, i.e. broadly speaking the manager-selected benchmarks were not inappropriate. However, the magnitude of outperformance differed significantly, which highlights that benchmark selection matters (read Alpha Generation: The Search for the Unexplainable).
Source: FactorResearch
FURTHER THOUGHTS
Considering both approaches, should investors select benchmarks based on sectors or factors?
In the case of sector-focused mutual funds, the most appropriate index is a sector benchmark index. However, it is important to understand the factor exposure. For example, a fund manager that focuses on consumer staples but prefers small caps will be impacted by the performance of the size factor, which at times may be a larger driver of performance than the idiosyncratic dynamics of the consumer staples sector (read Factor Exposure Analysis 100: Holdings vs Regression-Based).
However, for most other mutual funds or portfolios a factor-based benchmark selection generates a more accurate result, which is supported by the entire performance attribution industry focusing on factors rather than sectors. The former are less correlated and therefore better independent variables than the latter.
Know your factors.
RELATED RESEARCH
Mirror, Mirror, on the Wall, which is the Fairest Benchmark of All?
Outperformance Ain’t Alpha
Less Efficient Markets = Higher Alpha?
Smart Beta vs Alpha + Beta
Alpha Generation: The Search for the Unexplainable
Factor Exposure Analysis 101: Linear vs Lasso Regression
Factor Exposure Analysis 103: Exploring Residualization
Time Machines for Investors
Factor Exposure Analysis 102: More or Less Independent Variables?
ABOUT THE AUTHOR
Nicolas Rabener is the CEO & Founder of Finominal, which empowers professional investors with data, technology, and research insights to improve their investment outcomes. Previously he created Jackdaw Capital, an award-winning quantitative hedge fund. Before that Nicolas worked at GIC and Citigroup in London and New York. Nicolas holds a Master of Finance from HHL Leipzig Graduate School of Management, is a CAIA charter holder, and enjoys endurance sports (Ironman & 100km Ultramarathon).
Connect with me on LinkedIn or X.

