Evaluating Inflation Hedges
More diverse than expected
July 2022. Reading Time: 10 Minutes. Author: Nicolas Rabener.
SUMMARY
- Despite being different metrics, CPI and breakeven inflation rates exhibited the same trends since 2003
- The securities with high betas to inflation come from diverse sectors, not just from energy and commodities
- Portfolios often feature hidden inflation exposure that should be revealed via factor exposure analysis
INTRODUCTION
The Bundesbank estimated that Germans hoarded about EUR 200 billion of cash at home and deposit boxes at banks as of 2020. Aside from the risk of losing money at home through theft, water damages, or fire, cash loses its value daily in real terms through inflation.
In 2020, inflation was less than 1% in Germany, but that increased to close to 10% in 2022 due to the global supply chain issues and the war in Ukraine. Stated differently, at the current inflation rate, more money is lost in Germany in real terms by hoarding cash than invested in German startups by venture capital funds, which was EUR 19.7 billion in 2021 according to Dealroom. It is terrible for savers and the economy.
Most investors are aware of the damage inflation does to their portfolios, but protecting a portfolio against inflation is not simple. In this research note, we will explore the securities with the highest inflation-hedging properties (read Building an Inflation Portfolio Using Asset Classes).
INFLATION METRICS
One of the challenges of inflation is that it is measured differently across and within countries. The official statistics are backward-looking, but there are also forward-looking ones derived from surveys or markets, as well as shadow statistics from market participants that do not trust the official data. Unfortunately, this data abundance makes it difficult to form a clear picture of the current inflation rate.
In this article, we focus on two measures namely the United States Consumer Price Index for All Urban Consumers (“CPI”) and the United States 10-Year Breakeven Inflation Rate (“BEIR”). CPI is available as a monthly time series, is seasonally adjusted, and represents the price change of a broad basket of goods and services, including shelter and energy. It is the most-watched inflation number, but also complicated as the basket changes regularly and some components like food and energy are volatile, leading to significant movements in the data.
BEIR is even more difficult to understand as it is derived by subtracting the yield of the U.S. Treasury Inflation-Protected Securities (TIPS) from the yield of the 10-Year U.S. Treasury bond. Theoretically, this represents the market’s expectation for inflation over the next 10 years. Higher or increasing spreads indicate rising inflation expectations, while negative or decreasing spreads imply falling inflation expectations.
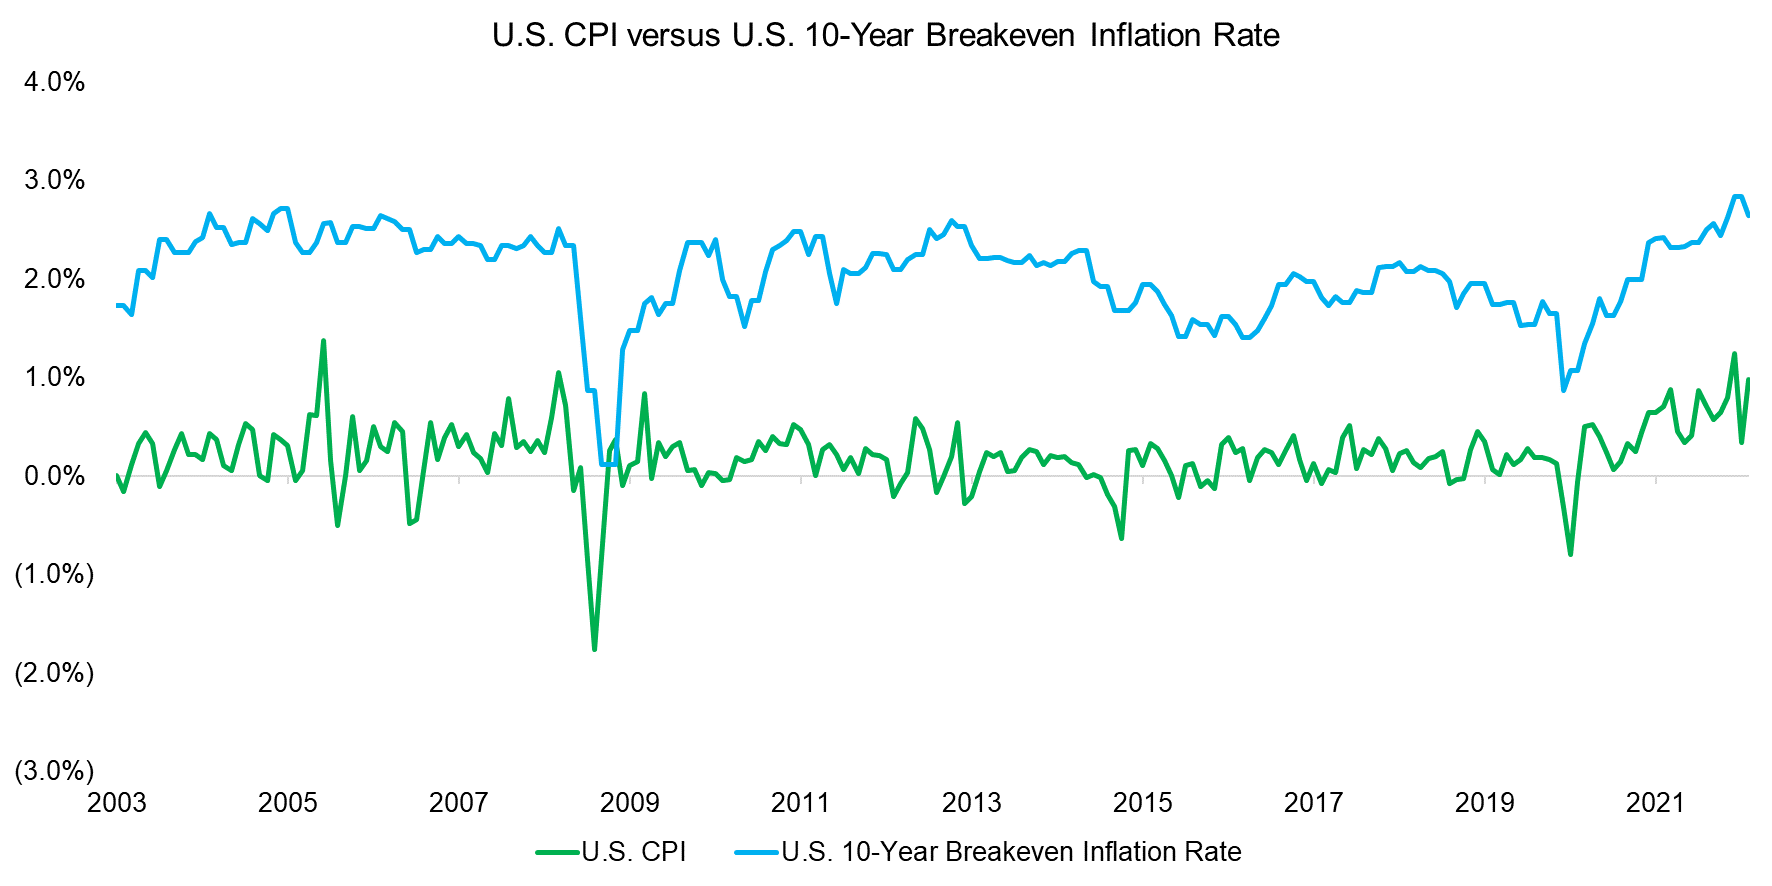
Contrasting the two time series in one chart shows that the trends have been almost identical in the period between 2003 and 2022, despite CPI being backward and BEIR forward-looking. The magnitude is different as CPI is reported monthly and BEIR is calculated daily.

Source: FactorResearch
IDENTIFYING INFLATION-HEDGING SECURITIES
There are no securities that provide direct exposure to inflation, but some commodities like oil and gold or TIPS are considered proxies (read Inflation-Themed ETFs: As Complicated as Inflation) .
We measure the sensitivity of all stocks, ETFs, and mutual funds trading in the U.S. markets to CPI and BEIR by calculating the betas using a three-year lookback. CPI is less volatile than BEIR given monthly data and adjustments for seasonality, which results in betas being significantly higher than when using BEIR.
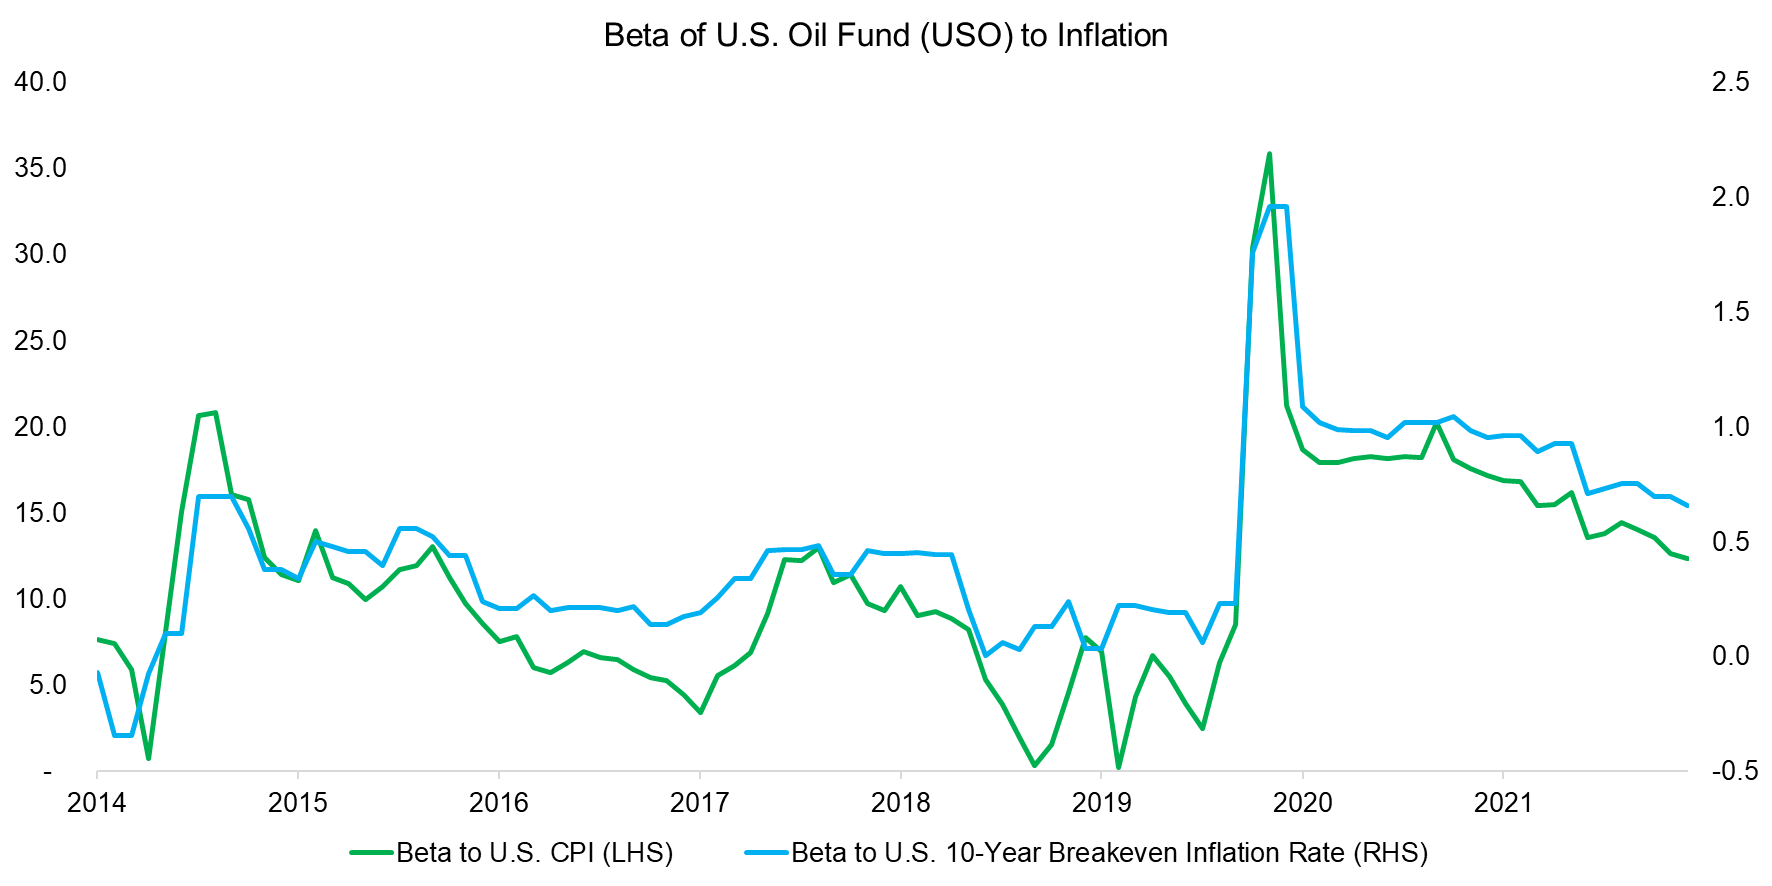
We can demonstrate this by showing the rolling betas of the U.S. Oil Fund (USO), an ETP that provides exposure to WTI crude oil via futures. The betas of USO to CPI ranged from 5 to 35, compared to -0.5 to 2.0 for BEIR. However, the trends in beta were identical, which indicates that we can use either inflation metric.

Source: FactorResearch
STOCKS VS ETFS VS MUTUAL FUNDS
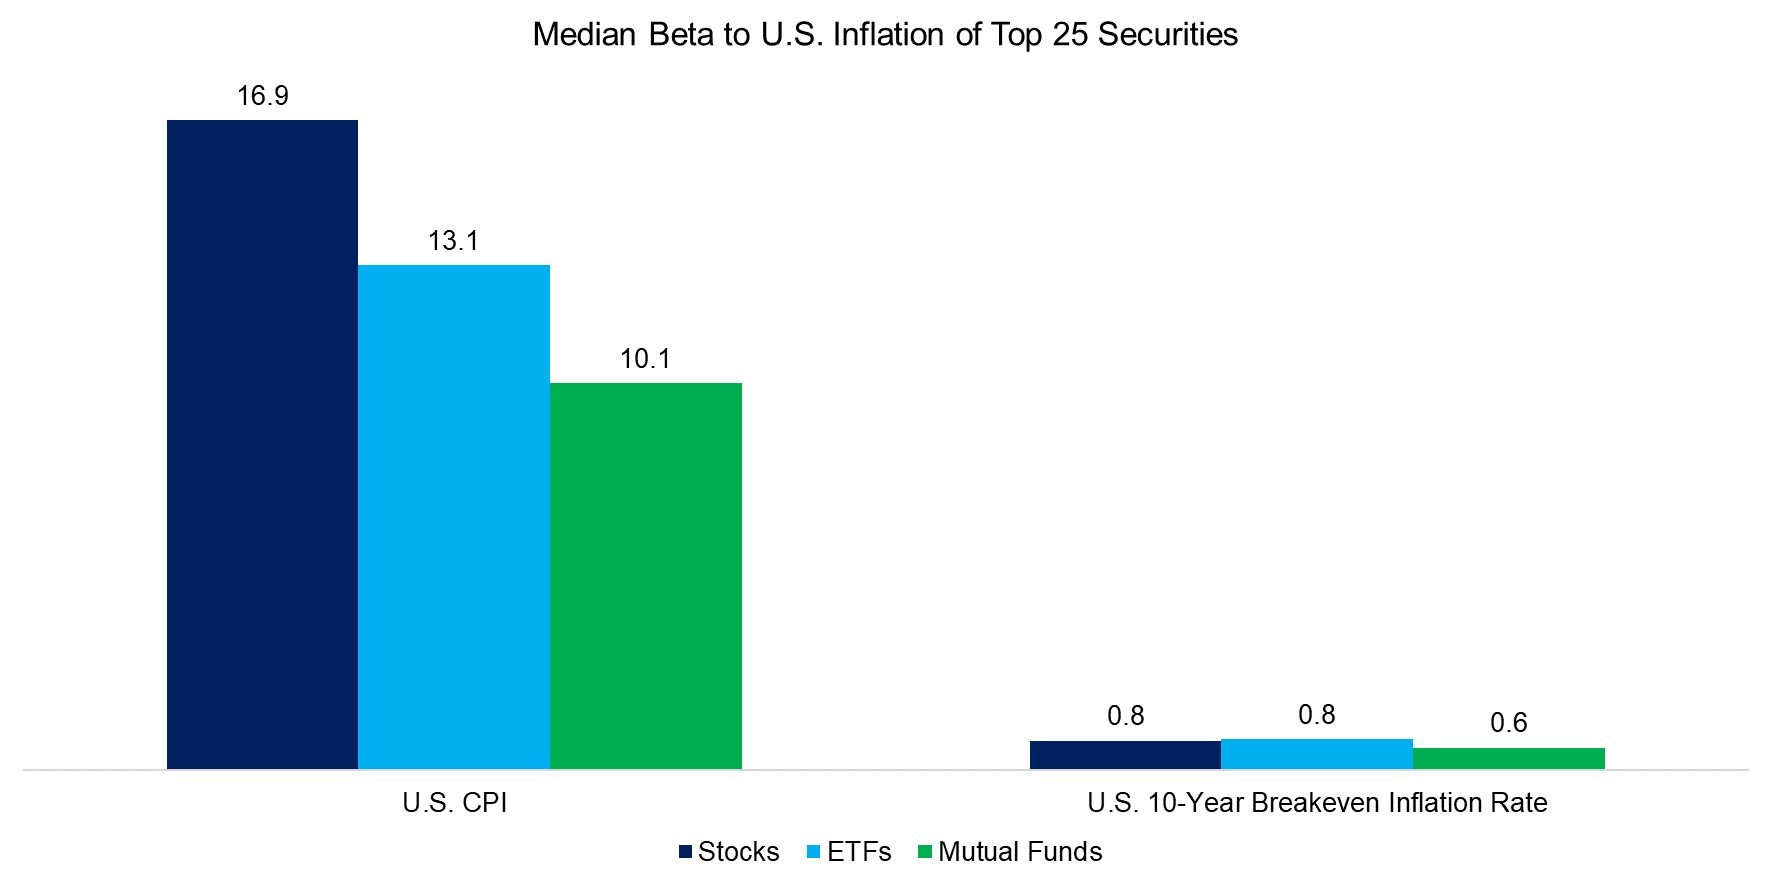
It is interesting to consider if single stocks or portfolios offered via ETFs or mutual funds provide better inflation-hedging properties. We calculate the median beta of the top 25 securities for each of these categories, which highlights that single stocks offer slightly higher betas on average.
The difference in betas when using CPI or BEIR is large, but this is due to the nature of the times series as previously discussed and should be disregarded.

Source: FactorResearch
TOP 10 STOCKS WITH BETA TO INFLATION
We show the top ten stocks trading in the U.S. stock market with the highest betas to inflation, which highlights an overlap as companies like Transocean, Whiting Petroleum, and Patterson-UTI Energy have high sensitivity to CPI as well as BEIR.
Furthermore, almost all stocks are derived from the energy sector, which is intuitive as rising oil prices have been the major contributor to the currently high inflation. It is interesting to note that most of these stocks are small to mid-caps and none of the top 20 stocks features a market capitalization above $40 billion.

Source: FactorResearch
TOP 10 MUTUAL FUNDS WITH BETA TO INFLATION
Next, we highlight the top 10 mutual funds with the highest sensitivity to inflation. Using CPI results exclusively in mutual funds that provide exposure to the energy sector and commodities. In contrast, applying BEIR returns a more diverse set of funds that also includes exposure to small and mid-caps, banks, and Latin America with leverage (2x).

Source: FactorResearch
TOP 10 ETFS WITH BETA TO INFLATION
Finally, we highlight the top 10 ETFs with the highest betas to inflation, which shows diverse exposures. This includes oil, gas, shipping, regional banks, small-cap ETFs, and so. Most of these, like gold miners or oil ETFs, are intuitive when considering inflation-hedgers, however, others like biotech may be surprising.
The analysis also highlights that entire regions like Latin America or countries like Brazil are impacted by inflation and can be considered inflation proxies, likely as their stock markets are dominated by commodity and energy companies. The risk is not knowing such exposures and doubling up on the same risk, eg by having exposure to gold miners and Brazil.

Source: FactorResearch
FURTHER THOUGHTS
Although investors should analyze the exposure of their portfolios to inflation, actively positioning them for high inflation is not necessarily a sound strategy. Barely two years ago most developed markets experienced deflation and the current environment can change quickly again. The track record of global macro hedge fund managers or economists, both of which specialize in forecasting variables like inflation, is poor.
A better strategy is to allocate to managed futures strategies that benefit from either kind of environment. If inflation is rising or high, then these will likely pick up long exposure to commodities. If inflation is falling, then it might be long bonds and short commodities. Let the trend be your friend.
RELATED RESEARCH
Building an Inflation Portfolio Using Stocks
Myth-Busting: Equities are an Inflation-Hedge
Myth-Busting: Money Printing Must Create Inflation
Equity Factors & Inflation
ABOUT THE AUTHOR
Nicolas Rabener is the CEO & Founder of Finominal, which empowers professional investors with data, technology, and research insights to improve their investment outcomes. Previously he created Jackdaw Capital, an award-winning quantitative hedge fund. Before that Nicolas worked at GIC and Citigroup in London and New York. Nicolas holds a Master of Finance from HHL Leipzig Graduate School of Management, is a CAIA charter holder, and enjoys endurance sports (Ironman & 100km Ultramarathon).
Connect with me on LinkedIn or X.

