Sensitivity Analysis 101
How sensitive is sensitivity analysis?
October 2025. Reading Time: 10 Minutes. Author: Nicolas Rabener.
- Sensitivity analysis can highlight portfolio risks
- However, it is sensitive to data availability and assumptions
- Focusing on tail betas is sensible
INTRODUCTION
The U.S. stock market is currently being driven by a small group of stocks, creating a concentration risk not seen in decades. While comparisons to the 2000 tech bubble are common, a key difference is that today’s leading companies, such as Microsoft and Apple, are highly profitable businesses.
Still, the Shiller CAPE ratio recently surpassed 40 – a level last reached in 2000 – indicating that valuations are very expensive. A common way to assess portfolio risk is through sensitivity analysis, asking questions like: how much would my portfolio fall if the Nasdaq dropped by 50%?
Sensitivity analysis is typically conducted using regression techniques, which we will explore in this research article.
SINGLE VS MULTIPLE REGRESSION ANALYSIS
We will analyze a value-focused U.S. stock portfolio, represented by the iShares Russell 1000 Value ETF (IWD), and assess the impact of a 30% decline in emerging market stocks, proxied by the MSCI Emerging Markets Index. A conventional approach would be to calculate IWD’s beta relative to the EM Index, but this has two limitations: U.S. value stock returns are poorly explained by emerging market returns, and global stock markets are highly correlated. Therefore, a more realistic scenario is to consider a 30% drop in EM stocks alongside a 10% decline in the S&P 500.
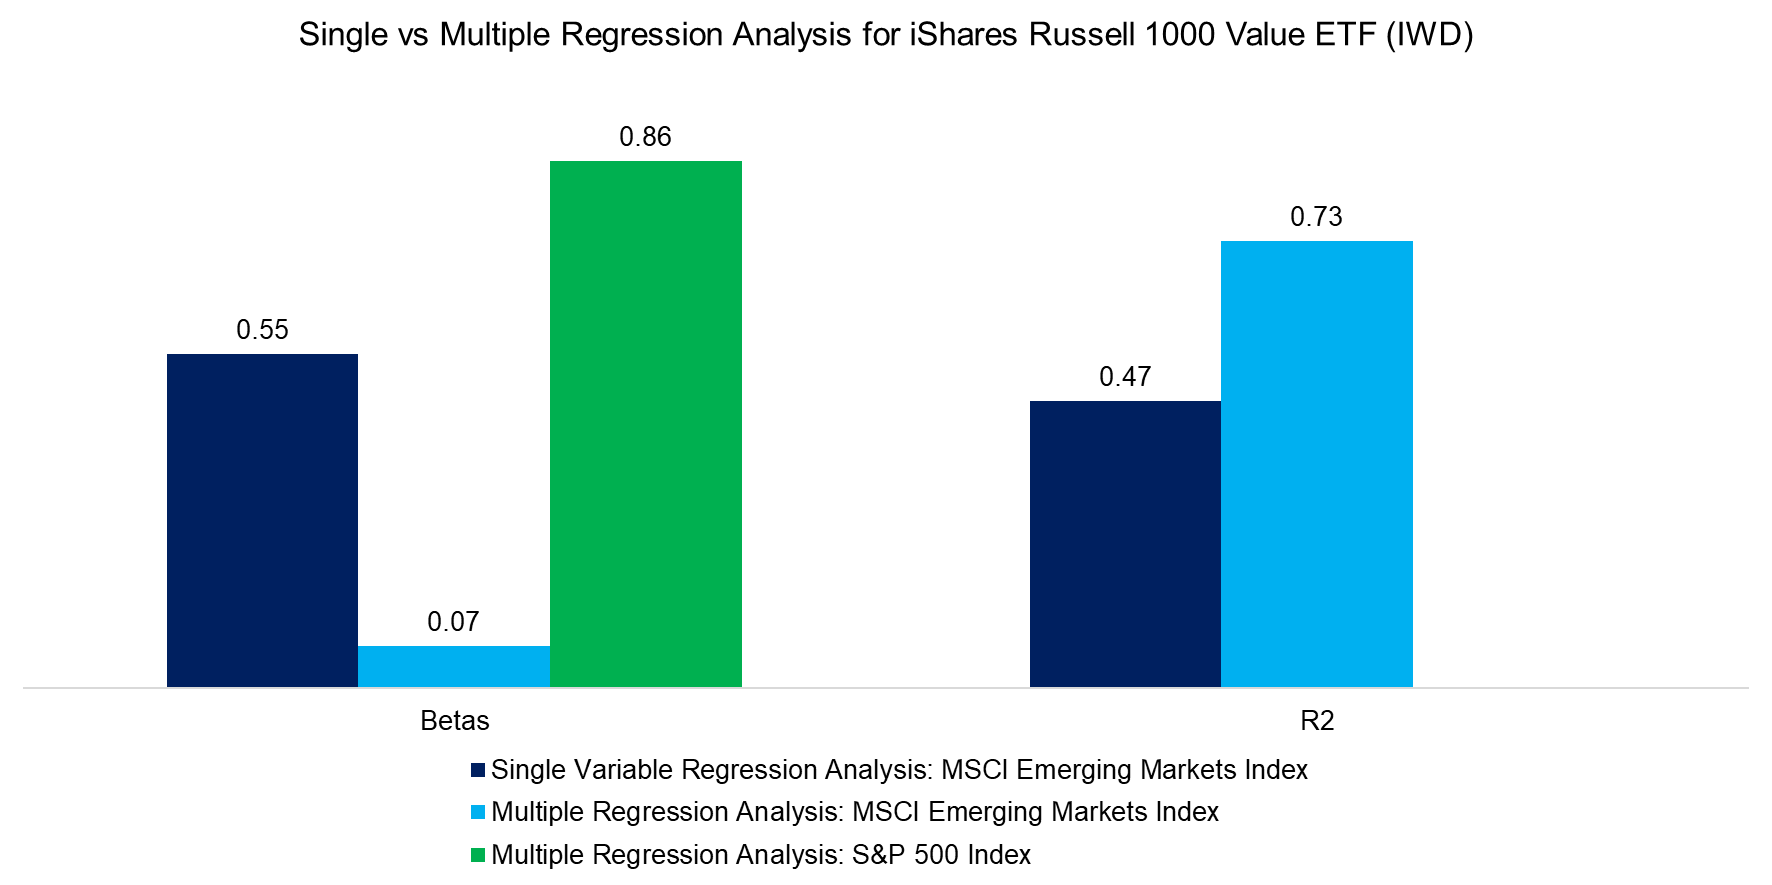
A single-variable regression of IWD on EM stocks produces a beta of 0.55, but the R2 is only 0.47, indicating limited explanatory power. When we expand to a multiple regression including the S&P 500, the beta relative to EM stocks falls to 0.07, while the R² rises to 0.73, reflecting a stronger overall fit.
Source: Finominal
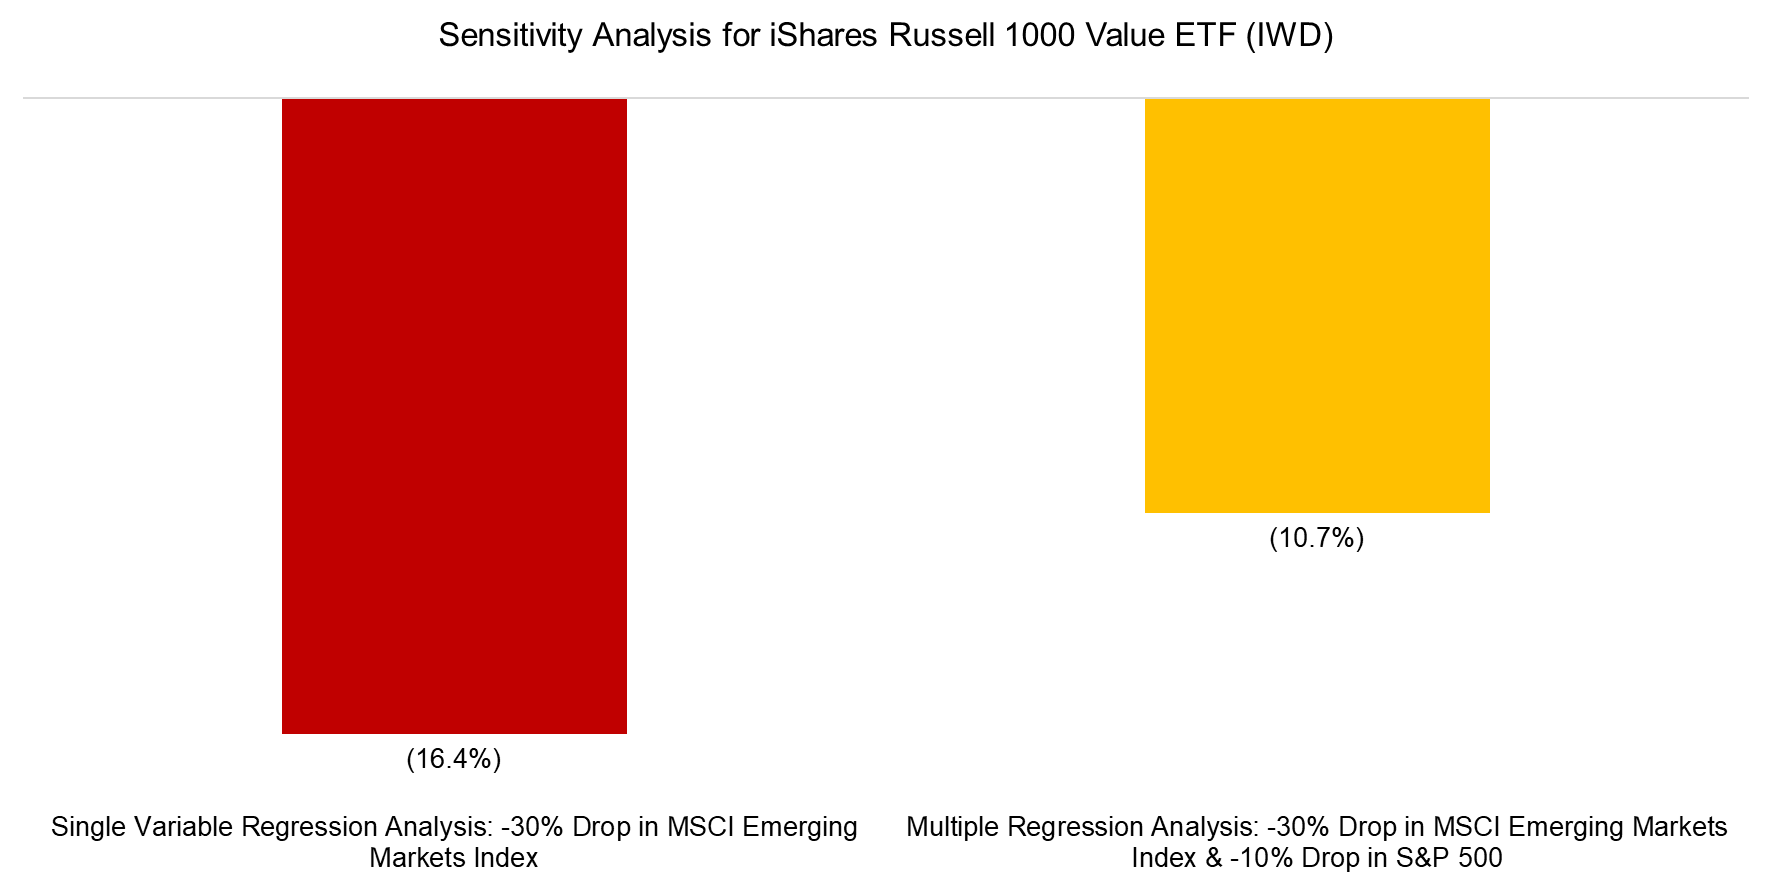
A 30% decline in emerging market stocks would reduce U.S. value stocks by 16.4% according to a single-variable regression. However, when accounting for a simultaneous 10% drop in the S&P 500, the expected decline in U.S. value stocks falls to 10.7%. Given the substantially higher R2 in the multiple regression, this latter estimate provides a more realistic assessment.
Source: Finominal
THE SENSITIVITY OF SENSITIVITY ANALYSIS
Ideally, every portfolio would have a track record of 20 years or more, providing sufficient data for meaningful statistical analysis. In reality, however, the average mutual fund lasts only three years, and most ETFs have even shorter lifespans. As a result, many portfolios have limited historical data, which is suboptimal for rigorous analysis.
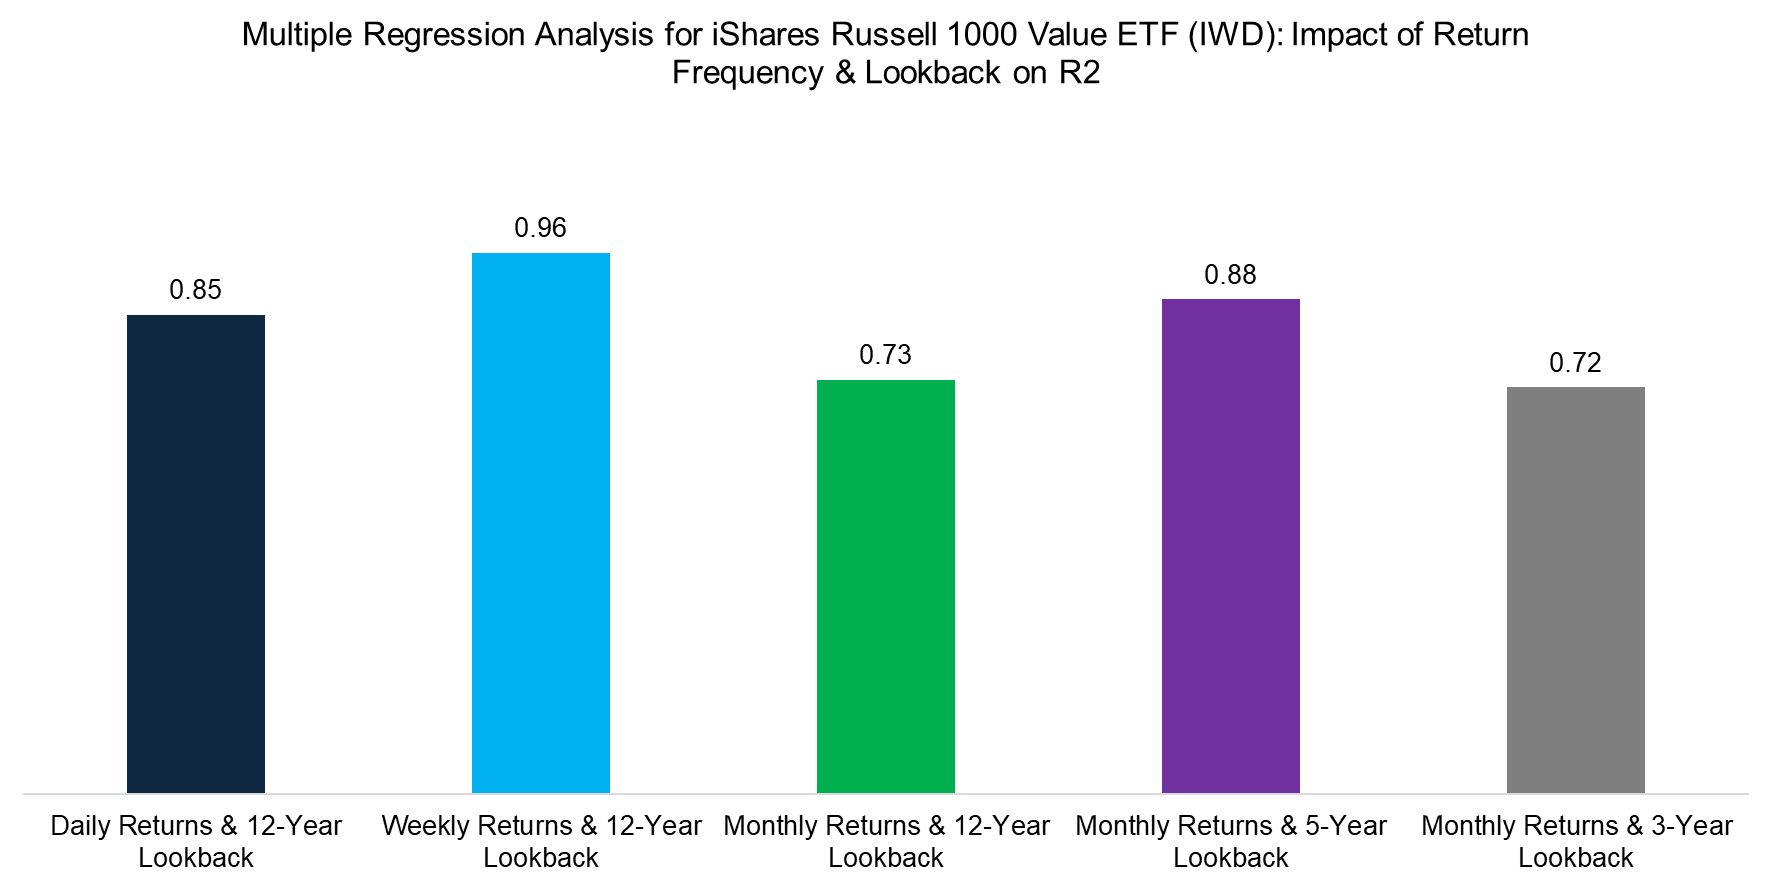
We can examine the variability of R2 in regression analysis by adjusting both the data frequency – daily, weekly, or monthly – and the lookback period. In our tests, R² ranged from 0.72 to 0.96. However, the relationship between these inputs is not always linear; for instance, in this example, monthly returns produced the same R² for both three- and twelve-year lookbacks.
Source: Finominal
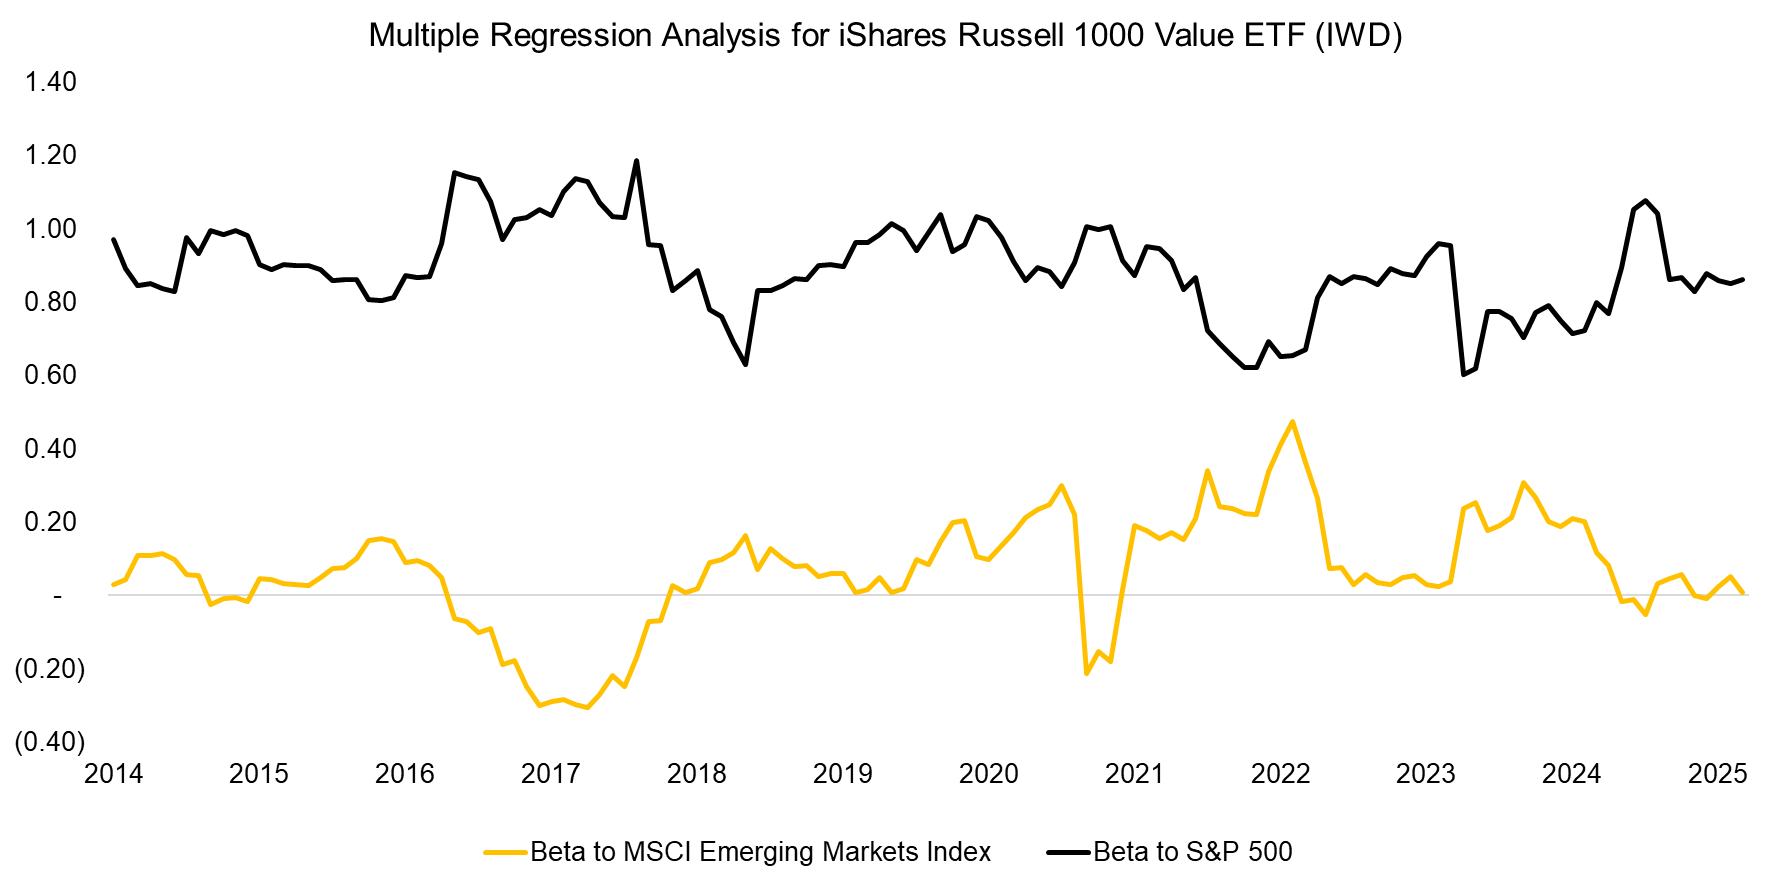
Another complication is that betas are far from stable. For example, over the past 11 years, IWD’s beta relative to the S&P 500 has fluctuated between 0.6 and 1.2, while its beta relative to emerging market stocks has ranged from -0.3 to 0.5. This variability highlights that sensitivity analysis is also dependent on the data frequency, lookback period, and measurement date.
Source: Finominal
TAIL BETA SENSITIVITY
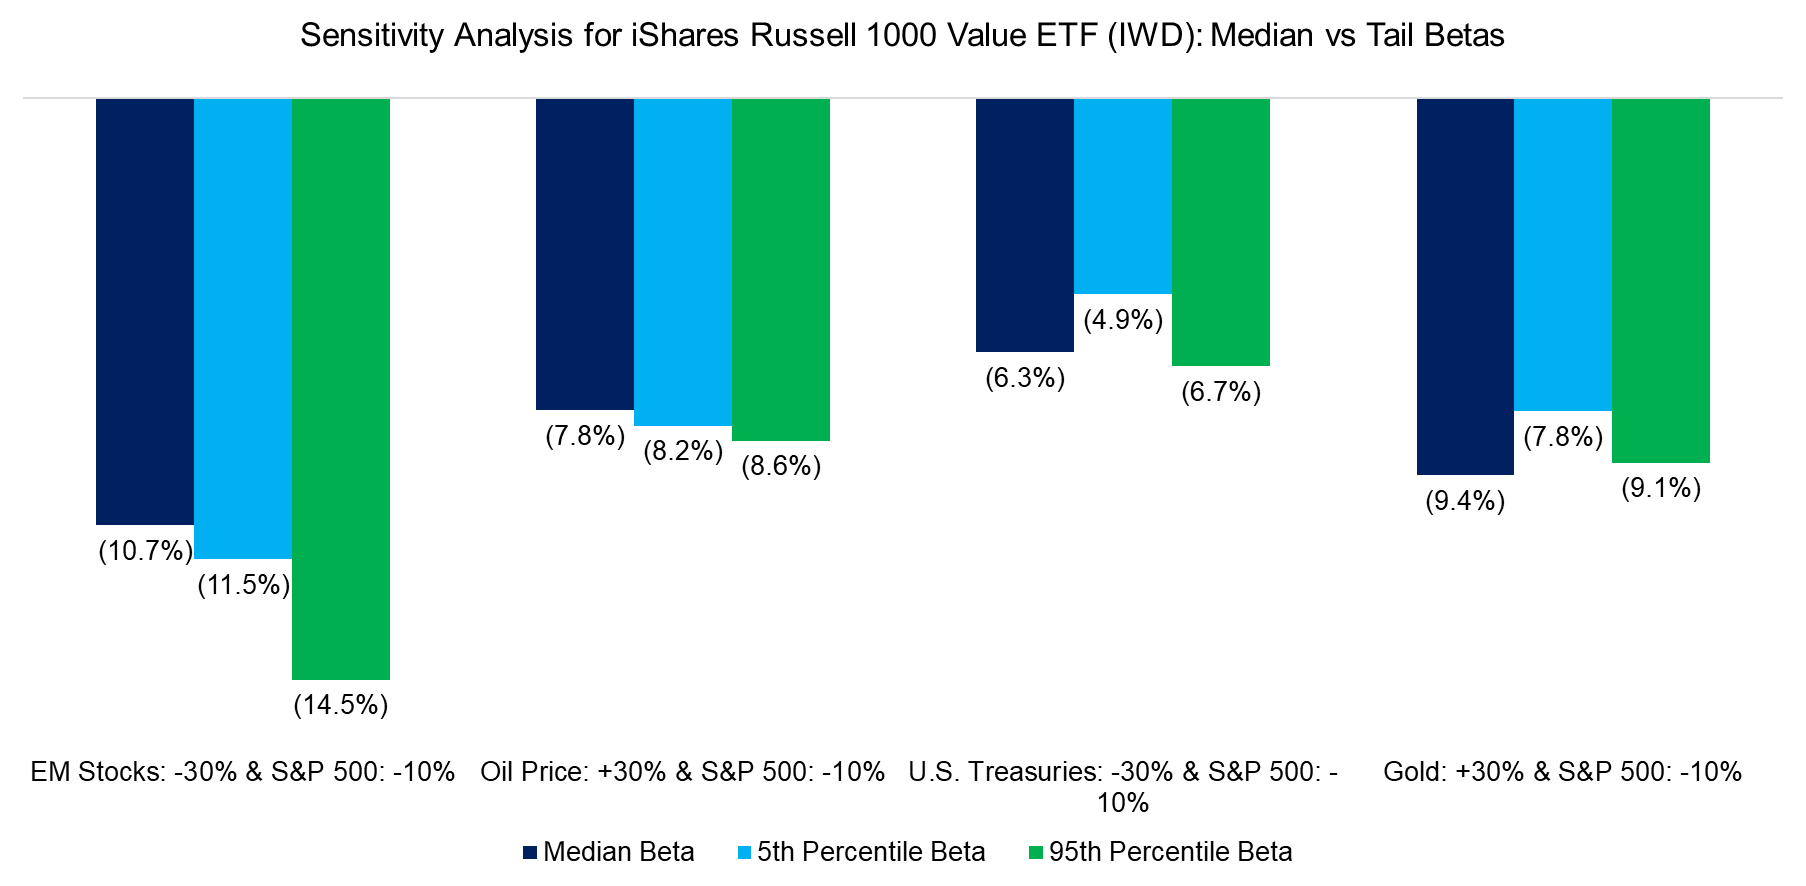
Given the time-varying nature of betas and the goal of sensitivity analysis to capture downside risk, it can be more informative to focus on tail betas rather than median values. To this end, we calculate rolling 12-month betas of IWD against emerging market stocks, oil prices, long-term U.S. Treasuries, and gold. We then compute the 1-month returns of these variables and identify the betas during extreme periods, defined as the 5th and 95th percentiles. As expected, these variables impact U.S. value stocks differently, and there are notable differences in the sensitivities when using median and tail betas.
FURTHER THOUGHTS
Regression-based sensitivity analysis is just one method for assessing portfolio risk beyond traditional metrics such as maximum drawdowns and Value at Risk (VaR). Investors can also examine performance under historical scenarios, run Monte Carlo simulations using historical returns or capital market assumptions, and employ advanced techniques like copulas to model non-linear dependencies. However, as this analysis demonstrates, all of these approaches are highly sensitive to the limitations of available data and the assumptions underpinning them.
RELATED RESEARCH
Downside Betas vs Downside Correlations
Hedging Bear Markets & Crashes with Tail Risk ETFs
Tail Risk Hedge Funds
Hedging Market Crashes with Factor Exposure
Equal vs Market Cap-Weighted Portfolios in Stock Market Crashes
Risk-Managed Equity Exposure III
Factor Exposure Analysis 109: Linear vs Lasso vs Elastic Net
Factor Exposure Analysis 102: More or Less Independent Variables?
Factor Exposure Analysis 101: Linear vs Lasso Regression
ABOUT THE AUTHOR
Nicolas Rabener is the CEO & Founder of Finominal, which empowers professional investors with data, technology, and research insights to improve their investment outcomes. Previously he created Jackdaw Capital, an award-winning quantitative hedge fund. Before that Nicolas worked at GIC and Citigroup in London and New York. Nicolas holds a Master of Finance from HHL Leipzig Graduate School of Management, is a CAIA charter holder, and enjoys endurance sports (Ironman & 100km Ultramarathon).
Connect with me on LinkedIn or X.

