Sequential Model: Sorting by 5 Factors
Pick a Factor, then Tilt, Tilt, Tilt.
February 2018. Reading Time: 10 Minutes. Author: Nicolas Rabener.
SUMMARY
- The sequential model ranks stocks by factors sequentially
- Allows investors to prioritise factors and results in concentrated portfolios
- However, the factor sequence matters and only a few factors can be considered
INTRODUCTION
In a recent research report we showed how investors can combine factors into a multi-factor portfolio by ranking for several factors simultaneously (please see Intersectional Model: Sorting by 7 Factors), which results in a portfolio of stocks that rank well on average on the chosen factors. However, some investors have a core philosophy, e.g. are Value investors, and require that all stocks rank highly on this factor. In this case investors can utilise the sequential model, which ranks factors sequentially and allows investors to prioritise specific factors. In this short research note we will analyse the effect of adding an additional four factors sequentially to a Value portfolio in the US.
METHODOLOGY
In this research report we will use the sequential model by sorting stocks for several factors sequentially. We focus on five factors namely Value, Size, Momentum, Low Volatility and Quality and sort in this sequence, which is an arbitrary decision. The factors are created by constructing long-short beta-neutral portfolios of the top and bottom 30% of stocks of the US stock market. Portfolios rebalance monthly and include 10bps of transaction costs.
SEQUENTIAL MODEL
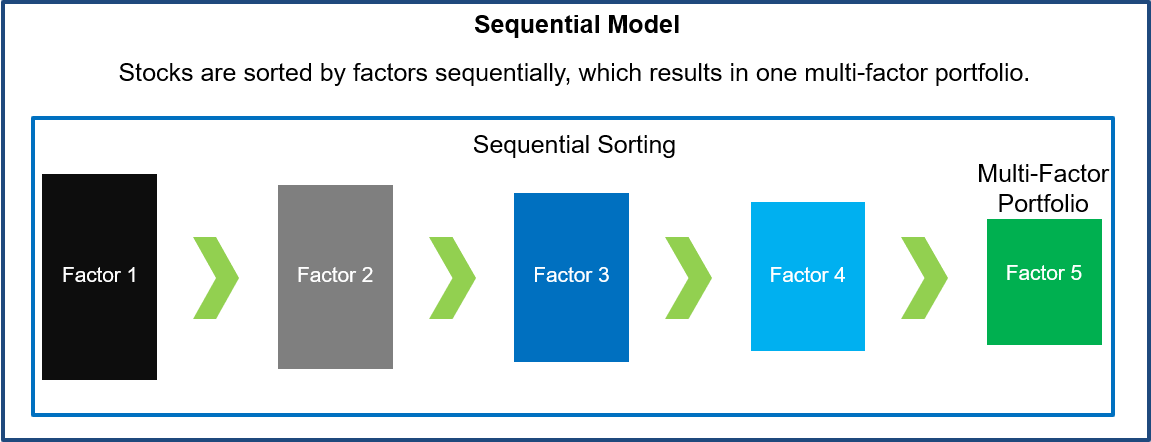
The sequential model ranks stocks by factors sequentially, which means the factor sequence has a significant role on the performance. Investors can prioritise factors as the initial factors have a much larger impact than the later ones. For example, if the first factor is Value, then the stocks in the long portfolio will definitely be cheap stocks, regardless of which factor is used for ranking the stocks thereafter. The graphic below illustrates the sequential model.
Source: FactorResearch
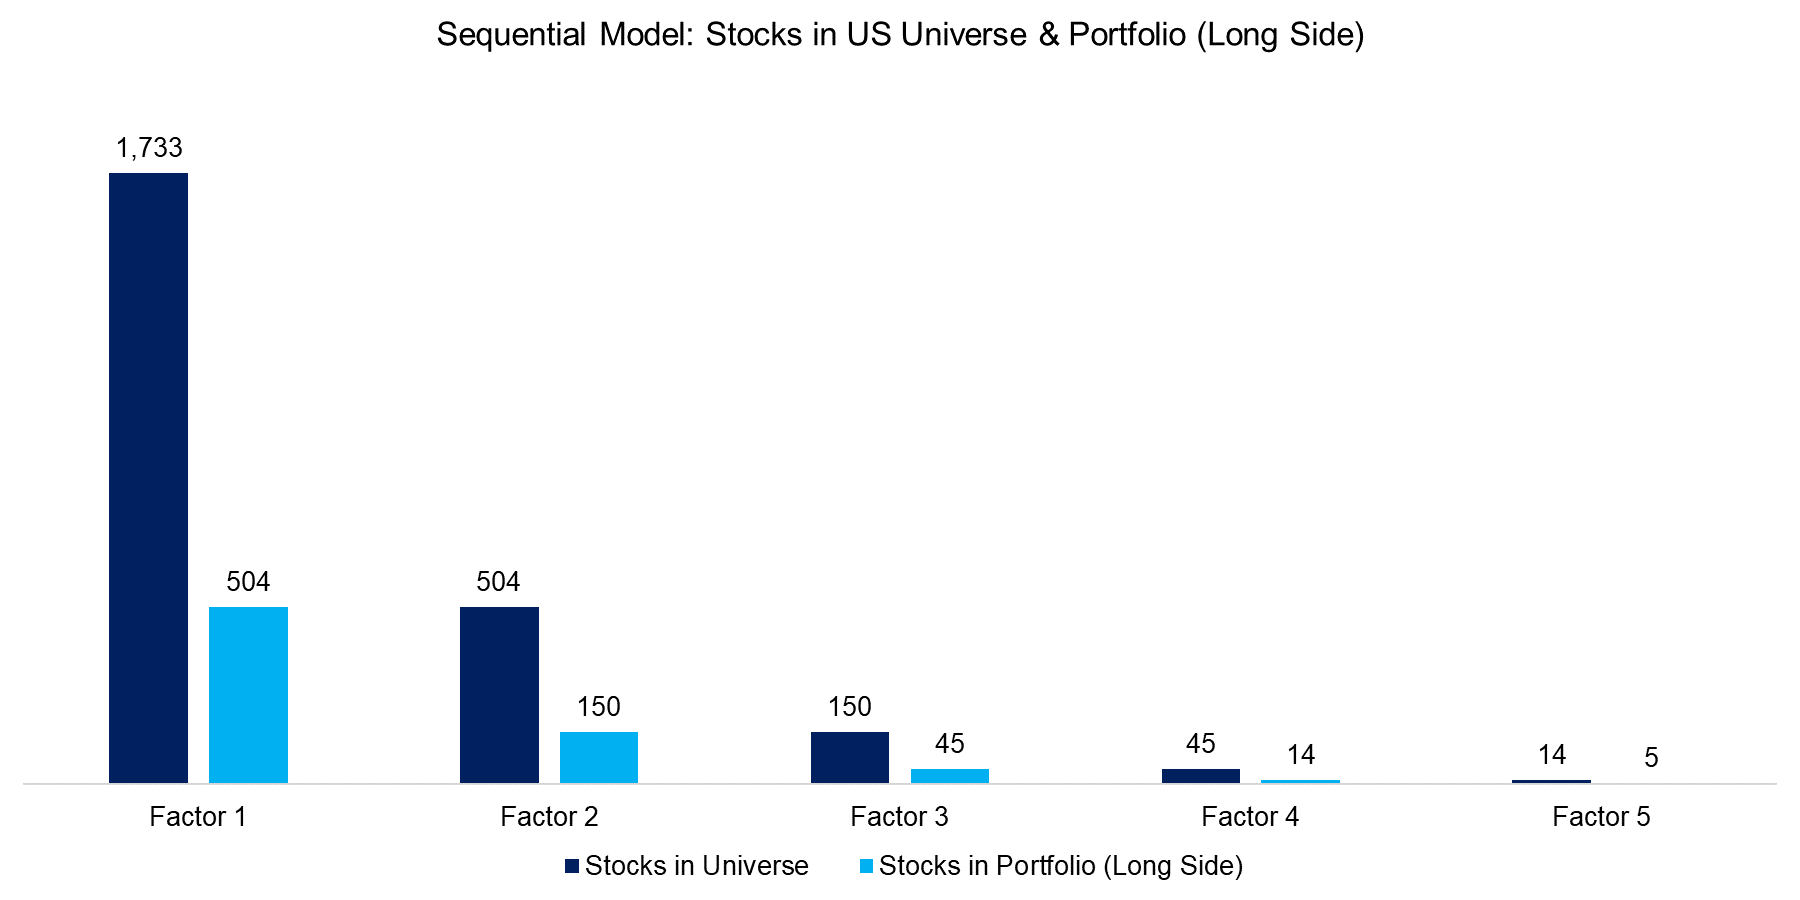
The sequential model is unique as it results in very concentrated portfolios as after each factor ranking the universe of stocks is reduced significantly. The chart below shows that the initial universe of stocks in the US above $1 billion of market capitalisation consists of 1,733 stocks. The first factor is created by taking the top and bottom 30% of this universe, which implies 504 stocks in the long and 504 stocks in the short portfolio. The second factor then only considers the top 504 stocks for the next ranking on the long side, resulting in a long portfolio of 150 stocks. After four factors there are only 14 stocks in the long and 14 stocks in the short portfolio, which is likely below what investors consider a diversified portfolio. In markets with smaller stock universes only a few factors can be used for a sequential sorting.
Source: FactorResearch
VALUE VS VALUE & SIZE
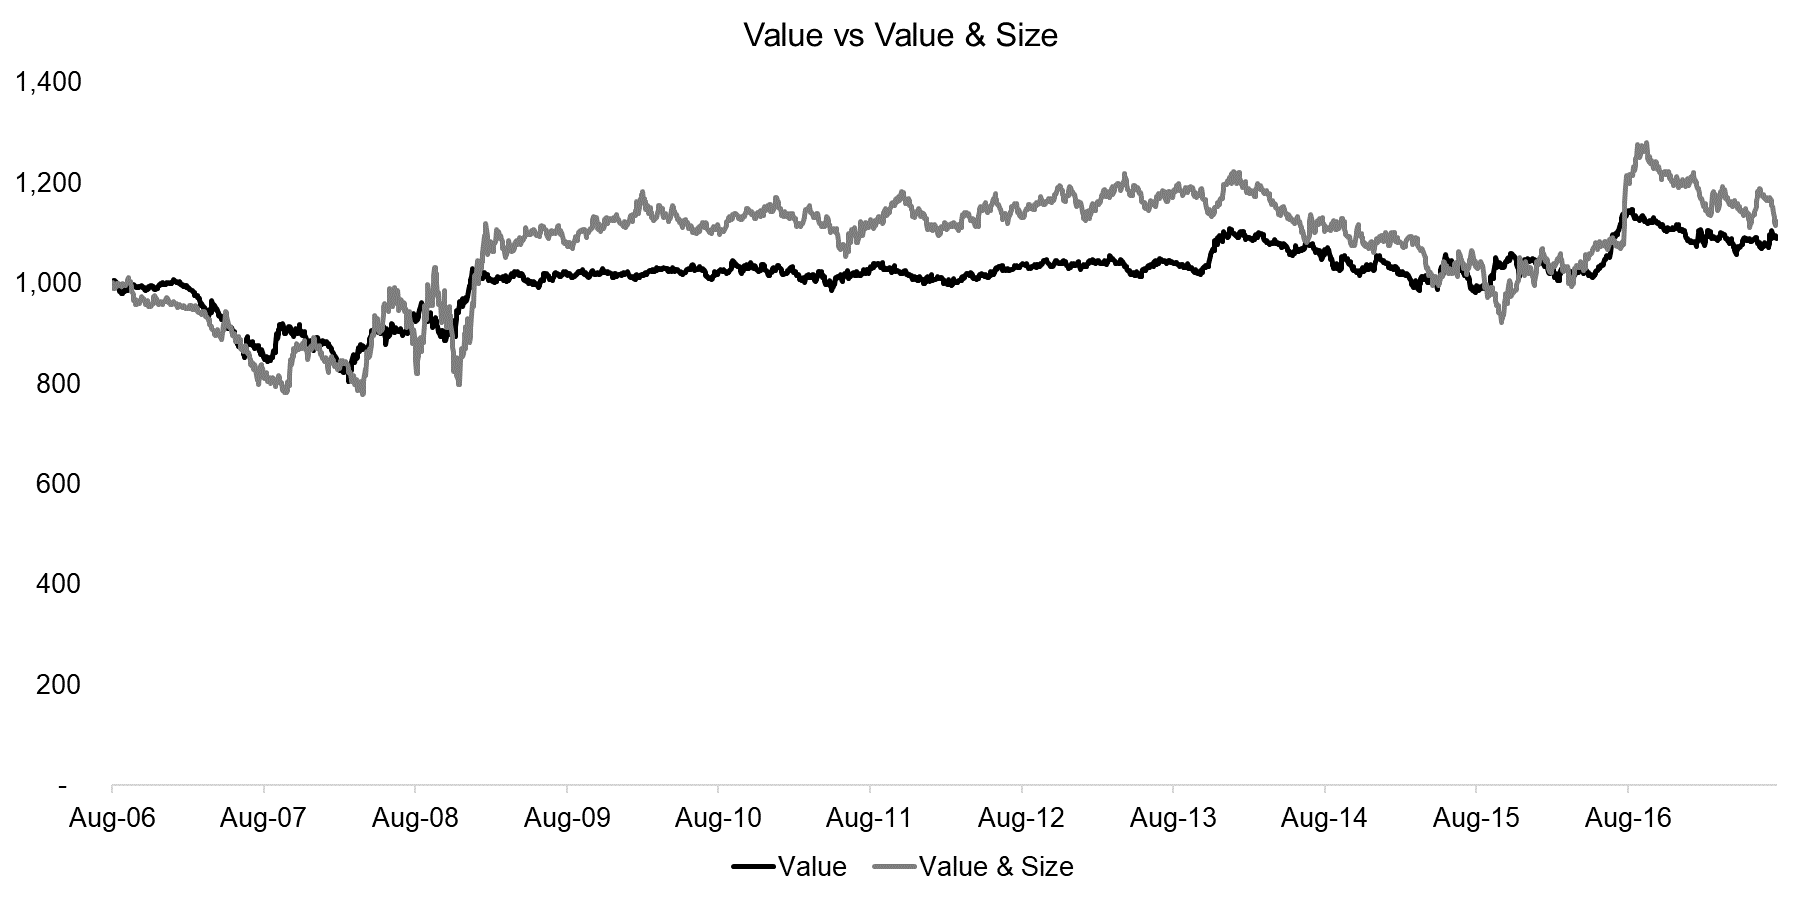
The chart below compares the performance of the Value factor versus a portfolio first ranked by Value and secondly by Size, i.e. these are cheap and small stocks in the long portfolio and expensive and large stocks in the short portfolio. We can observe that the performance of the Value factor is essentially flat for the period from 2006 to 2017. Sorting this portfolio for the Size factor sequentially did not change the results significantly, although the volatility increased, which can be explained by a more concentrated portfolio.
Source: FactorResearch
VALUE VS VALUE & SIZE & MOMENTUM
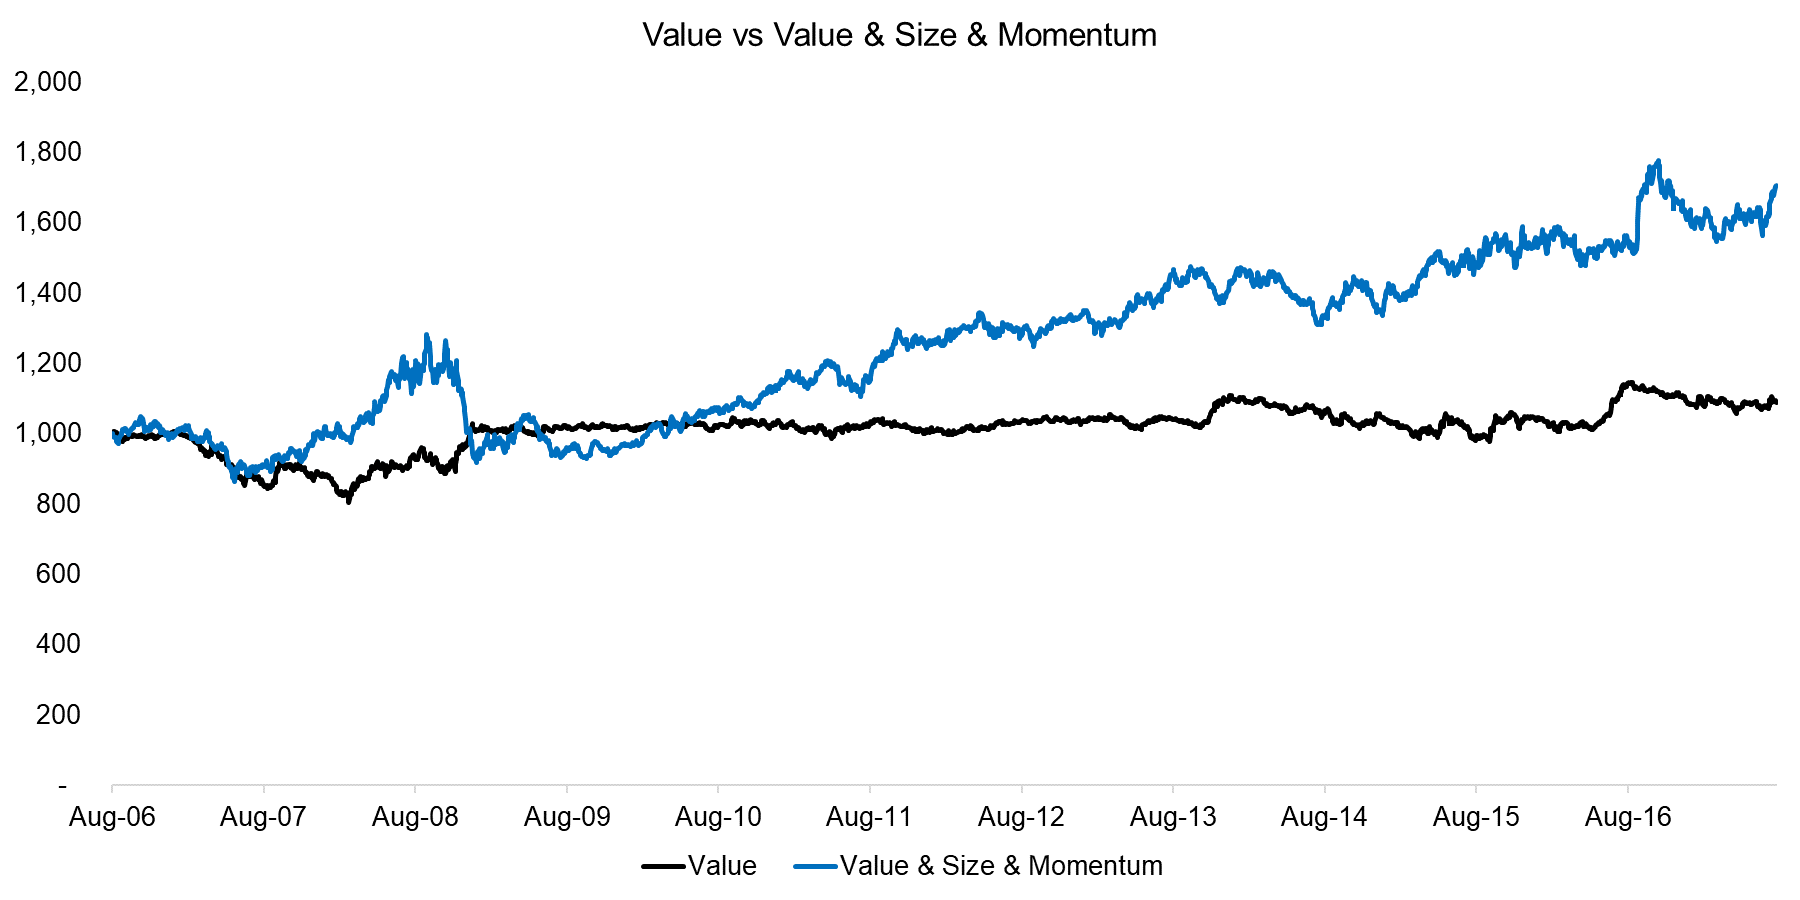
In the next iteration we add Momentum as a factor, which leads to a considerable improvement in performance, likely driven by greater diversification benefits. The benefit of adding Momentum can be seen during the Global Financial Crisis as the performance turned positive compared to the Value factor in 2008; however, we can also observe the Momentum crash of 2009 in the results.
Source: FactorResearch
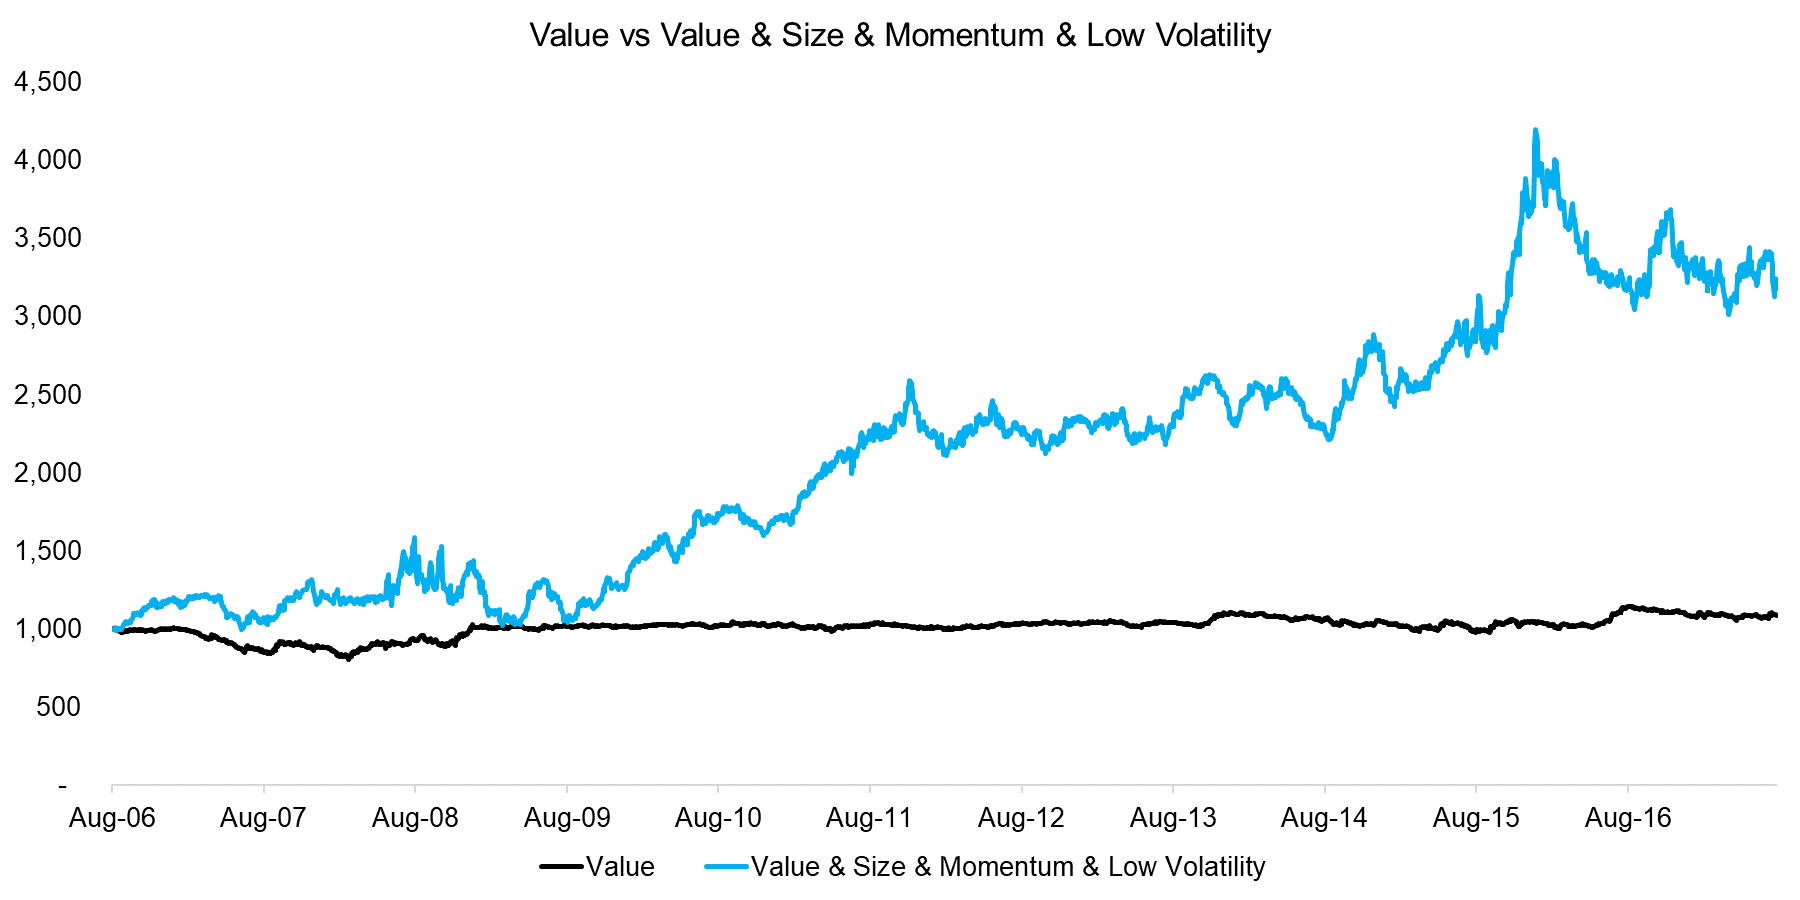
VALUE VS VALUE & SIZE & MOMENTUM & LOW VOLATILITY
The fourth factor to be added in the sequential sorting is the Low Volatility factor, which further improves the performance. However, the volatility of the sequential portfolio has also increased, which can be explained by a relatively small portfolio of 14 stocks on the long and 14 stocks on the short side.
Source: FactorResearch
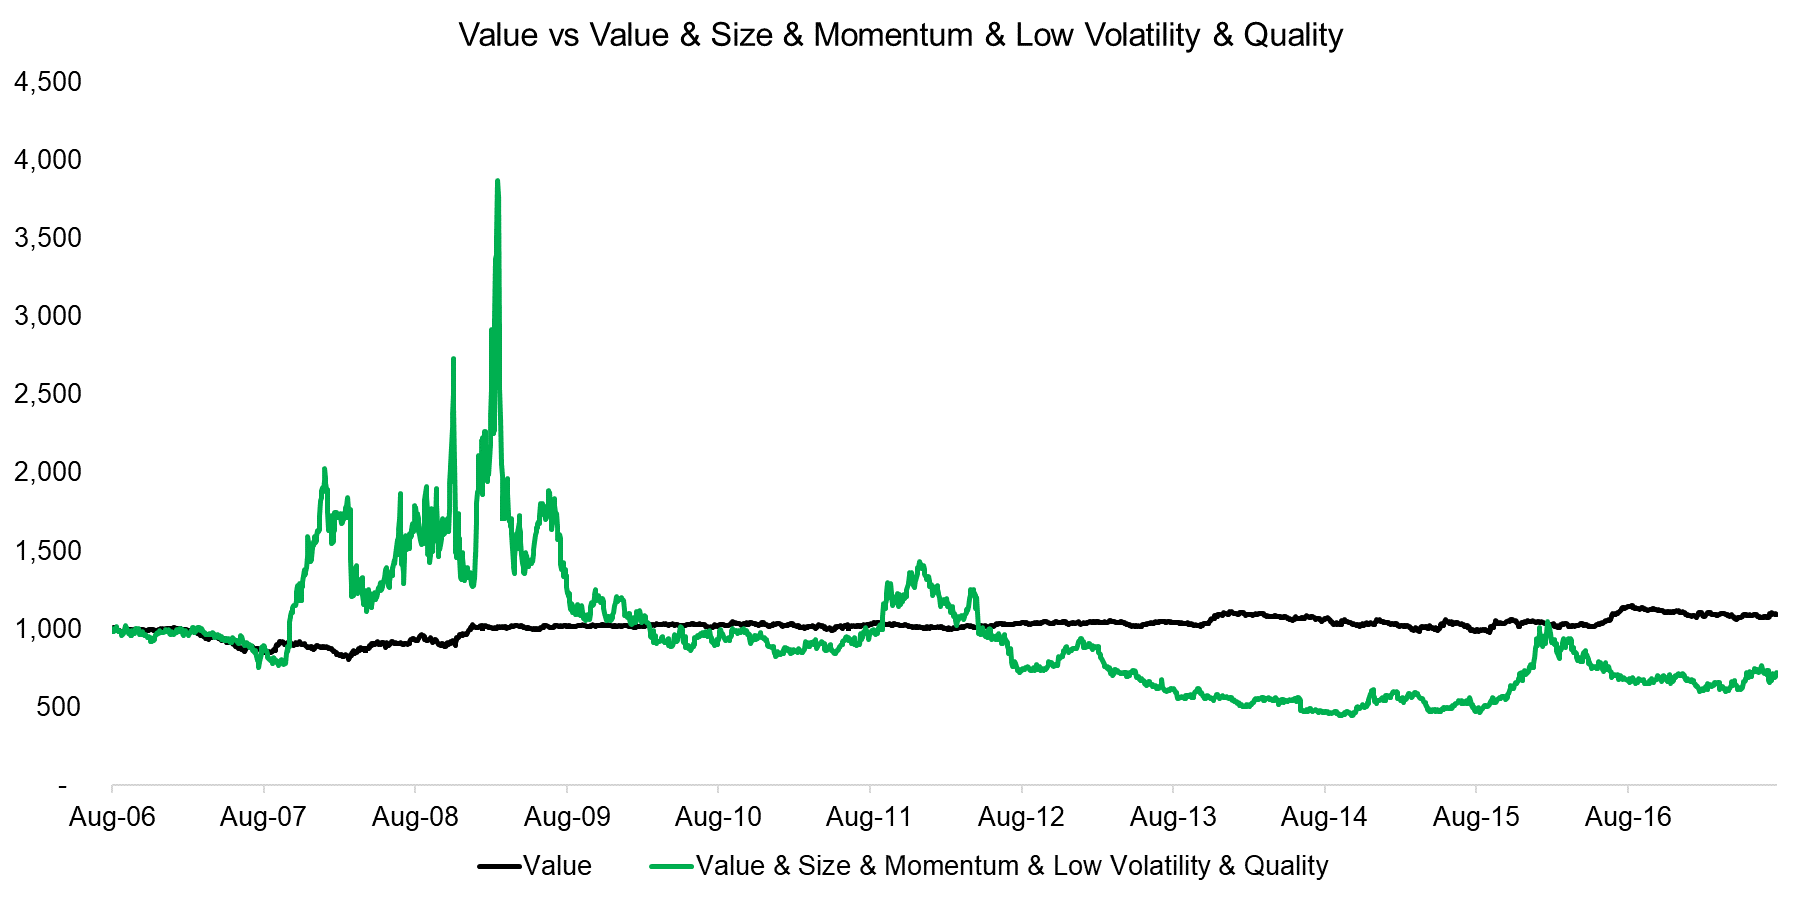
VALUE VS VALUE & SIZE & MOMENTUM & LOW VOLATILITY & QUALITY
The final factor to be added in the sequential sorting is the Quality factor, which we define as a combination of low debt-to-equity and high return-on-equity ratios. We observe a clear difference to the previous profiles and high volatility, which can be explained by the low number of stocks in the portfolio, i.e. 5 stocks on the long side and 5 stocks on the short side. The portfolio is no longer dominated by factor exposure, but by single stock risks.
Source: FactorResearch
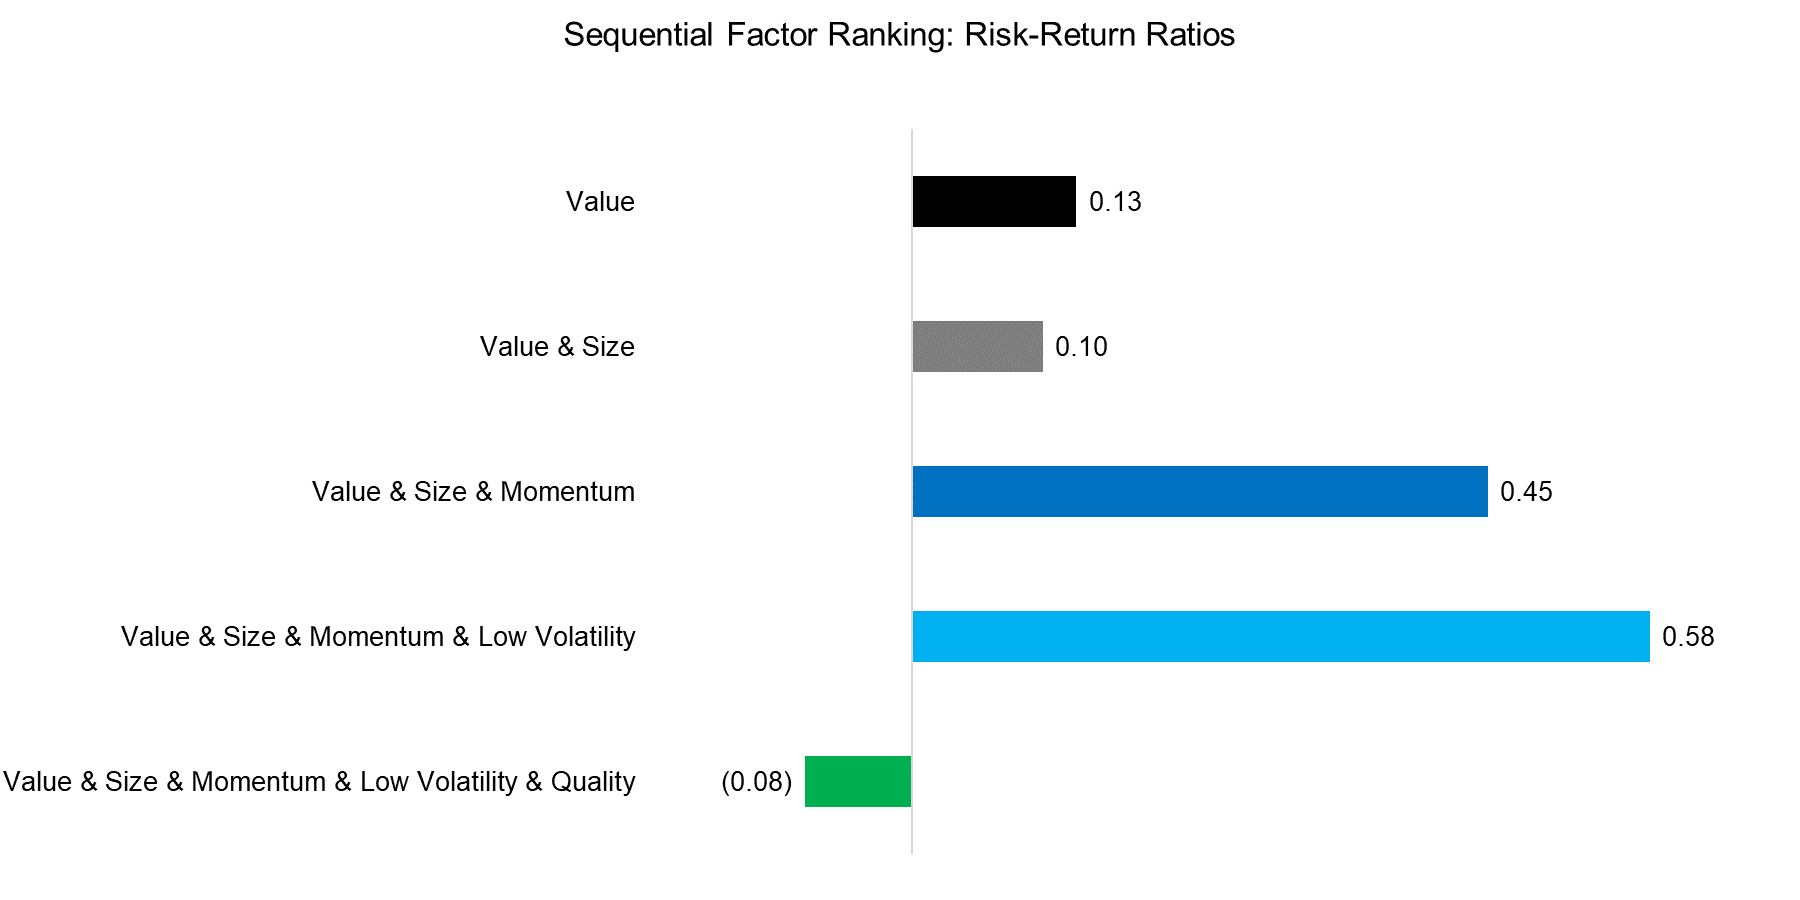
RISK-RETURN RATIOS
In addition to observing the performance, we can also analyse the risk-return ratios of the sequential portfolios. The analysis highlights that factors like Momentum and Low Volatility increase the risk-return ratios while others like Size decrease it. It is somewhat difficult to derive a conclusion from this analysis given that there are two components driving the performance of the sequential portfolios, i.e. the performance of the single factors and the number of stocks in the portfolio.
Source: FactorResearch
FURTHER THOUGHTS
This short research note highlights the effect of ranking stocks by factors sequentially, which is one approach to building multi-factor portfolios (please see our White Paper Multi-factor Models 101 for other approaches). The sequential model allows investors to prioritise factors and has the advantage of resulting in a concentrated portfolio of stocks. However, the prioritisation requires investors to have a strong preference for specific factors, which can be a difficult choice given that factors tend be highly cyclical.
ABOUT THE AUTHOR
Nicolas Rabener is the CEO & Founder of Finominal, which empowers professional investors with data, technology, and research insights to improve their investment outcomes. Previously he created Jackdaw Capital, an award-winning quantitative hedge fund. Before that Nicolas worked at GIC and Citigroup in London and New York. Nicolas holds a Master of Finance from HHL Leipzig Graduate School of Management, is a CAIA charter holder, and enjoys endurance sports (Ironman & 100km Ultramarathon).
Connect with me on LinkedIn or X.

