Skewness as a Factor
Analysing Punchy Stocks
June 2018. Reading Time: 10 Minutes. Author: Nicolas Rabener.
SUMMARY
- Skewness is a feature of stocks with high firm-risks
- Stocks with positive or negative skewness outperform the market
- Can partially be explained by the Size factor
INTRODUCTION
Many investors started their investment career at an early age, typically buying a stock that showed an enticing performance chart, was featured somewhere or recommended by a family member. Moving to a professional investment career often required a change in mentality by progressing from returns to risk-adjusted returns. Investors can continue this education by adding skewness and kurtosis as further layers of analysing potential investments; however, this often becomes challenging as these are somewhat more abstract concepts. Both provide insights into the distribution of returns, which unlike often assumed in financial theory, are not normally distributed.
Investors rank stocks by returns (Momentum) and volatility (Low Volatility) and could also use skewness and kurtosis as sorting variables (read Momentum Factor: Intra vs Cross-Sector). We will explore using skewness as a measure for ranking stocks, although we have no theory or expectation that this will result in anything but random returns, so this research note should be considered only for satisfying intellectual curiosity.
METHODOLOGY
We focus on the US stock market and measure the skewness of stocks over the last 12 months. Portfolios are created by selecting the top 10% of most skewed stocks, which results in a portfolio with the most positively and a portfolio with the most negatively skewed stocks. We also construct beta-neutral factor portfolios by buying the portfolios of skewed stocks and shorting the index. Only stocks with a market capitalisation of larger than $1 billion are included. Portfolios are rebalanced monthly and each transaction occurs costs of 10 basis points.
SKEWNESS OF THE S&P 500
In advance of the analysis of skewness on single stock level it is interesting to highlight the skewness of the entire stock market. Positive skewness describes a return distribution where frequent small losses and a few extreme gains are common while negative skewness highlights frequent small gains and a few extreme losses.
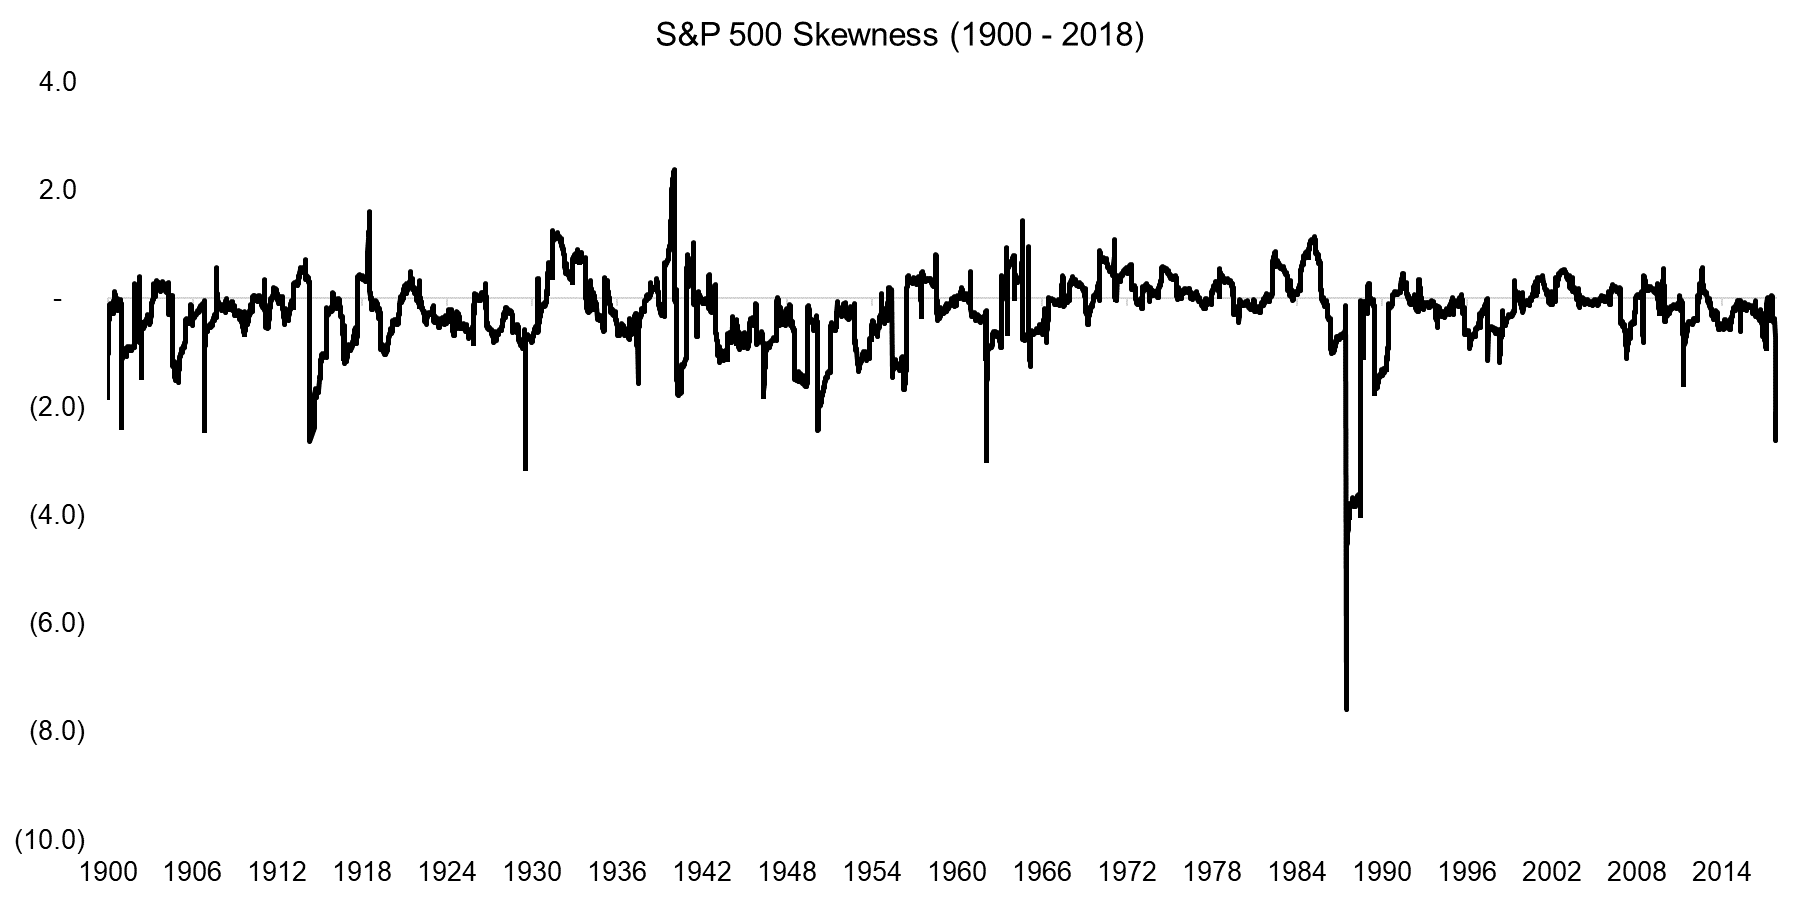
The chart below shows the skewness of the S&P 500 from 1900 to 2018. We can observe that the skewness was slightly negative (-0.2) on average. The analysis highlights some of the significant moments in stock market history, e.g. the stock market crash of 1987. We can see that the skewness currently is more extreme than during the Global Financial Crisis, which can be explained by the strong returns coupled with exceptionally low volatility that preceded the market losses of early 2018 (read Smart Beta & Factor Correlations to the S&P 500).
Source: Stooq.com, FactorResearch
CASE STUDY OF STOCKS WITH POSITIVE AND NEGATIVE SKEWNESS
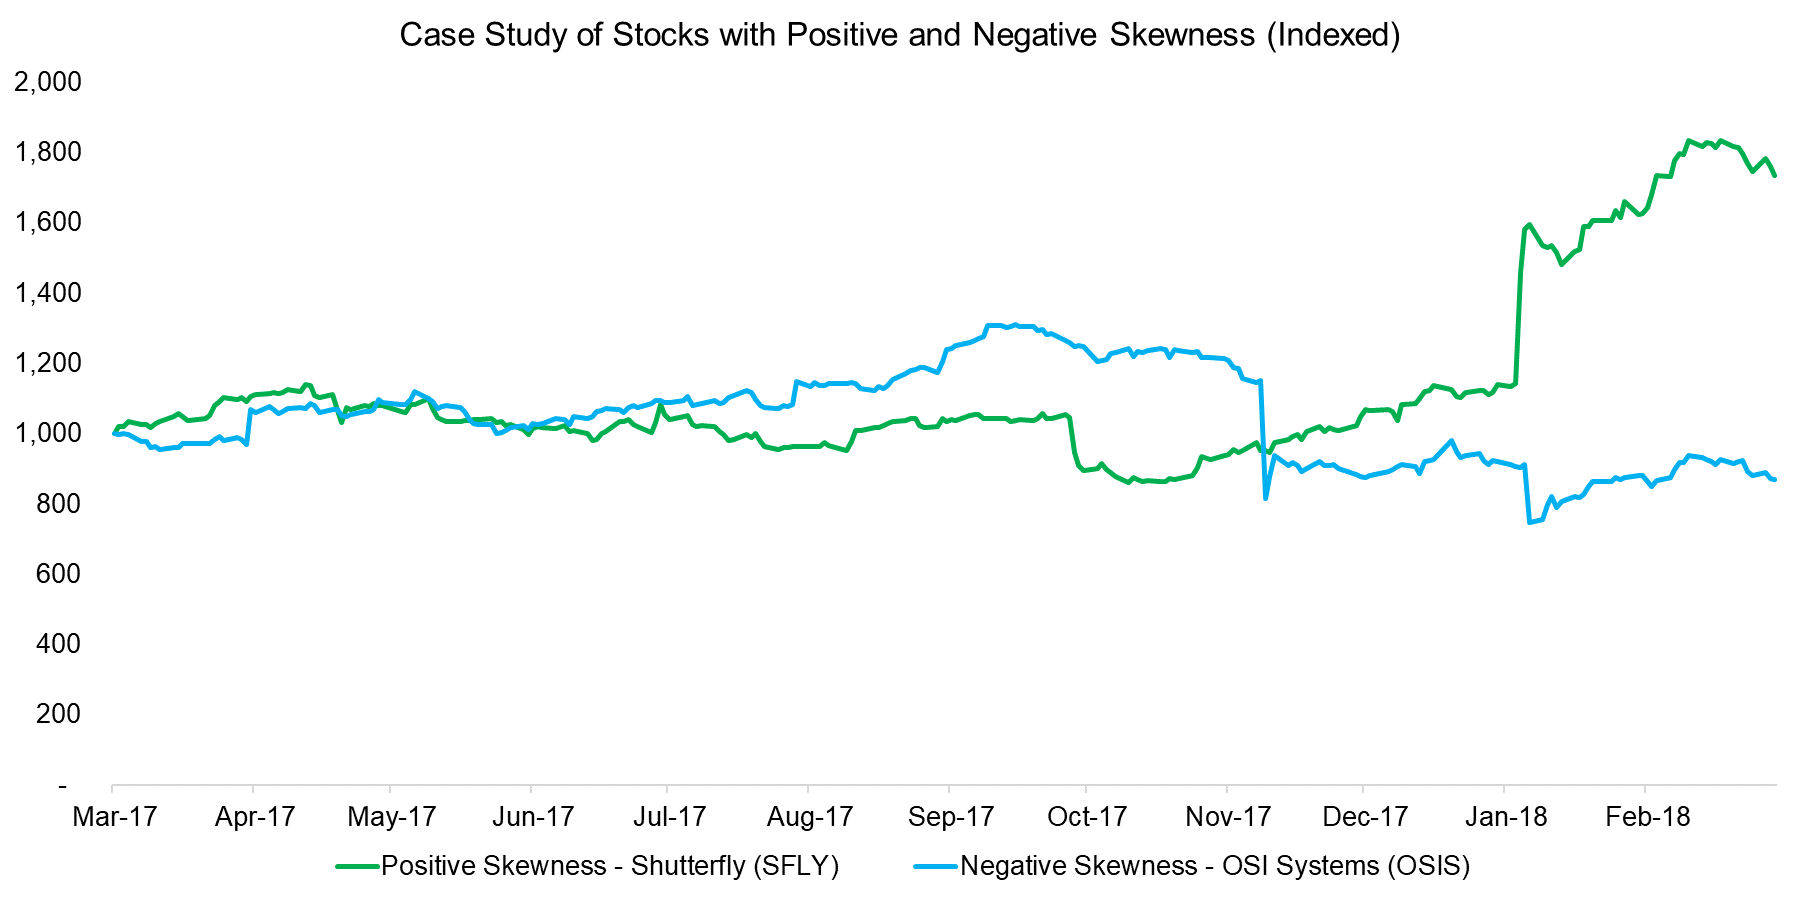
The chart below shows the performance of two stocks, Shutterfly (SFLY), a retail photobook company, and OSI Systems (OSIS), a security systems company, that serve as examples of positive and negative skewness (6.0 and -5.7 respectively). SFLY’s stock price exhibited moderate volatility in 2017, but then experienced a significant share price gain in early 2018 based on better-than-expected earnings and an accretive acquisition. OSIS’s share price generated a consistent performance throughout 2017 until it was accused of fraudulent and corrupt activity by Muddy Waters, a firm known for identifying short-selling targets, which led to a steep decline in the share price. Most stocks that exhibit skewness experienced events that had a strongly positive or negative impact on the companies.
Source: FactorResearch
STOCK PORTFOLIOS WITH SKEWNESS VERSUS MARKET
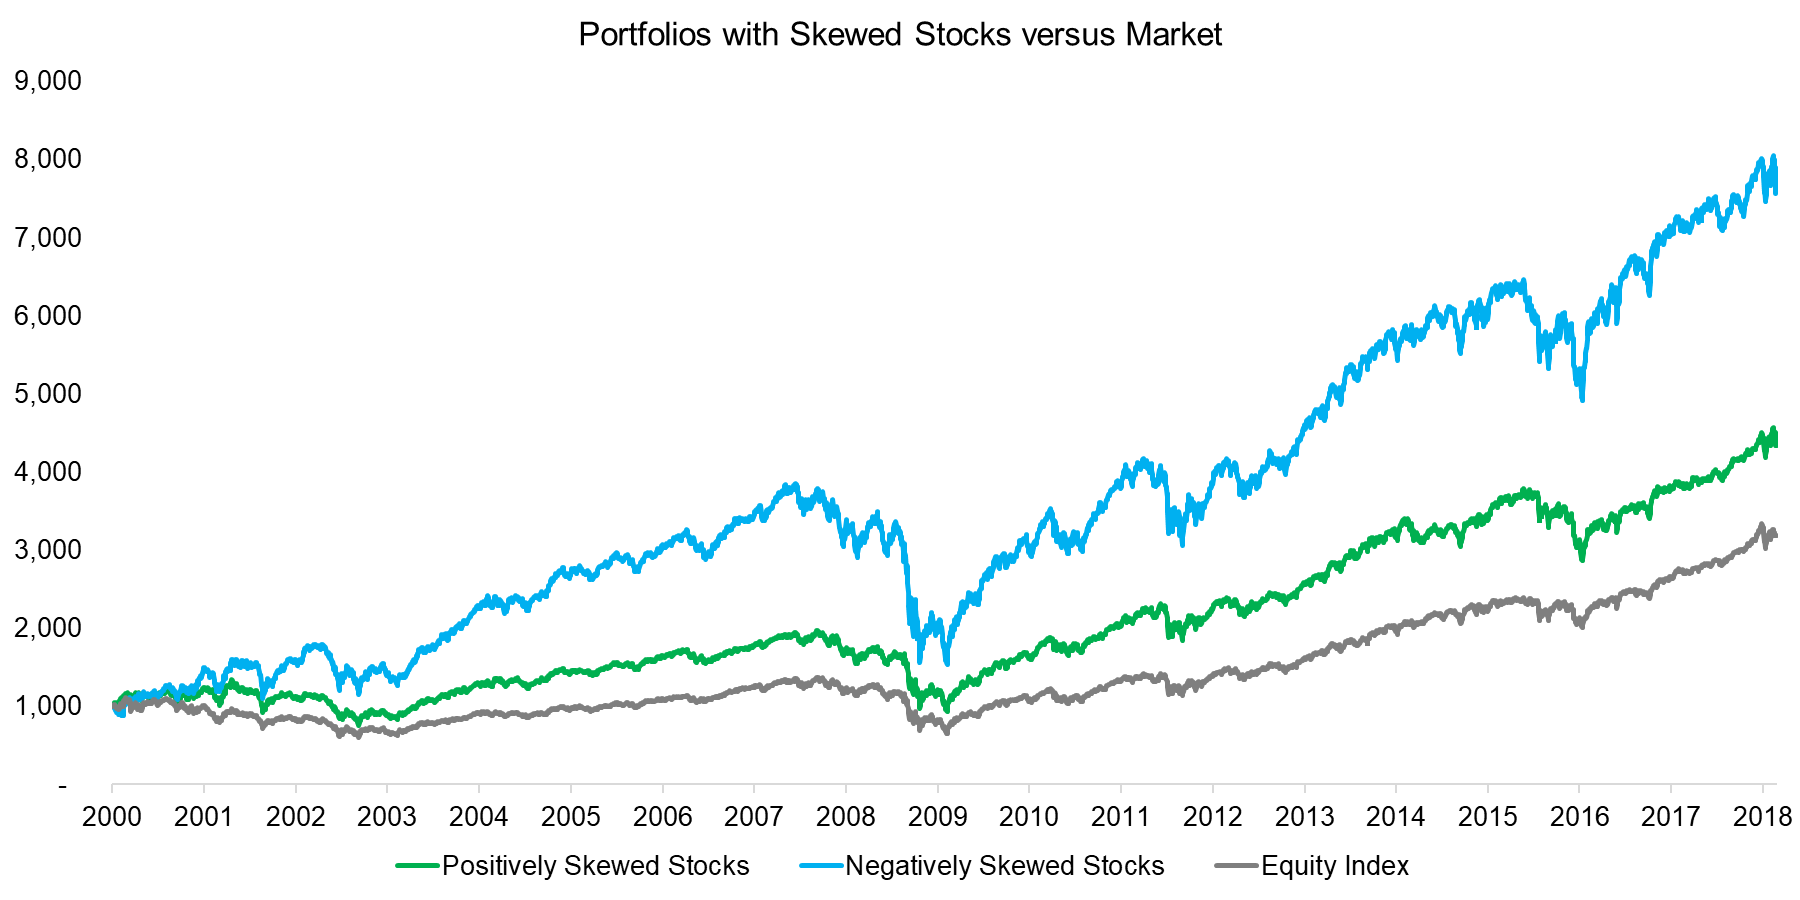
Next we create stock portfolios with positive and negative skewness and contrast these with the market. We can observe that both portfolios outperformed the market for the period from 2000 to 2018. The portfolio comprised of the top 10% of the most negatively skewed stocks, i.e. stocks that experienced violent share price decreases in the last 12 months, generated the highest returns. Perhaps the performance reflects some degree of mean-reversion as the stock selling might have been too aggressive.
Source: FactorResearch
ANALYSIS OF THE PORTFOLIOS WITH SKEWED STOCKS
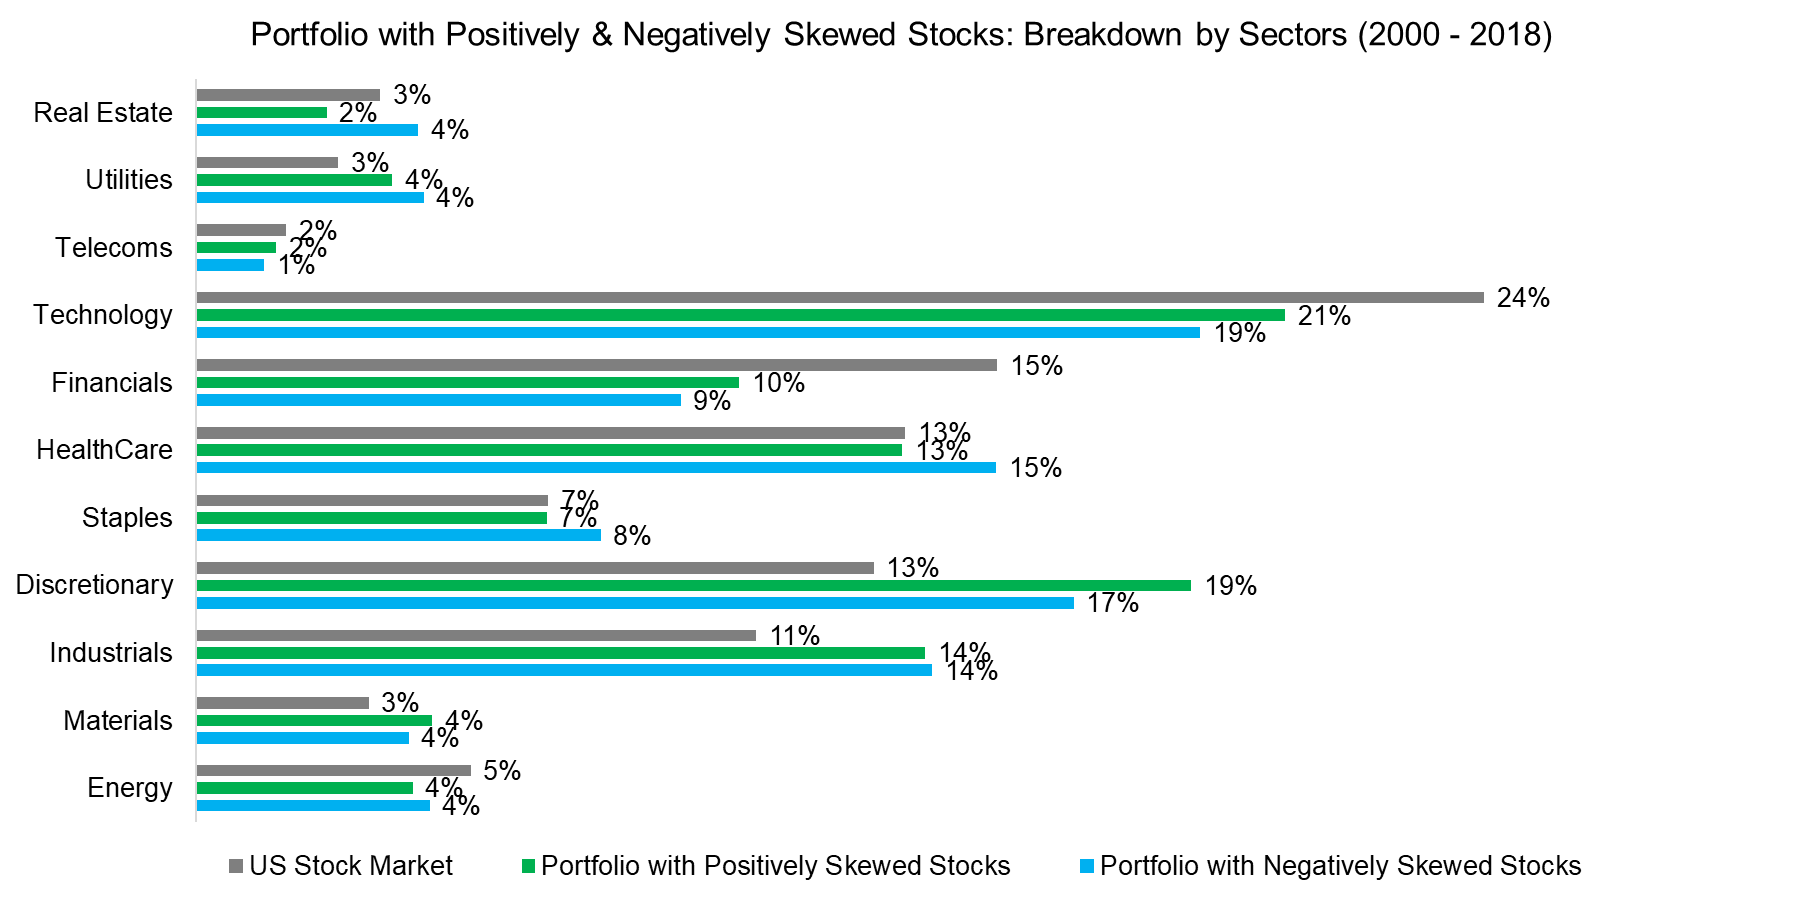
Investors might assume that some sectors are more prone to violent stock moves, e.g. biotech companies that are waiting for an approval for one of their pipeline drugs from the US Food and Drug Administration (FDA). However, the analysis below highlights that all sectors feature stocks with positive and negative skewness. However, the Technology and Financials sectors contribute less stocks to the skewness portfolios than their representation in the market while Discretionary and Industrials stocks contribute more. Tech and Financials stocks are likely more volatile than Discretionary and Industrial stocks, therefore less likely to exhibit skewness.
Source: FactorResearch
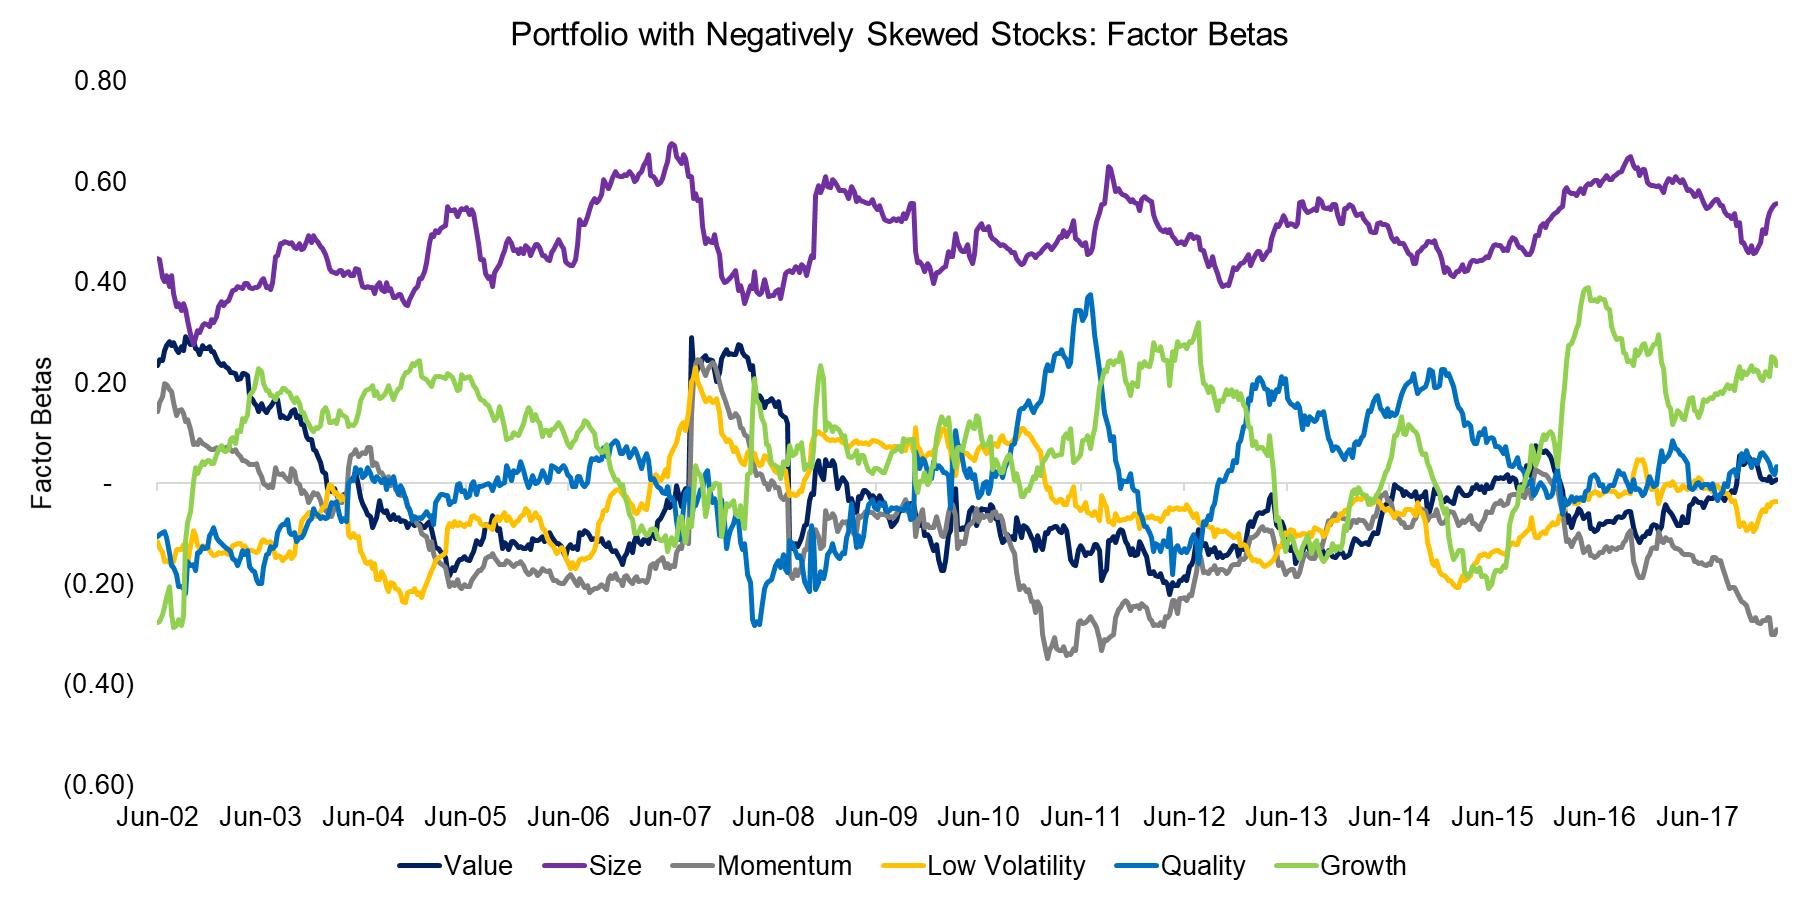
Given that the skewness strategies outperformed the market, we can attempt to explain the returns by common factors. A factor exposure analysis of the portfolio with negative skewness highlights mixed factor exposure in general, but strong exposure towards the Size factor. This exposure can be explained that skewness is much more likely to occur with companies with a smaller market capitalisations as they exhibit higher firm-risks than larger companies.
Source: FactorResearch
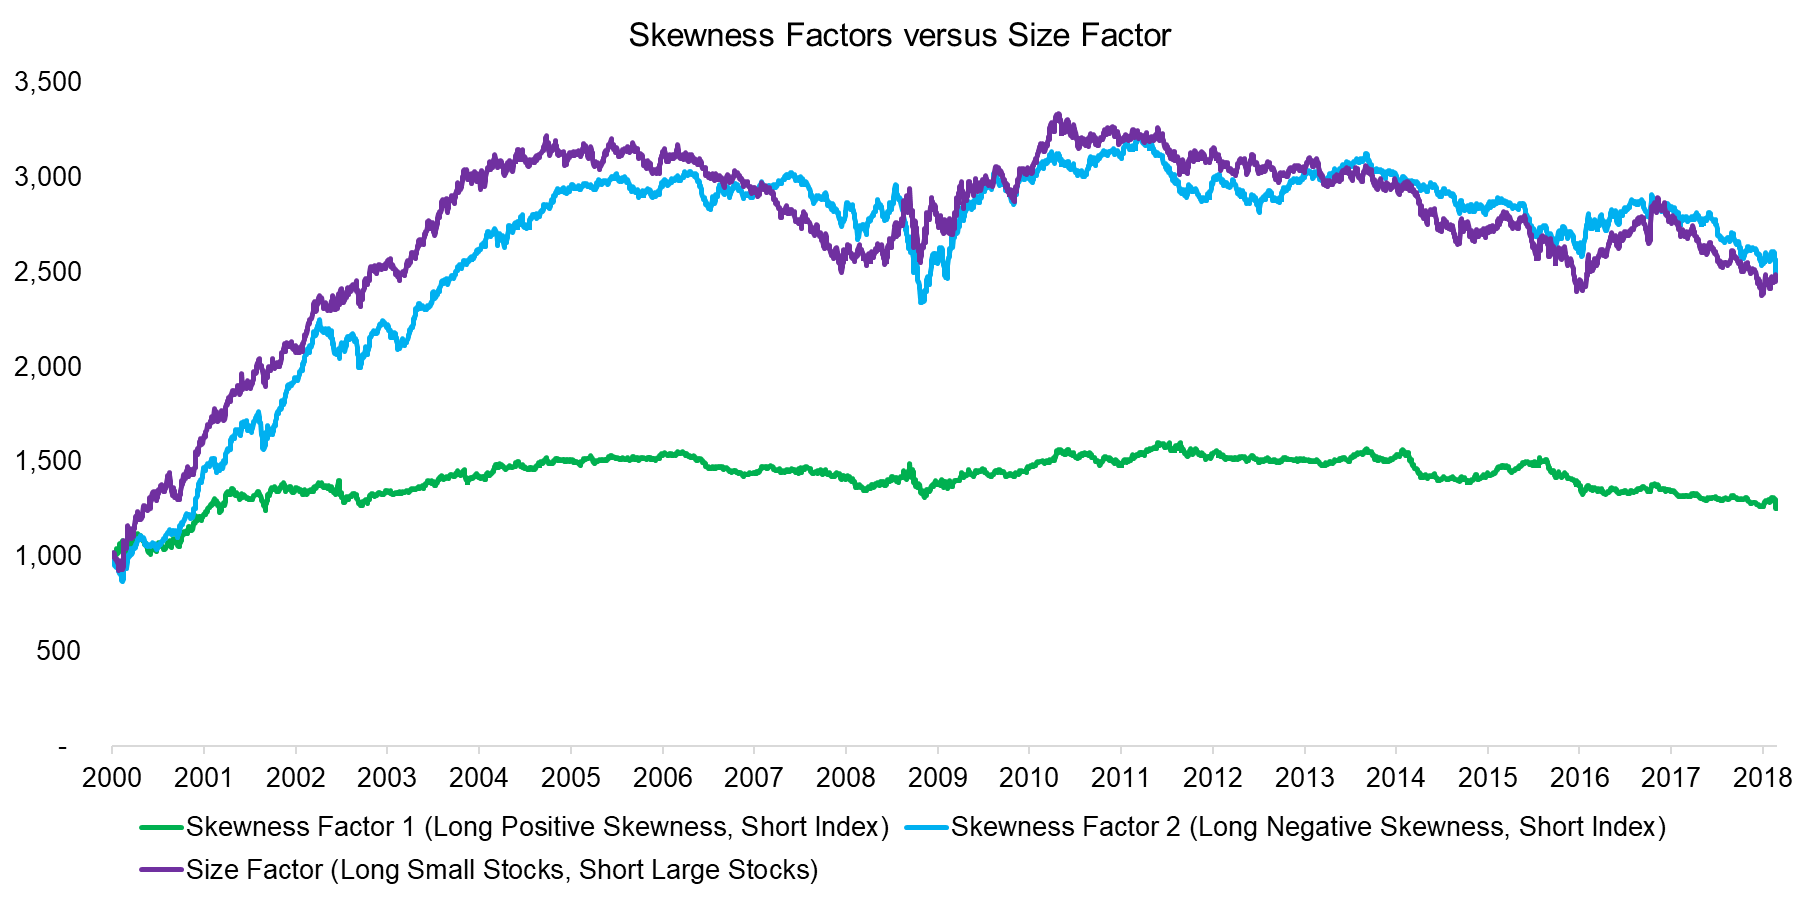
Given that the factor exposure analysis highlighted exposure to the Size factor, we can create long-short skewness portfolios by shorting the market. The analysis below highlights that the portfolio with negative skewness generated positive returns, albeit is a proxy for the Size factor. The portfolio with positive skewness has similar trends, but with much lower total returns. The difference in performance may suggest that the overreaction of investors to negative news is stronger than the underreaction to positive news.
Source: FactorResearch
FURTHER THOUGHTS
This short research note analyses portfolios created by ranking stocks for positive and negative skewness, which outperformed the market, but can partially be explained by the Size factor. The analysis is somewhat flawed from the beginning as a quantitative researcher should first define a sound theory and then perform the backtesting. Randomly backtesting strategies without a sound theory in place is likely to result in data mining. As often in financial markets, the enemy is us.
ABOUT THE AUTHOR
Nicolas Rabener is the CEO & Founder of Finominal, which empowers professional investors with data, technology, and research insights to improve their investment outcomes. Previously he created Jackdaw Capital, an award-winning quantitative hedge fund. Before that Nicolas worked at GIC and Citigroup in London and New York. Nicolas holds a Master of Finance from HHL Leipzig Graduate School of Management, is a CAIA charter holder, and enjoys endurance sports (Ironman & 100km Ultramarathon).
Connect with me on LinkedIn or X.

