Skewness of Funds – Friend or Foe?
It’s complicated.
- Some funds exhibit strong skewness profiles
- Skewness is highly time-varying and not necessarily a negative criteria
- Should be measured but unlikely managed
INTRODUCTION
The trouble with investing in emerging markets is that they are quite different, which requires extensive due diligence on each of them, and they also can change quickly. For example, take Argentina versus China. The former has been mismanaged for decades, while the latter has been managed exceptionally well for the size of the country, lifting close to a billion people out of poverty.
However, China changed its policy over the last two years and started turning inwards, while Argentina’s citizens elected a reform-minded president who gives investors hope for a reversal of fortunes. Although stock markets often do not reflect economic growth, in this case, the Argentinian stock market has started outperforming the Chinese one (read Myth-Busting: The Economy Drives the Stock Market).
The volatility of both markets is comparable, but their skewness is not. The Chinese stock market features a skewness of +0.45 versus -0.96 for the Argentinian market over the last 13 years. Should this trouble investors?
In this article, we will explore the skewness of funds.
TOP & BOTTOM MOST SKEWED FUNDS
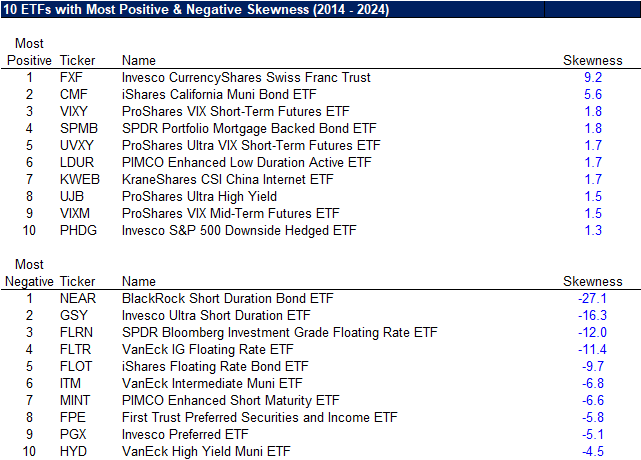
We focus on ETFs trading in the U.S. that have at least 10 years of track record, which is a universe of approximately 1,000 funds, and compute their skewness using daily returns for the decade between 2014 and 2024 (read Skewness as a Factor).
Reviewing the top 10 most positively skewed ETFs highlights a diverse range of products providing exposure to currencies, bonds, and volatility. The VIX products are perhaps the most intuitive instruments for thinking about positive skewness as the VIX tends to mostly decline but then occasionally explode upwards when something happens that could have adverse effects on the economy and stock market.
In contrast, the top 10 most negatively skewed products are exclusively from the fixed income space. Bonds show the inverse return pattern of the VIX as they mostly generate small positive returns until they lose significantly when inflation rises unexpectedly or the issuers’ credit quality deteriorates.
Source: Finominal
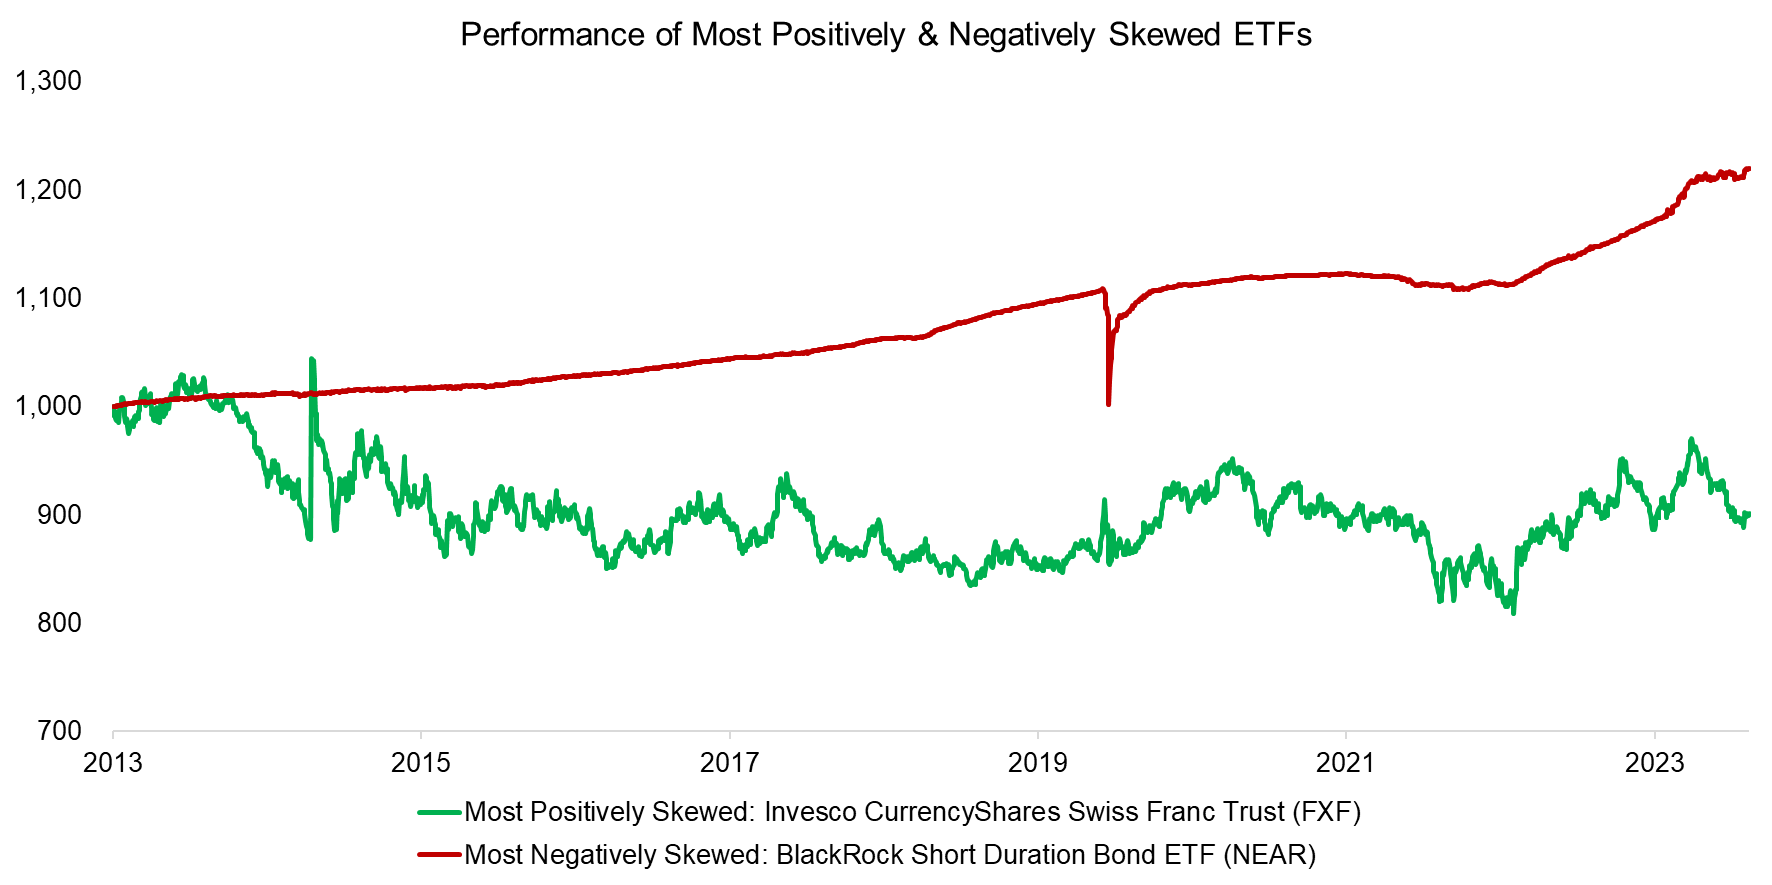
It is worth highlighting that spotting positive skewness on a chart can be more challenging than identifying negative skewness. The performance of the most positively skewed ETF of the last decade, namely the Invesco CurrencyShares Swiss Franc Trust (FXF), seems rather normal, except for a spike in 2015.
In contrast, the performance of the most negatively skewed ETF, which is the BlackRock Short Duration Bond ETF (NEAR), is a perfect case study for negative skewness: small but consistent gains with one large decline during the COVID-19 crisis in March 2020.
Source: Finominal
SKEWNESS OF FUND TYPES
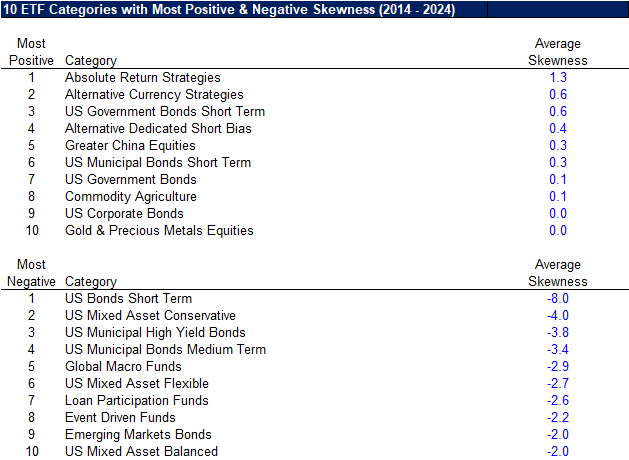
Next, we compute the average skewness for ETF categories, where it is surprising to see various types of bond funds exhibiting positive and negative skewness. More intuitive is that short-biased funds, which tend to lose mostly money except when stocks crash, and gold and precious metal equities, which also tend to outperform when stocks crash, to show positive skewness. However, investors might also expect global macro and event-driven hedge funds to be positively skewed, but they are not.
Source: Finominal
TIME-VARYING NATURE OF SKEWNESS
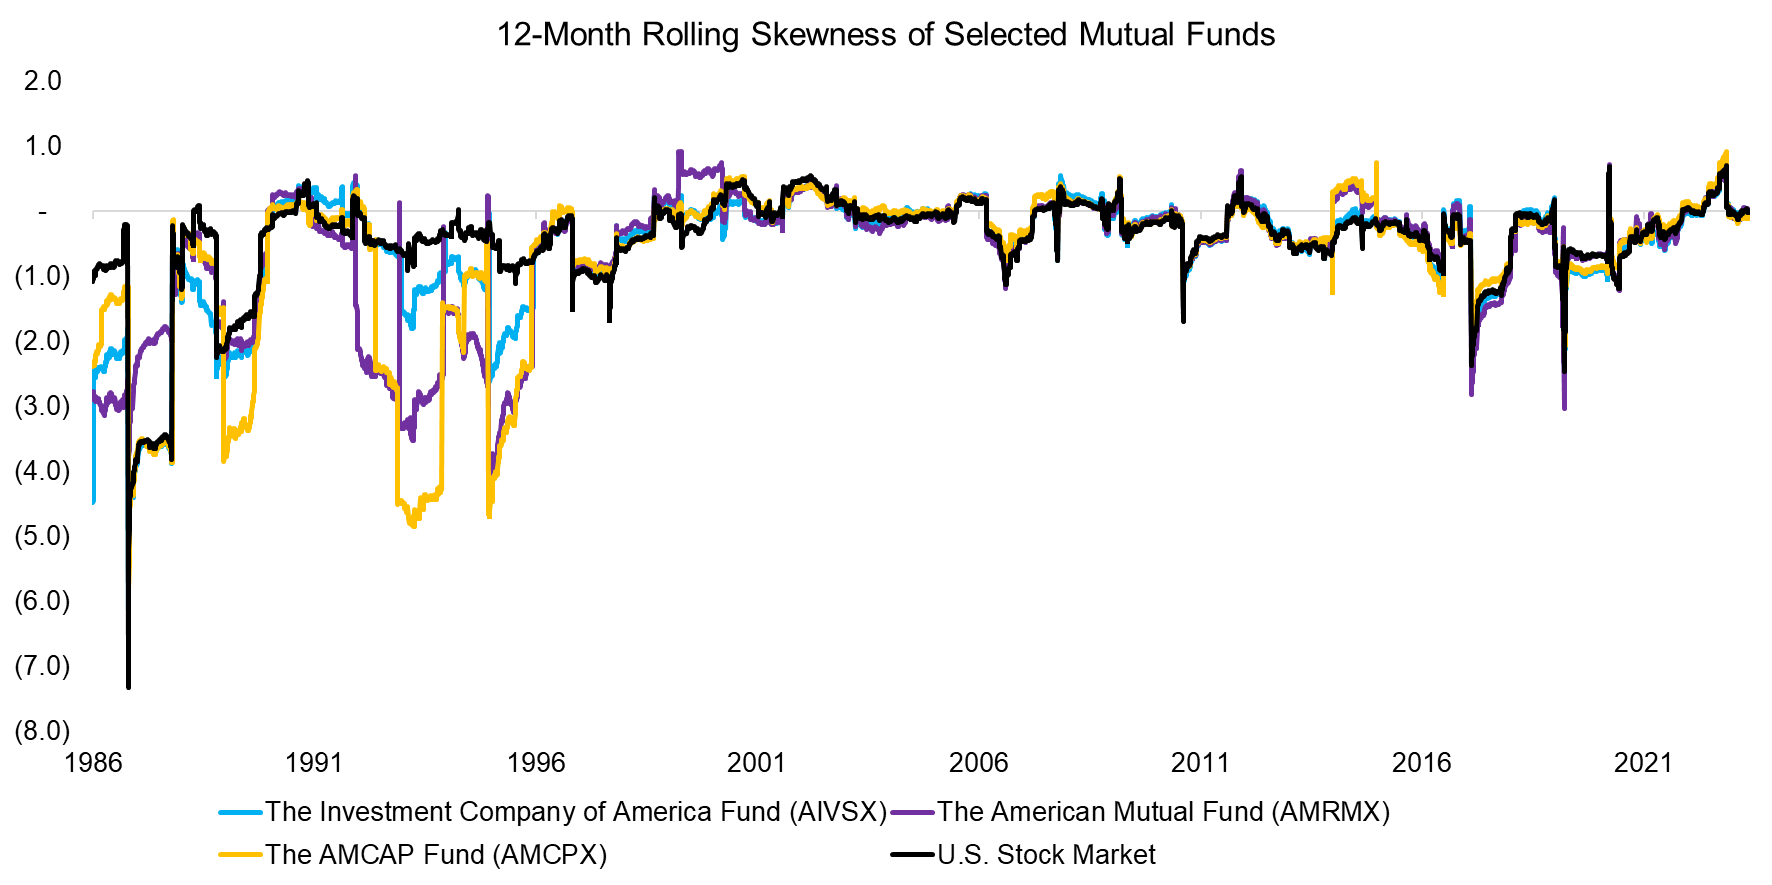
Given the counter-intuitive results of analyzing the skewness of ETFs of the last 10 years, we change the perspective from looking at the average skewness to rolling skewness across time. Specifically, we select three equity mutual funds with track records since 1986.
First, we observe that the skewness of the three funds broadly mirrored that of the U.S. stock market. Second, the skewness varied wildly across time and an average would highly depend on the lookback period, e.g. the skewness was very negative in the 1980s as that included the 1987 stock market crash. Third, the skewness of these three funds did differ in certain periods, which reflects different underlying portfolios and risk exposures.
Source: Finominal
SKEWNESS OF THE U.S. STOCK MARKET
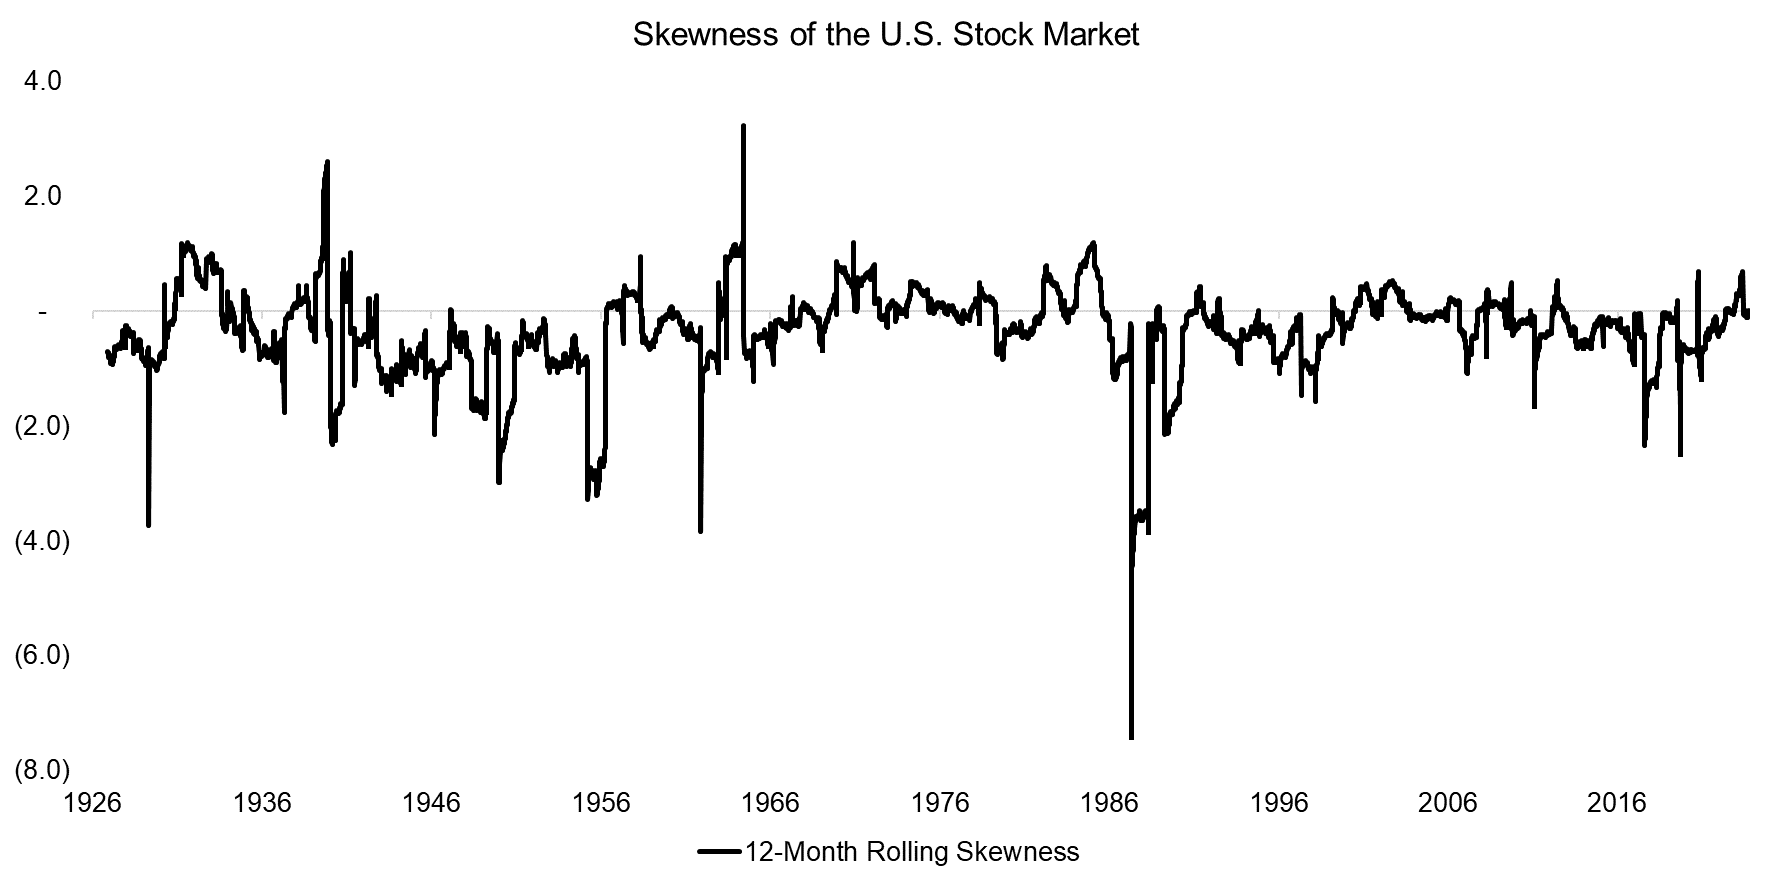
If the skewness of equity mutual funds broadly mirrors that of the U.S. stock market, then we should review this as well. The U.S. stock market features an average skewness of -0.35 in the period between 1926 and 2024, but this ranged from -7.4 to +3.2 when using 12-month rolling windows and daily returns.
It does appear that the market was more negatively skewed in the first half of the 20th century, which we could explain by the U.S. capital markets being far less evolved than in the second half, e.g. the U.S. Federal Reserve has become more sophisticated and more regulation to safeguard the financial system like Basel Framework has been passed (read Have Stock Markets Changed?).
It is worth highlighting that the U.S. stock market was most negatively skewed after the Black Monday crash in 1987, but this represented an excellent buying opportunity in hindsight as stocks recovered and the bull market resumed. Negative skewness is therefore not necessarily negative for expected returns.
Source: Kenneth R. French Data Library, Finominal
FURTHER THOUGHTS
Should investors care about the skewness of asset classes and strategies?
Investors tend to dislike investments with positive skewness as these mostly lose money but often fall for ones with negative skewness. However, the negative skewness typically only becomes apparent after a major loss, where some might recall short VIX products like XIV. Furthermore, skewness depends on the lookback period and can reflect the broader market rather than the nature of a specific strategy. Stated differently, it’s complicated.
Perhaps investors should keep it simple and be wary of products that look too good to be true, e.g. private credit or real estate funds with abnormally high Sharpe ratios (read The Case Against Private Markets and A Crescendo in Private Credit?) as these are likely negatively skewed, even if currently not apparent.
A well-diversified portfolio should not exhibit strongly positive or negative skewness, but measurement is likely better than management in this case.
RELATED RESEARCH
Skewness as a Factor
Diversification versus Hedging II
Diversification versus Hedging
Finding Funds with Diversification Potential
Downside Betas vs Downside Correlations
Have Stock Markets Changed?
ABOUT THE AUTHOR
Nicolas Rabener is the CEO & Founder of Finominal, which empowers professional investors with data, technology, and research insights to improve their investment outcomes. Previously he created Jackdaw Capital, an award-winning quantitative hedge fund. Before that Nicolas worked at GIC and Citigroup in London and New York. Nicolas holds a Master of Finance from HHL Leipzig Graduate School of Management, is a CAIA charter holder, and enjoys endurance sports (Ironman & 100km Ultramarathon).
Connect with me on LinkedIn or X.

