Smart Beta Asset Allocation Models
How to Allocate Smartly to Smart Beta?
March 2019. Reading Time: 10 Minutes. Author: Nicolas Rabener.
SUMMARY
- Most smart beta strategies outperformed the market since 1990, but few have in recent years
- Diversifying across strategies mitigates the risk of underperformance
- Various asset allocation models for creating multi-factor portfolios highlight similar results
INTRODUCTION
The appearance of smart beta ETFs has simplified the life of investors as they no longer need to suffice themselves with plain beta. However, investors that allocated to Value-focused smart beta ETFs have painfully become aware that smart beta is not always better than beta, given the underperformance over the last decade.
Investors, fortunately, have a choice of multiple smart beta categories, which can be exploited by diversifying across strategies in pursuit of outperformance with higher consistency. However, once the decision was made to create a multi-factor portfolio, it raises the question of how to allocate smartly to the strategies.
In this short research note, we will investigate asset allocation models for smart beta strategies in the US stock market (read Factor Allocation Models).
METHODOLOGY
We focus on seven factors namely Value, Size, Momentum, Low Volatility, Quality, Growth, and Dividend Yield in the US stock market. The long-only factor portfolios are created by selecting the 30% stocks ranked most favorably by the factor and weight these by their market capitalization. The factor definitions are in line with academic research. Only stocks with a minimum market capitalization of $1 billion are included. Portfolios are rebalanced monthly and each transaction incurs costs of 10 basis points.
It is worth noting that we are not using the actual returns of smart beta ETFs as these have a limited price history. The first Value and Growth-focused ETFs were launched in 2000 while Low Volatility smart beta ETFs appeared only in 2009. However, we recently benchmarked our theoretical long-only factor portfolios to smart beta ETFs, which revealed relatively minor tracking errors. Please see our research note Benchmarking Smart Beta ETFs for further details.
SMART BETA PERFORMANCE IN THE US
Nearly all of the seven smart beta strategies outperformed the market since 1990, except for Low Volatility and Quality. However, the strategies performed quite differently across time, which is especially pronounced during the Tech bubble in 2000 where Momentum and Growth generated significantly higher returns than the other strategies.
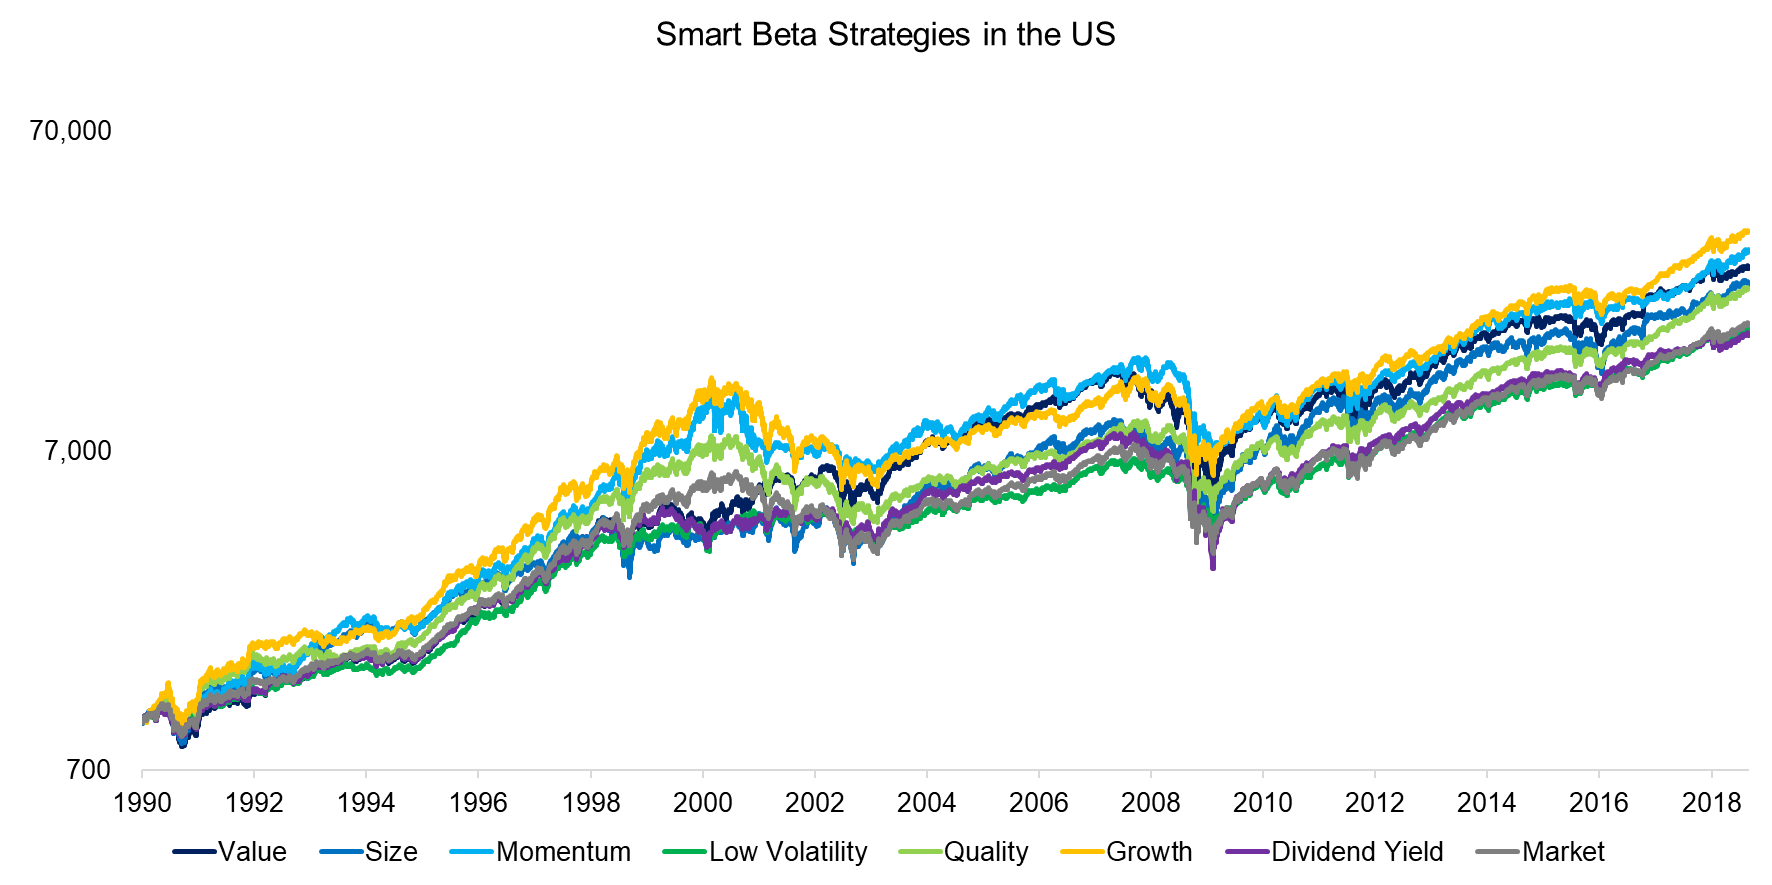
Source: FactorResearch
Critical observers might challenge these results as it can be considered to be unusual that most factors outperformed the market. It is worth noting that the starting point of the analysis has a large impact on the returns and the results change meaningfully if we rebase them at later points. If measured from 2000 onwards only half of the factors outperformed the market significantly and from 2010 onwards only two out of seven did.
The change in performance leadership highlights the frequent factor rotation, which provides investors with the incentive to diversify across factors in order to harvest abnormal returns with higher consistency.
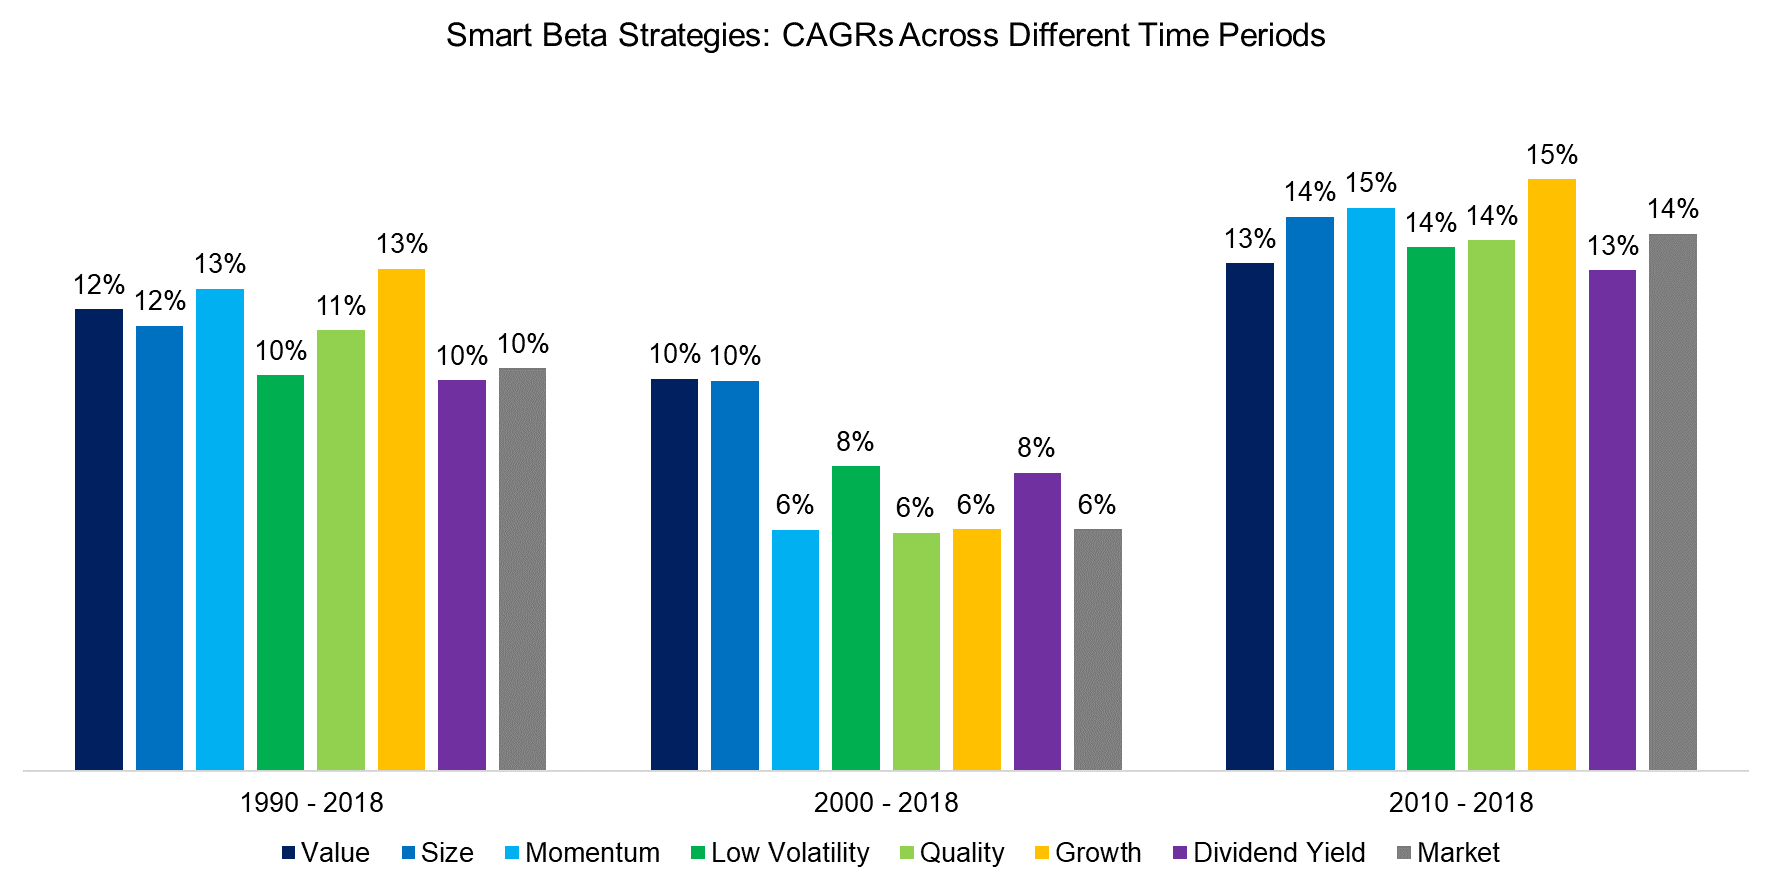
Source: FactorResearch
SMART BETA ALLOCATION MODELS
Investors may consider a simple equal-weight allocation to all smart beta strategies or more sophisticated asset allocation models. We evaluate the following models, which feature monthly rebalancing:
- Momentum (Total Return): The total return of each smart beta strategy is measured over the last 12 months and the best three out of seven strategies are selected, receiving equal allocations.
- Momentum (Sharpe): The Sharpe ratio of each smart beta strategy is measured over the last 12 months and the best three out of seven strategies are selected, receiving equal allocations.
- Equal Weight: Each of the seven strategies receives the same allocation.
- Risk Parity: The weight of each strategy is determined in inverse proportion to its volatility, which is measured over the last 12 months. Therefore the higher the volatility, the lower the allocation.
We observe that all multi-factor smart beta portfolios outperformed the market since 1991, which is expected given that most of the strategies generated abnormal returns on a stand-alone basis. The two Momentum-driven portfolios generated the highest returns while the Equal Weight and Risk Parity portfolios show a lower and almost identical performance. The difference between the models was especially large around 2000, where the Momentum-driven portfolios allocated to Tech stocks via exposure to the Momentum, Growth, and Quality factors.
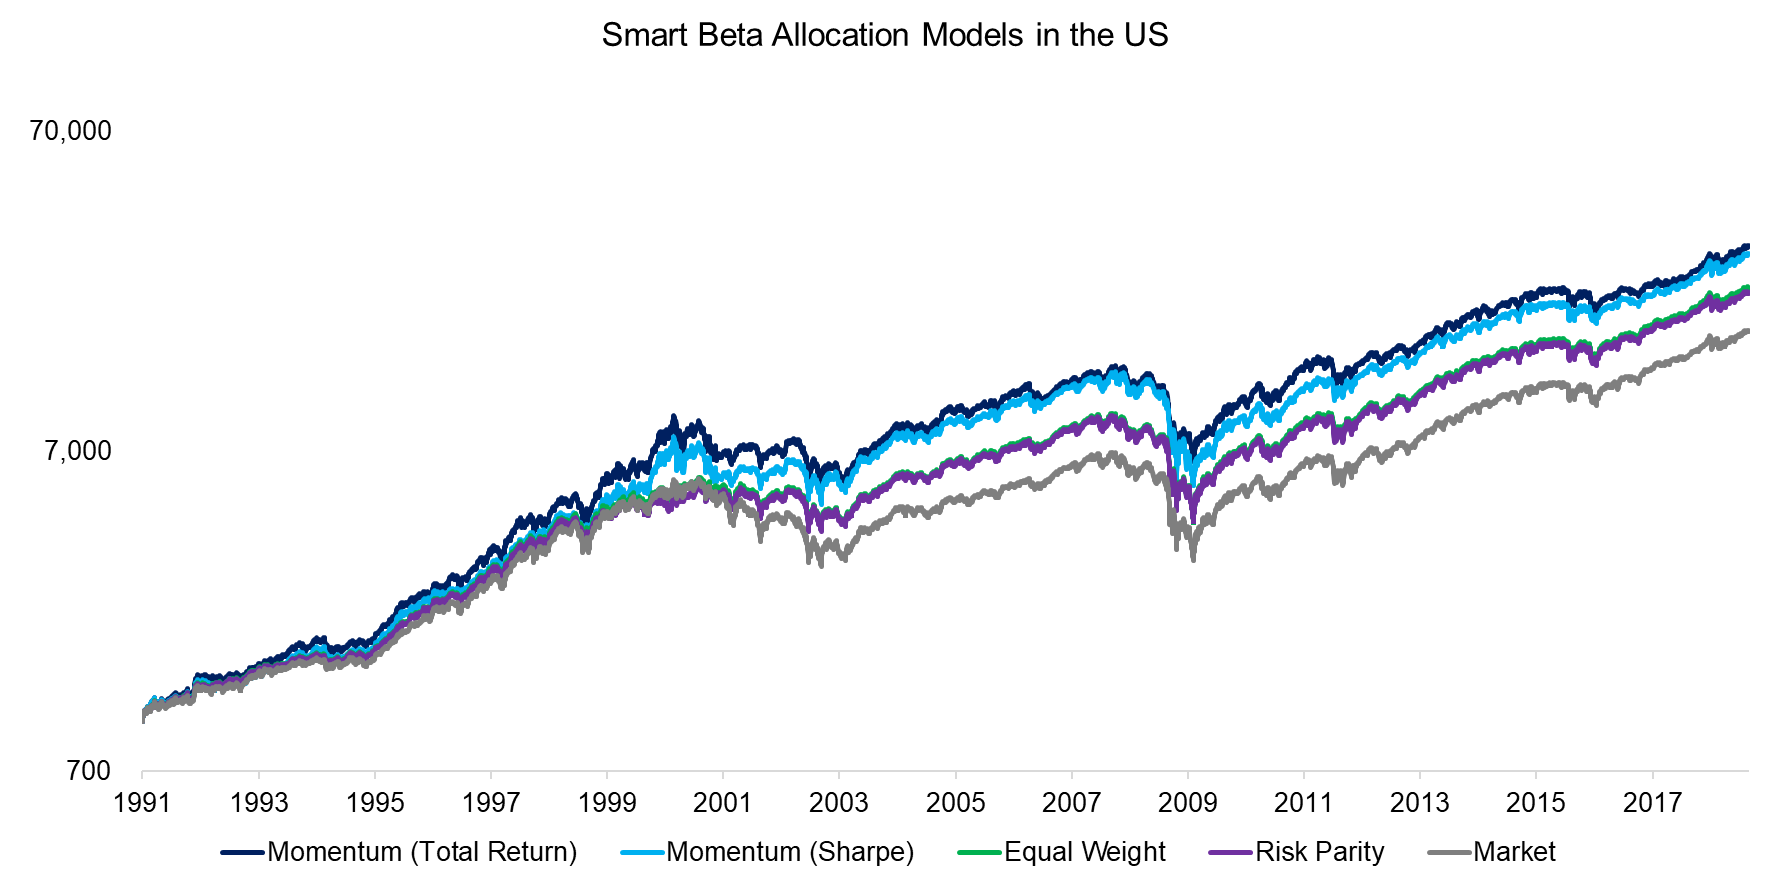
Source: FactorResearch
It is interesting to explore why there is no meaningful difference between the Equal Weight and Risk Parity portfolios. The latter is a well-established framework for allocating across asset classes, which tend to exhibit low or negative correlations and feature distinctive risk characteristics. In contrast, all smart beta strategies represent long-only equity portfolios that are highly correlated and have relatively similar volatility profiles, i.e. the allocations do not differ significantly from equal-weight.
In order to reduce the impact of the starting point, we highlight the returns across different time periods. We observe that there is not one asset allocation model that consistently dominates the others. The two Momentum-focused models show slightly higher returns than the Equal Weight and Risk Parity models, but we would caution on interpreting too much into these results as they are quite sensitive to the observation period, factor universe, and other assumptions.
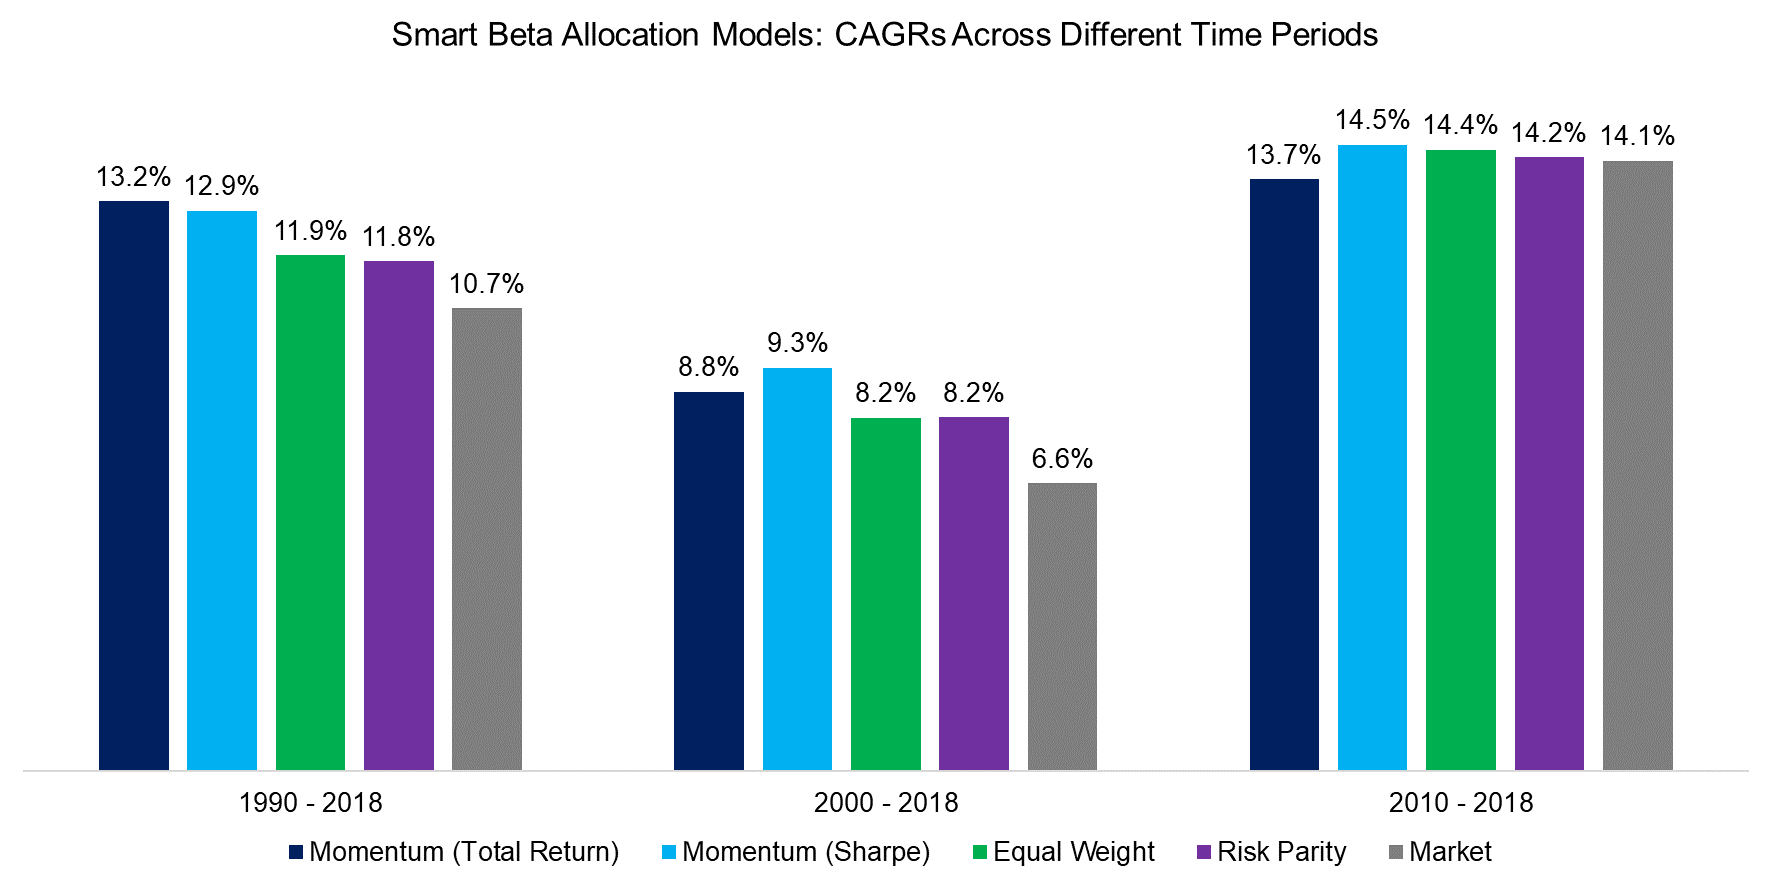
Source: FactorResearch
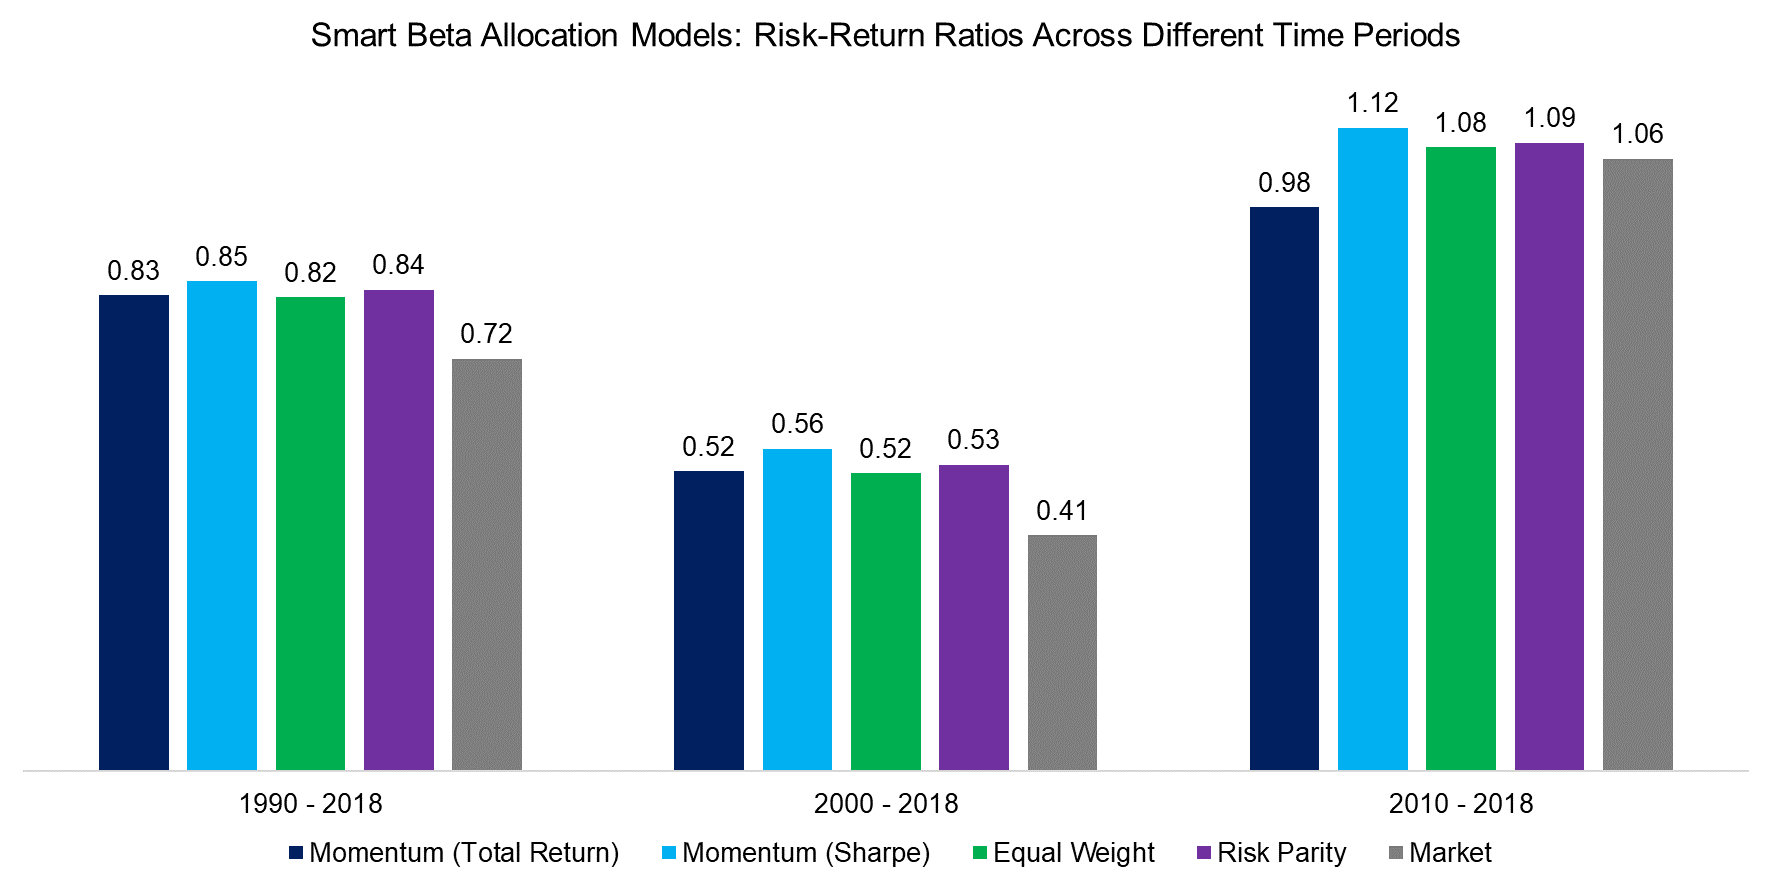
Finally, we shift the perspective to risk-adjusted returns and observe diverse results, which again indicates that there is not one optimal asset allocation model for smart beta. The analysis highlights that smart beta did allow investors to generate higher risk-return ratios than the market, almost regardless of the model utilized.
The models differ in their turnover as the Momentum portfolios rotate in and out of smart beta strategies, depending on which strategy is performing best, while the Equal Weight and Risk Parity portfolios merely increase or decrease allocations.
Source: FactorResearch
FURTHER THOUGHTS
This short research note compares four smart beta asset allocation models in the US stock market that show relatively comparable risk-return ratios, making a choice somewhat challenging. If an investor is agnostic to turnover, which is higher for the Momentum portfolios, then the selection might be based on personal preferences.
It is worth highlighting that the excess returns from smart beta were lower or negative for most smart beta strategies over the last decade, which begs the question if markets have become too efficient for these strategies to generate abnormal returns. We believe there are two arguments to be made, which are conflicting:
- The results before 2000 show excess returns that are too high as our transaction cost assumptions are too low. We assume 10 basis points for the entire period between 1990 and 2018, which is not realistic. However, this argument itself can be partially challenged as some smart beta strategies like Quality feature low annual turnover, where transaction costs do not play a large role.
- Markets naturally have become much more efficient since 1990, but it is difficult to quantify these efficiency increases for factor investing, which mainly features relatively low-turnover strategies. We can measure the valuation spreads of factors, i.e. the difference in valuation multiples of the long and short portfolios. The valuation spread for the Value factor is currently as cheap as in 2000, which does not indicate that the potential for abnormal returns from smart beta has been eroded away.
RELATED RESEARCH
Factor Allocation Models (White Paper)
ABOUT THE AUTHOR
Nicolas Rabener is the CEO & Founder of Finominal, which empowers professional investors with data, technology, and research insights to improve their investment outcomes. Previously he created Jackdaw Capital, an award-winning quantitative hedge fund. Before that Nicolas worked at GIC and Citigroup in London and New York. Nicolas holds a Master of Finance from HHL Leipzig Graduate School of Management, is a CAIA charter holder, and enjoys endurance sports (Ironman & 100km Ultramarathon).
Connect with me on LinkedIn or X.

