Smart Beta ETF vs Customized Factor Portfolios
Reducing the risk of conflicting factor exposures
May 2025. Reading Time: 10 Minutes. Author: Nicolas Rabener.
SUMMARY
- Smart beta ETFs have multiple factor exposures
- Combining these in a portfolio leads to factor offsetting
- Customized stock-based portfolios can reduce such risks
INTRODUCTION
When envisioning the ideal stock portfolio, one might seek stocks that are undervalued yet outperforming, with low volatility. Ideally, these companies would also exhibit strong earnings growth, profitability, and minimal leverage. However, such stocks rarely exist.
In reality, many investment factors are structurally negatively correlated – for example, cheap stocks often lack strong growth prospects. While multi-factor ETFs attempt to screen for these elusive stocks, they often underperform because opposing factor exposures cancel each other out. As a result, investors end up paying high fees for what essentially amounts to broad-market equity exposure (read Factor Exposure Analysis 114: Factor Offsetting).
Rather than spreading focus across too many factors, investors are better off concentrating on one or two. However, even with just two factors, offsetting effects can still arise. As we will demonstrate in this research article, building customized portfolios offers a more effective approach to factor investing than relying on smart beta ETFs.
QUALITY VS LOW VOLATILITY ETFS
Quality and low-volatility stocks are often considered interchangeable when constructing defensive portfolios, but they exhibit distinct characteristics. To illustrate these differences, we conducted a returns-based factor exposure analysis on two of the largest ETFs in their respective categories: the iShares MSCI USA Quality ETF (QUAL) and the Invesco S&P 500 Low Volatility ETF (SPLV).
Our analysis confirms that QUAL, as expected, has a positive beta to the quality factor. However, SPLV surprisingly shows a negative beta to the quality factor, highlighting the fundamental differences between these two investment styles.
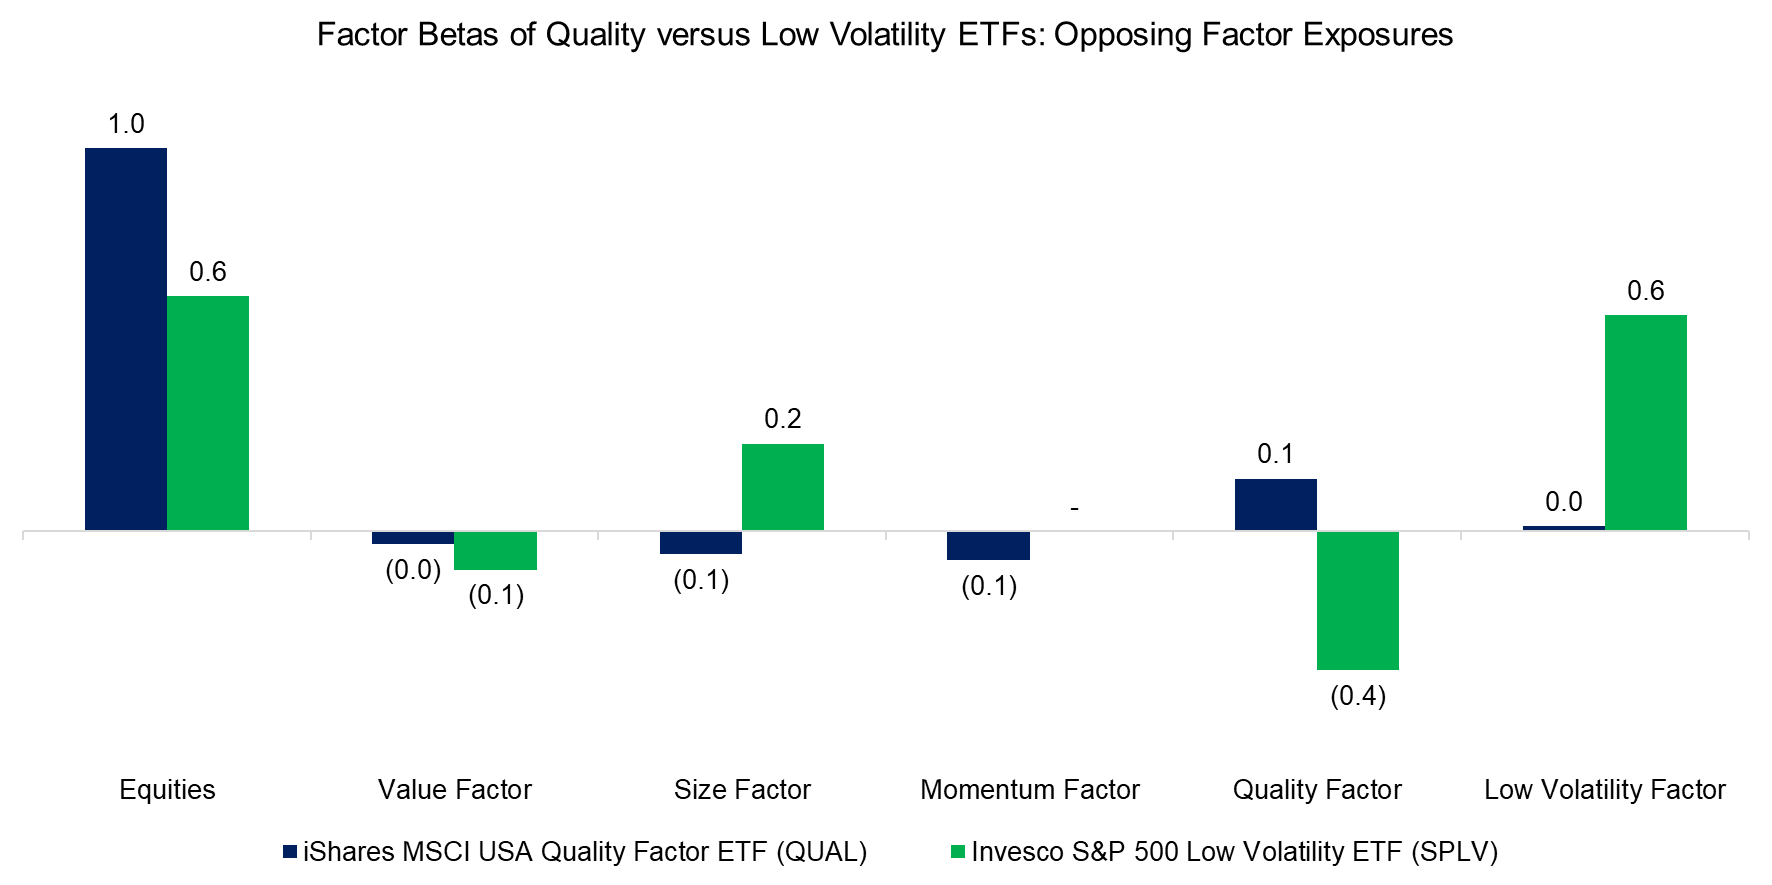
Source: Finominal
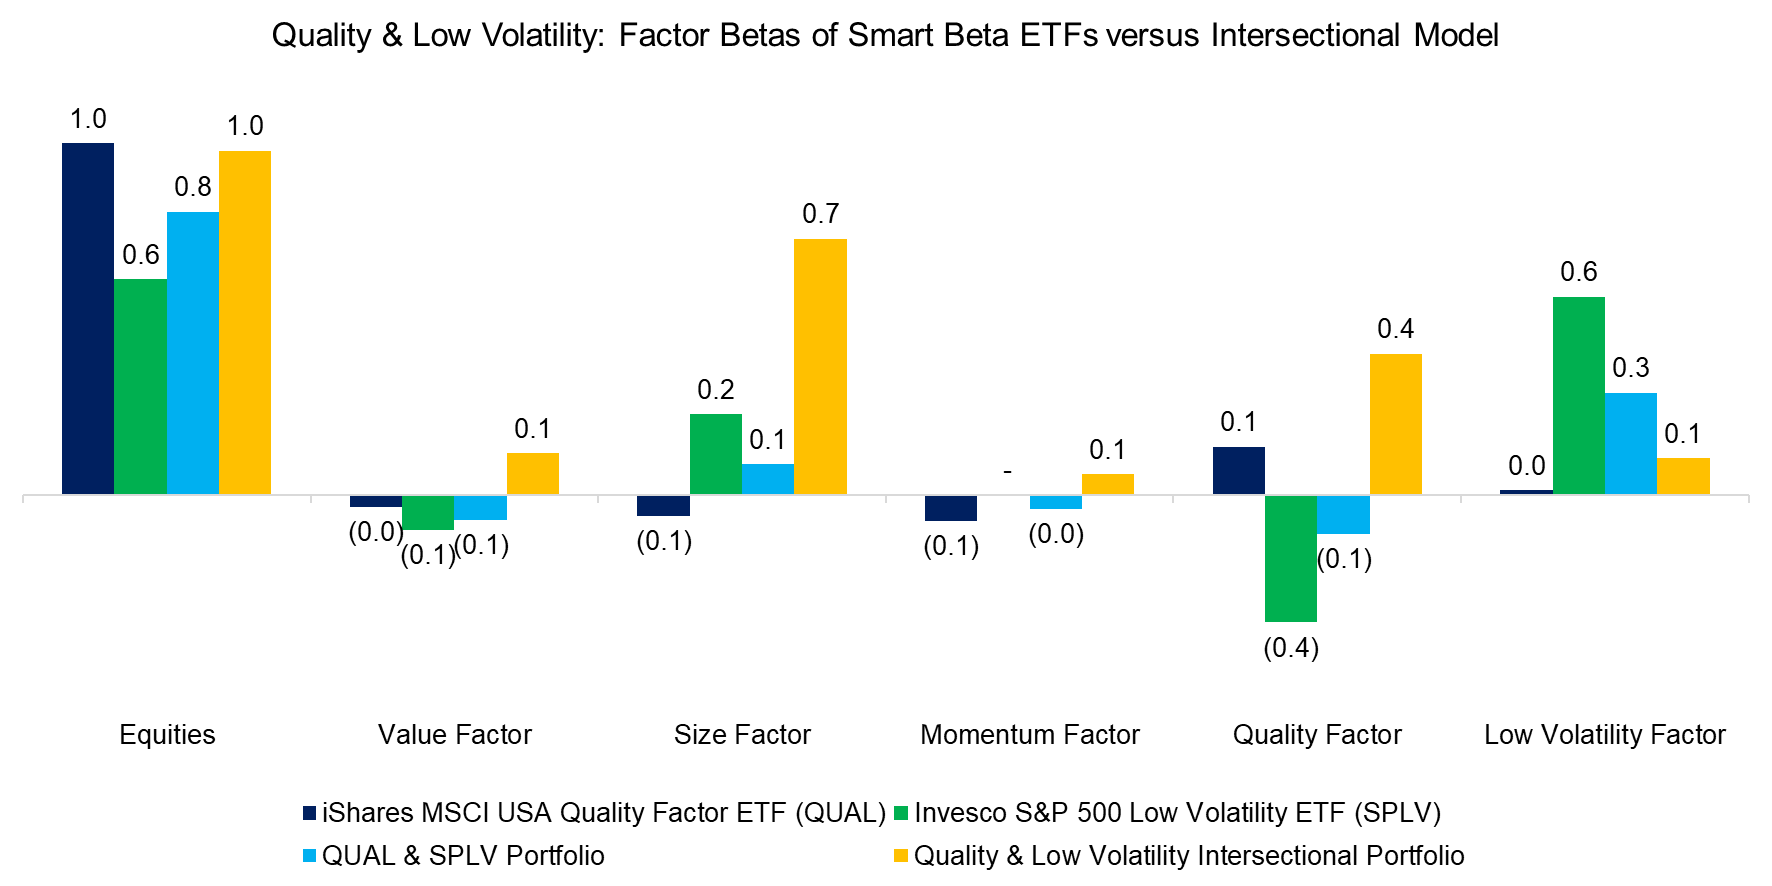
If investors construct an equal-weighted portfolio of QUAL and SPLV, factor netting occurs, leading to negative exposure to the quality factor – when the intended outcome is a positive exposure.
Rather than relying on smart beta ETFs, investors can build a customized portfolio by selecting stocks that score highly on both quality and low volatility using an intersectional model (read Multi-Factor Models 101). In this approach, we screen all U.S. stocks with market capitalizations above $1 billion and select the top 30% based on their combined factor rankings. This results in a well-diversified portfolio of approximately 600 equally weighted stocks.
Our analysis shows that this customized portfolio successfully achieves positive betas to both the quality and low-volatility factors. However, it also exhibits some unintended exposures, such as to the size factor, which can be further refined through optimization techniques, or simply by switching from equal to market cap-weighting stocks.
Source: Finominal
VALUE VS GROWTH FACTOR
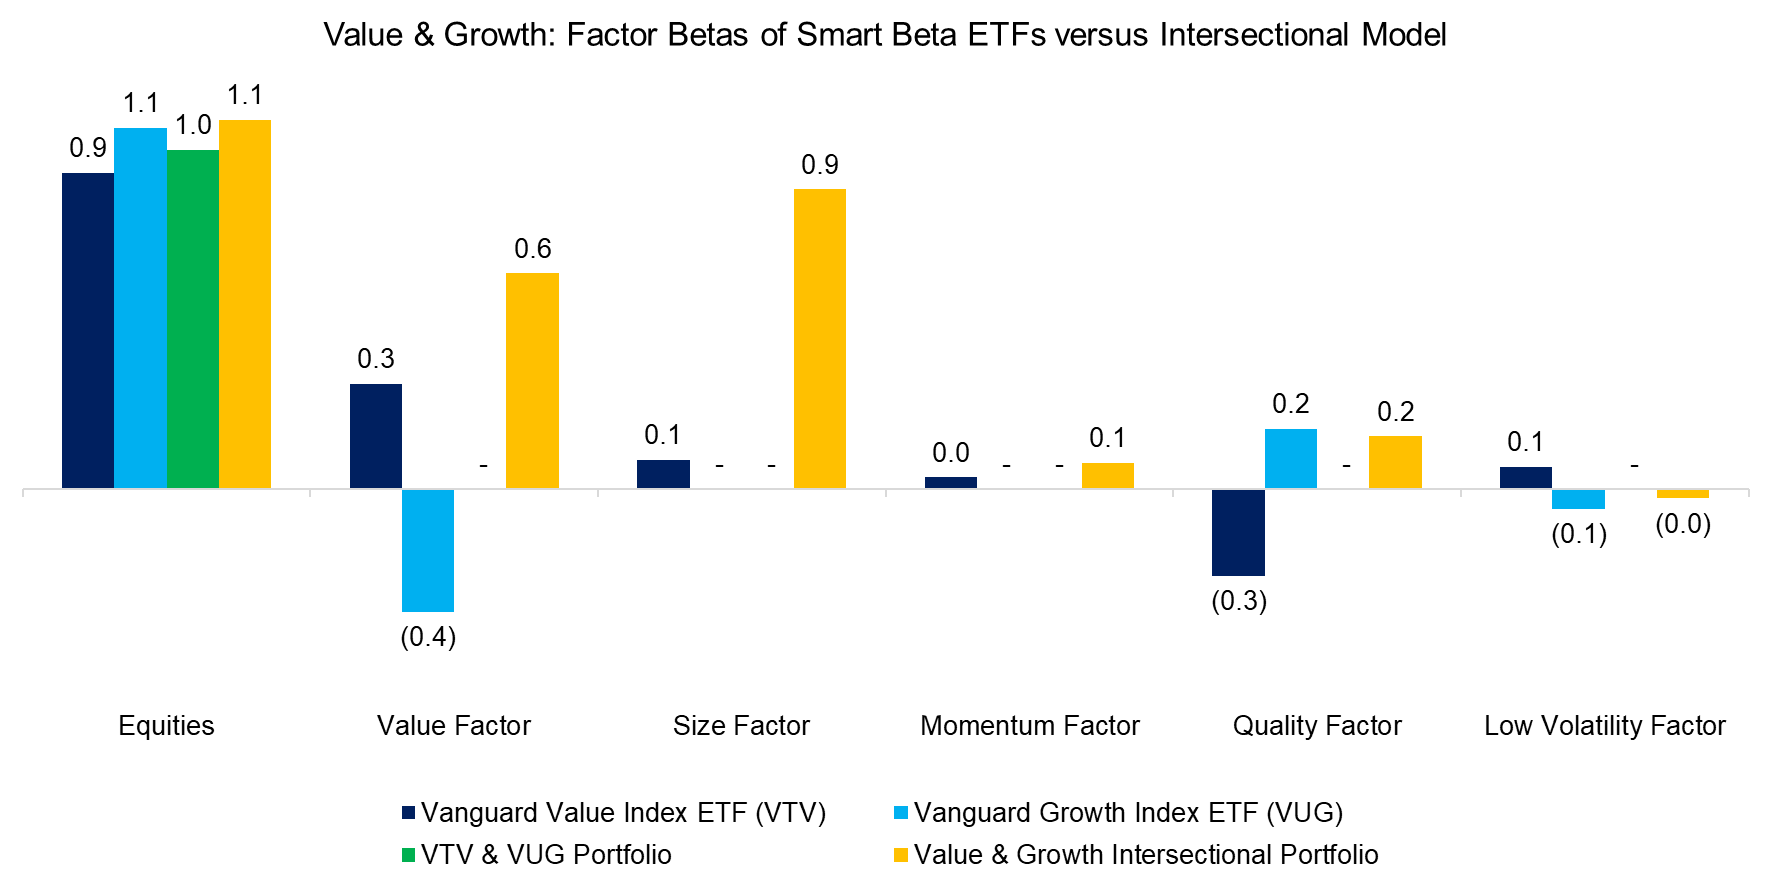
Next, we extend our analysis to the two largest smart beta funds – the Vanguard Value Index ETF (VTV) and the Vanguard Growth Index ETF (VUG) – which collectively manage approximately $250 billion in assets. Our factor exposure analysis reveals that these ETFs have opposing betas to value, quality, and low volatility.
In other words, combining VTV and VUG in a portfolio cancels out their factor exposures, resulting in zero net exposure to the value factor. This demonstrates why these two funds should not be held together in a portfolio.
By contrast, constructing a customized portfolio using the intersectional model preserves positive exposure to both value and quality, while also maintaining alignment with the growth factor, which is positively correlated with quality.
Source: Finominal
PERFORMANCE ANALYSIS
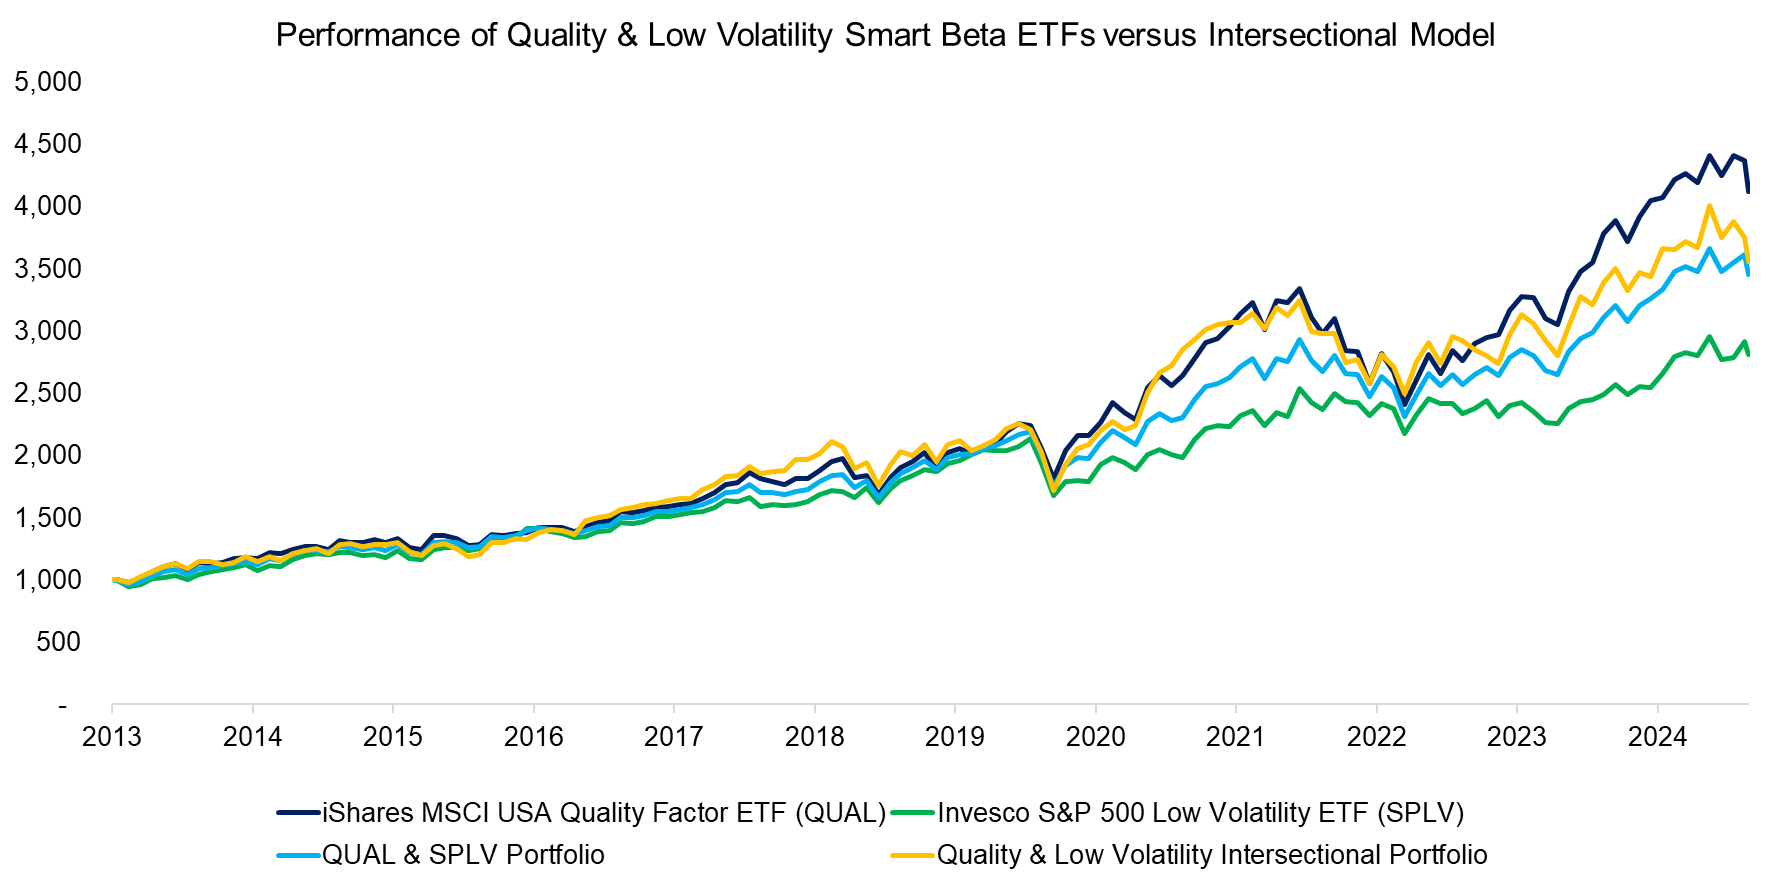
Building a customized quality and low-volatility portfolio using the intersectional model does not compromise performance. In fact, our analysis shows that the customized portfolio has outperformed the smart beta combination portfolio.
Source: Finominal
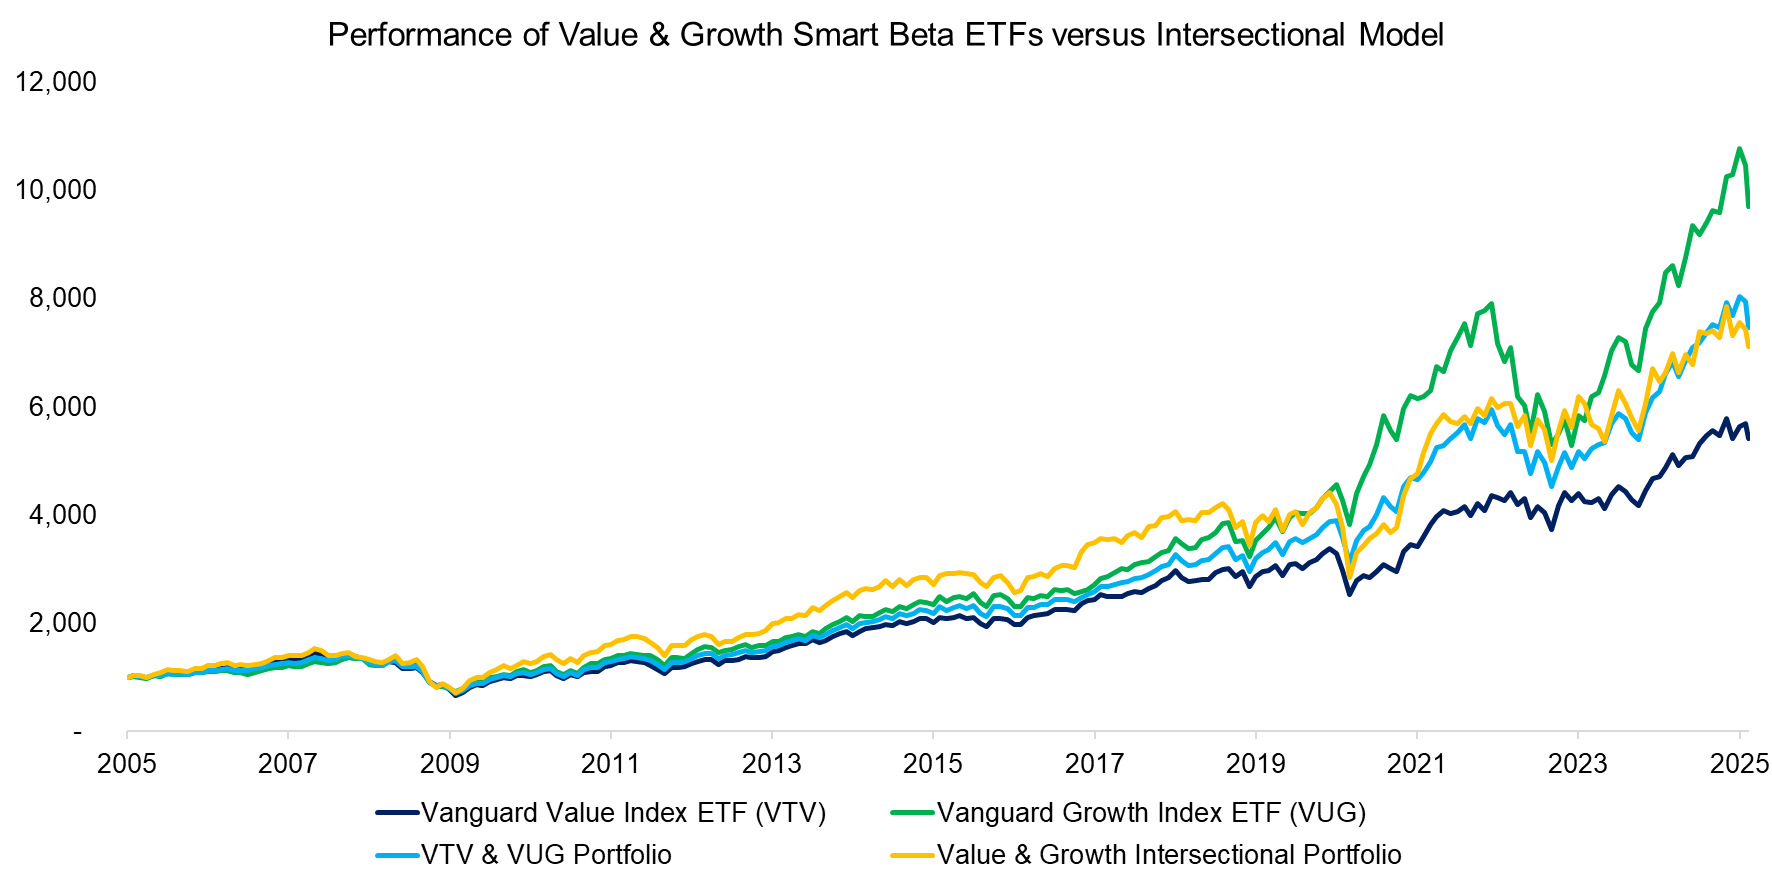
Our analysis also reveals that the customized portfolio, consisting of cheap growth stocks, has consistently outperformed the smart beta portfolio over the past 20 years. While one might expect its returns to fall between those of VTV and VUG, it actually delivered significant outperformance between 2009 and 2020. This approach aligns closely with the growth-at-a-reasonable-price (GARP) strategy.
Source: Finominal
FURTHER THOUGHTS
Most of the factor investing literature, including many of our research articles, highlights the benefits of diversifying across factors, as single-factor performance tends to be highly cyclical. However, as we explore in this post, the structural negative correlations between many factors can lead to factor netting, which becomes particularly acute when portfolios are constructed using smart beta ETFs.
One way to address factor netting is by creating customized factor-focused portfolios. Another approach is dynamically allocating across factors. The goal is not to time factors – an endeavor as challenging as market timing – but rather to minimize drawdowns of individual factors through effective risk management.
RELATED RESEARCH
Quality versus Low Volatility ETFs
Multi-Factor Models 101
Integrated Value, Growth & Quality Portfolios
Factor Exposure Analysis 114: Factor Offsetting
Factor Exposure Analysis 113: Profitability vs Leverage Factors
Factor Exposure Analysis 112: Quality vs Growth Factors
Factor Exposure Analysis 111: What is Alpha?
Factor Exposure Analysis 110: Long-Short vs Long-Only Factors
Factor Exposure Analysis 109: Linear vs Lasso vs Elastic Net
Factor Exposure Analysis 108: Fixed Income Factors II
Factor Exposure Analysis 107: Fixed Income Factors
Factor Exposure Analysis 106: Macro Variables
Factor Exposure Analysis 105: Sectors versus Factors
Factor Exposure Analysis 104: Fixed Income ETFs
Factor Exposure Analysis 103: Exploring Residualization
Factor Exposure Analysis 102: More or Less Independent Variables?
Factor Exposure Analysis 101: Linear vs Lasso Regression
Factor Exposure Analysis 100: Holdings vs Regression-Based
ABOUT THE AUTHOR
Nicolas Rabener is the CEO & Founder of Finominal, which empowers professional investors with data, technology, and research insights to improve their investment outcomes. Previously he created Jackdaw Capital, an award-winning quantitative hedge fund. Before that Nicolas worked at GIC and Citigroup in London and New York. Nicolas holds a Master of Finance from HHL Leipzig Graduate School of Management, is a CAIA charter holder, and enjoys endurance sports (Ironman & 100km Ultramarathon).
Connect with me on LinkedIn or X.

