Smart Beta vs Alpha + Beta
Simplifying Equity Portfolios
September 2019. Reading Time: 10 Minutes. Author: Nicolas Rabener.
SUMMARY
- Investment portfolios can be simplified by separating alpha from beta
- Alpha + beta portfolios offer higher risk-adjusted returns than smart beta
- The main hurdle for better portfolios is investor behaviour, not a lack of products
INTRODUCTION
In Buddhist teaching, the primary obstacles that prevent us from ascending to a higher state are ignorance, greed, and anger. This trio of poisons not only keeps us from evolving as people but also as investors.
Most investors still believe we can outperform the market through our stock-picking skills. We remain in this state of ignorance despite ample and available evidence. We also tend to be greedy and to chase performance when selecting securities. And our investment decisions, which should be made as dispassionately as possible, are often influenced by our emotions, anger among them.
This is not a recipe for success.
Just as meditation can focus and clarify the mind, simplification can do the same for most investment portfolios. A single ETF representing the whole stock market could satisfy the equity allocation of a balanced portfolio. If outperformance is a mandate requirement, then factor investing, among other systematic and research-backed strategies, could be among our options.
But factor investing has its own complexities. Since the financial crisis, a wave of single- and multi-factor smart beta products have become available. Yet these are neither fish nor fowl, just long-only index products with factor tilts (read Multi-Factor Smart Beta ETFs).
More recently, mutual funds and ETFs have been launched that give investors direct access to the long-short multi-factor portfolios described in factor investing’s foundational literature. These are the real thing.
So can we create a simple and clean equity portfolio by separating alpha from beta? And what can we do about the innate human weaknesses that sabotage our investment decisions?
FACTOR INVESTING IN THE US STOCK MARKET
While research shows stock-picking is mostly a losing game, over time, factor investing has generated positive excess returns.
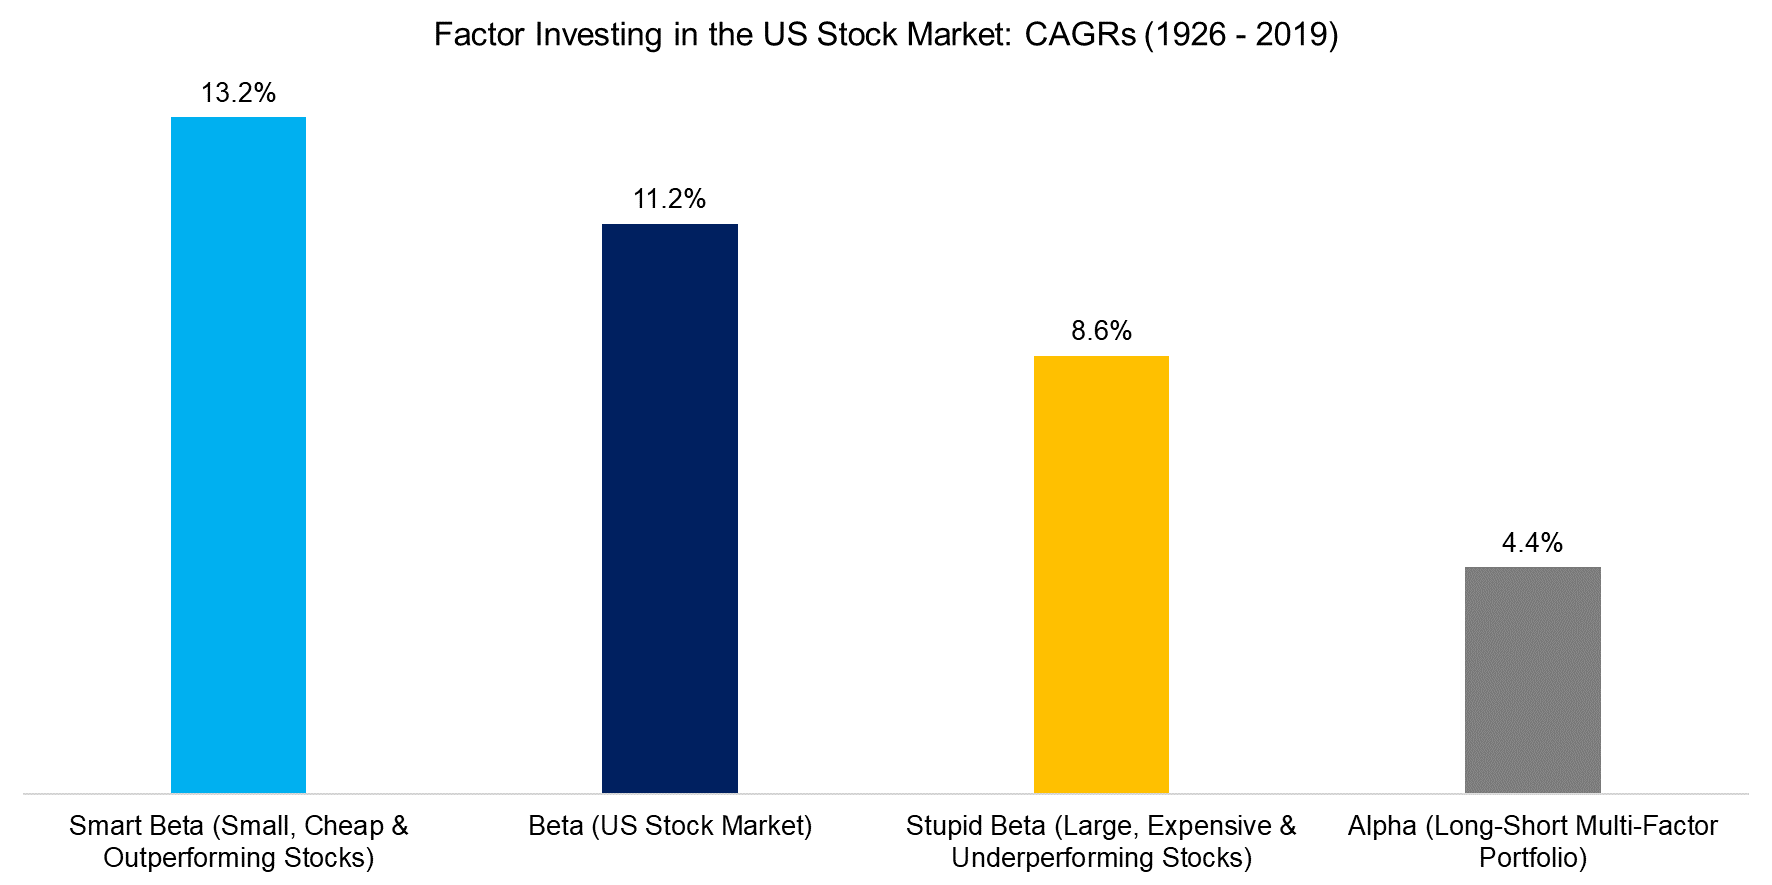
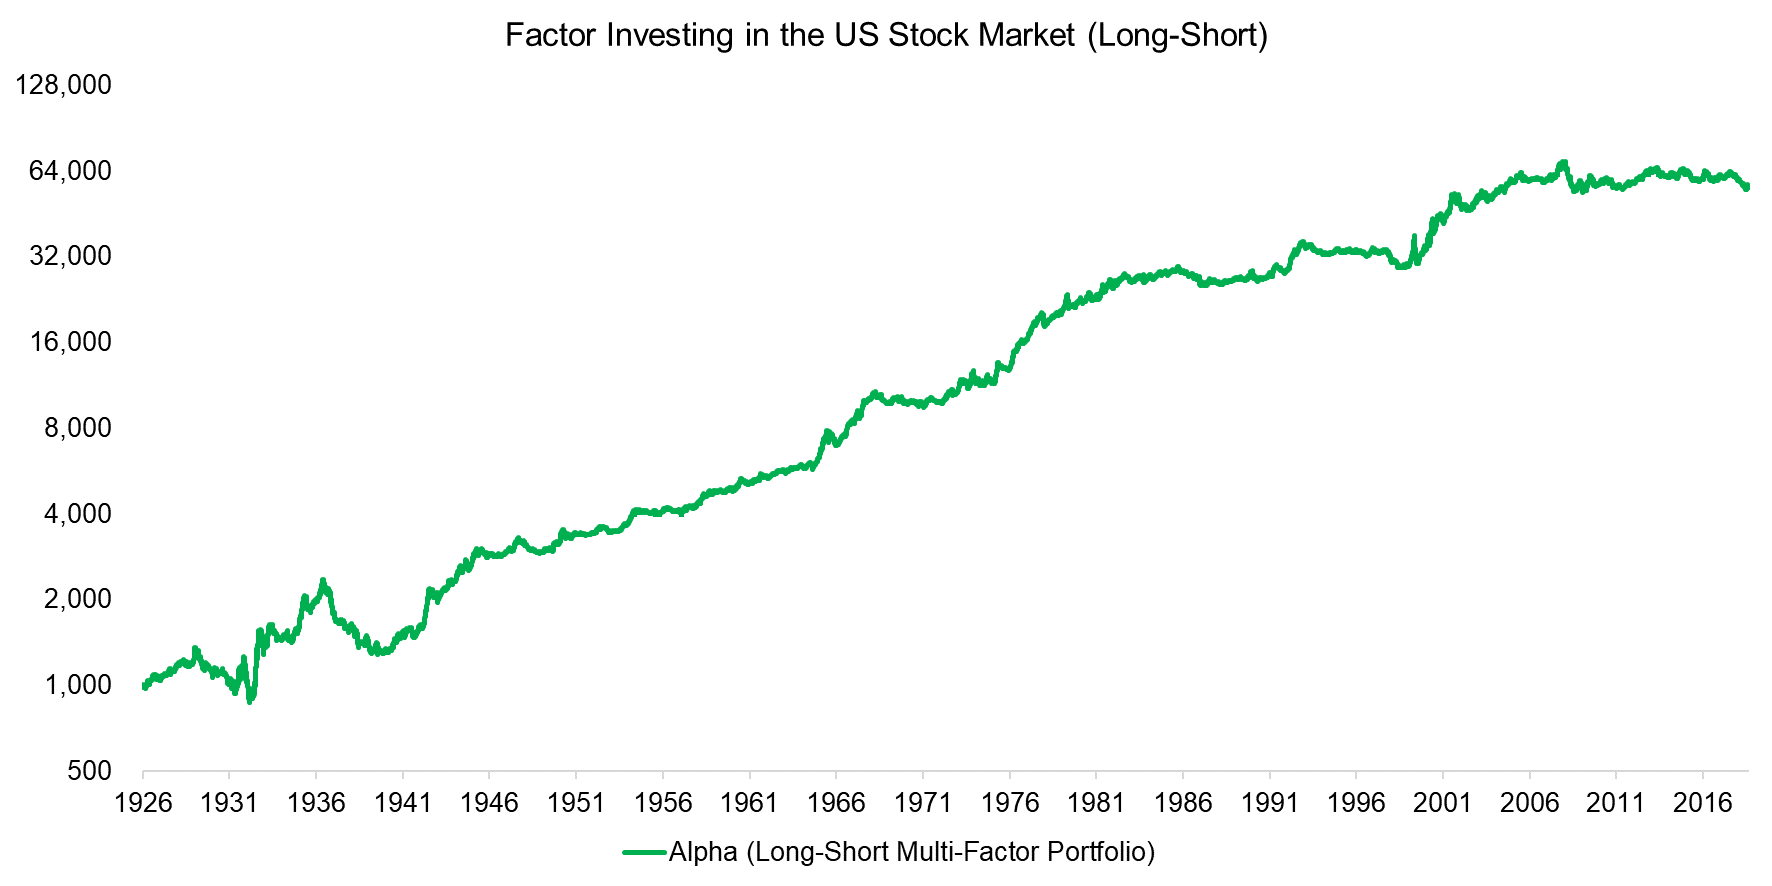
A portfolio that combines small, cheap, and outperforming stocks is a classic factor strategy. Such a portfolio would have dramatically outpaced the US stock market from 1926 to 2019, according to data from the Kenneth R. French Data Library. Betting on large, expensive, and underperforming stocks, however, would not have ended so well.
We can build the difference between these two strategies through a long-short portfolio with exposures to the Size, Value, and Momentum factors.
Source: Kenneth R. French Data Library, FactorResearch
Though we describe returns from this portfolio as “alpha,” this is not quite correct since the term technically refers to unexplained excess returns. In this case, however, we understand the source of the returns. We might better describe these as “alternative beta returns,” but this could obscure as much as it reveals. So for simplicity’s sake, we’ll use “alpha” to refer to the excess returns of factors.
RISKINESS OF SMART BETA
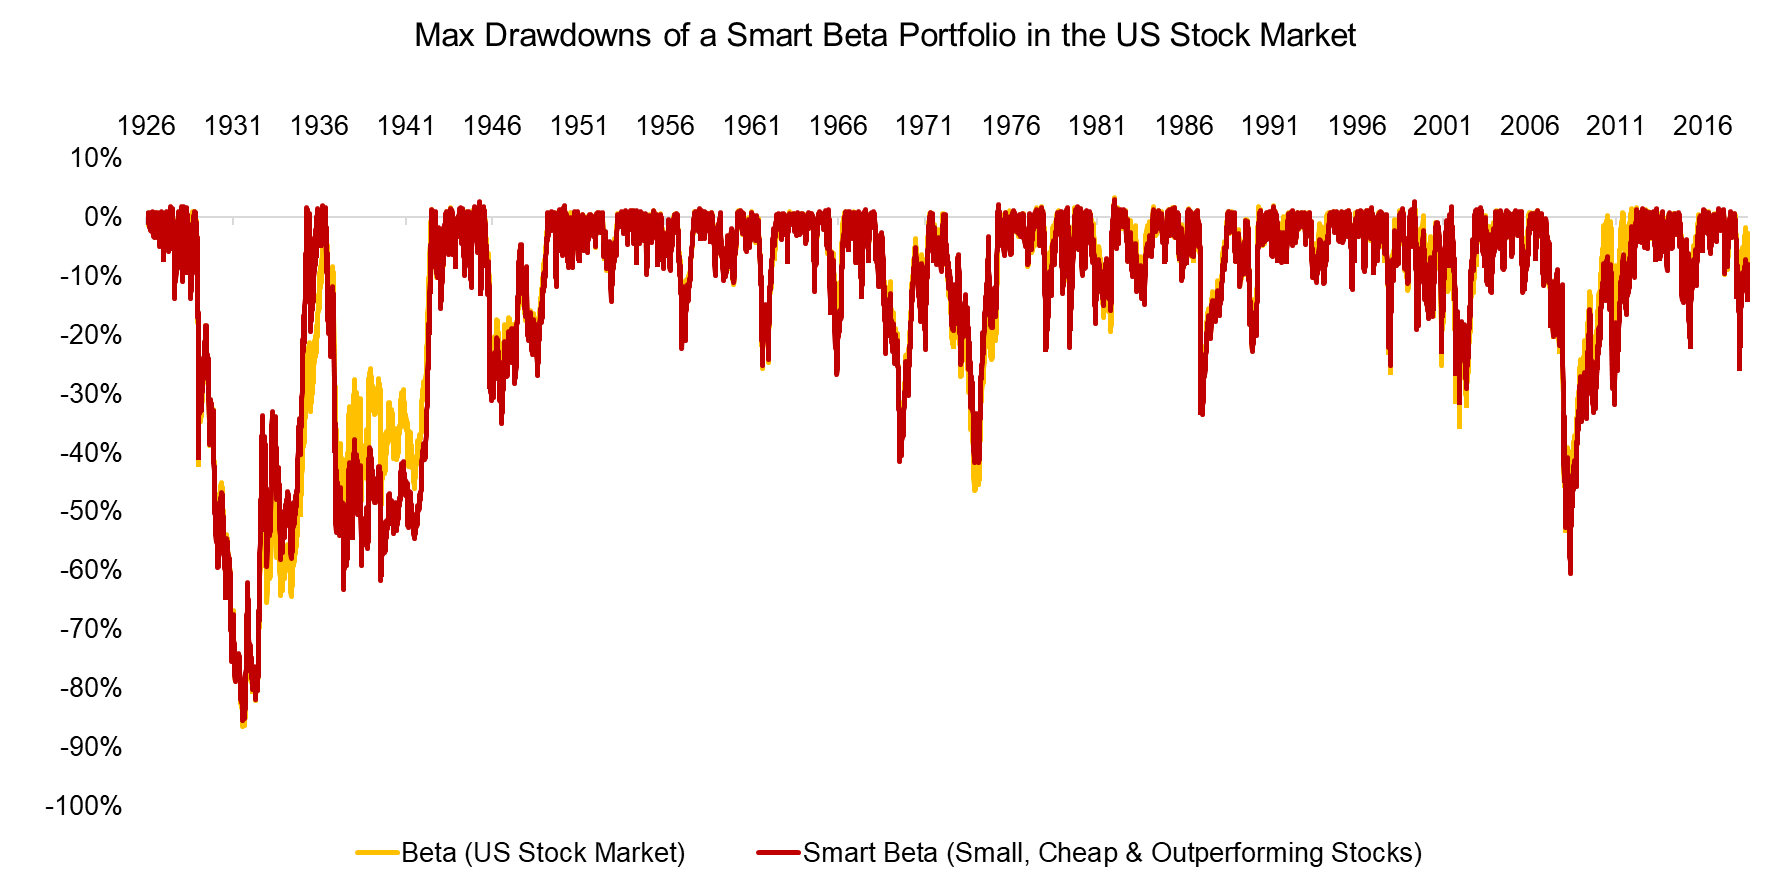
Based on historical returns, a smart beta portfolio outperformed the US stock market from 1926 to 2019. But both often generated drawdowns greater than 30%, which would have made them hard to hold onto over the long term (read Smart Beta & Factor Correlations to the S&P 500).
Conceptually, most investors are fine with drawdowns. They are to be expected. But the evidence shows we struggle when our losses mount. We tend to reduce our exposure at or near market bottoms, which leaves us underinvested when the markets recover.
We could improve our smart beta portfolio by including exposure to Quality and Low Volatility stocks, which are thought to offer downside protection. Although this might have led to slightly smaller drawdowns, it would still have been long-only and highly correlated with the stock market. After all, smart beta is still beta. Emotionally there is little difference between a drawdown of 18% or 20%.
Source: Kenneth R. French Data Library, FactorResearch
SMART BETA VS ALPHA + BETA
Instead of structuring an equity portfolio as smart beta by selecting stocks ranked by factors, we could allocate to a combination of the stock market and a long-short multi-factor portfolio. We could build an alpha + beta strategy through ETFs or liquid alternative mutual funds. The costs for beta like the S&P 500 are almost zero and long-short multi-factor ETFs are priced well below 1%, which results in total costs comparable to those of smart beta ETFs.
So what are the key advantages of alpha + beta over smart beta?
- A smart beta portfolio lacks clarity and requires continuous performance attribution analysis to differentiate between beta and factor returns. An alpha + beta portfolio makes it easier to identify if outperformance is being achieved.
- There is a significant difference between smart beta and factor investing in portfolio construction. Allocating to a long-short multi-factor portfolio results in returns more in line with those in factor investing’s foundational academic research.
- Smart beta ETFs have stock market correlations greater than 0.9. By contrast, a long-short multi-factor portfolio has zero correlation to beta. So alpha could be a partial substitute for bonds in a balanced portfolio. In a low interest-rate environment, this is an intriguing point. And the alpha’s portfolio weight could be tailored to the investor’s risk preferences: The more risk-averse, the less beta exposure.
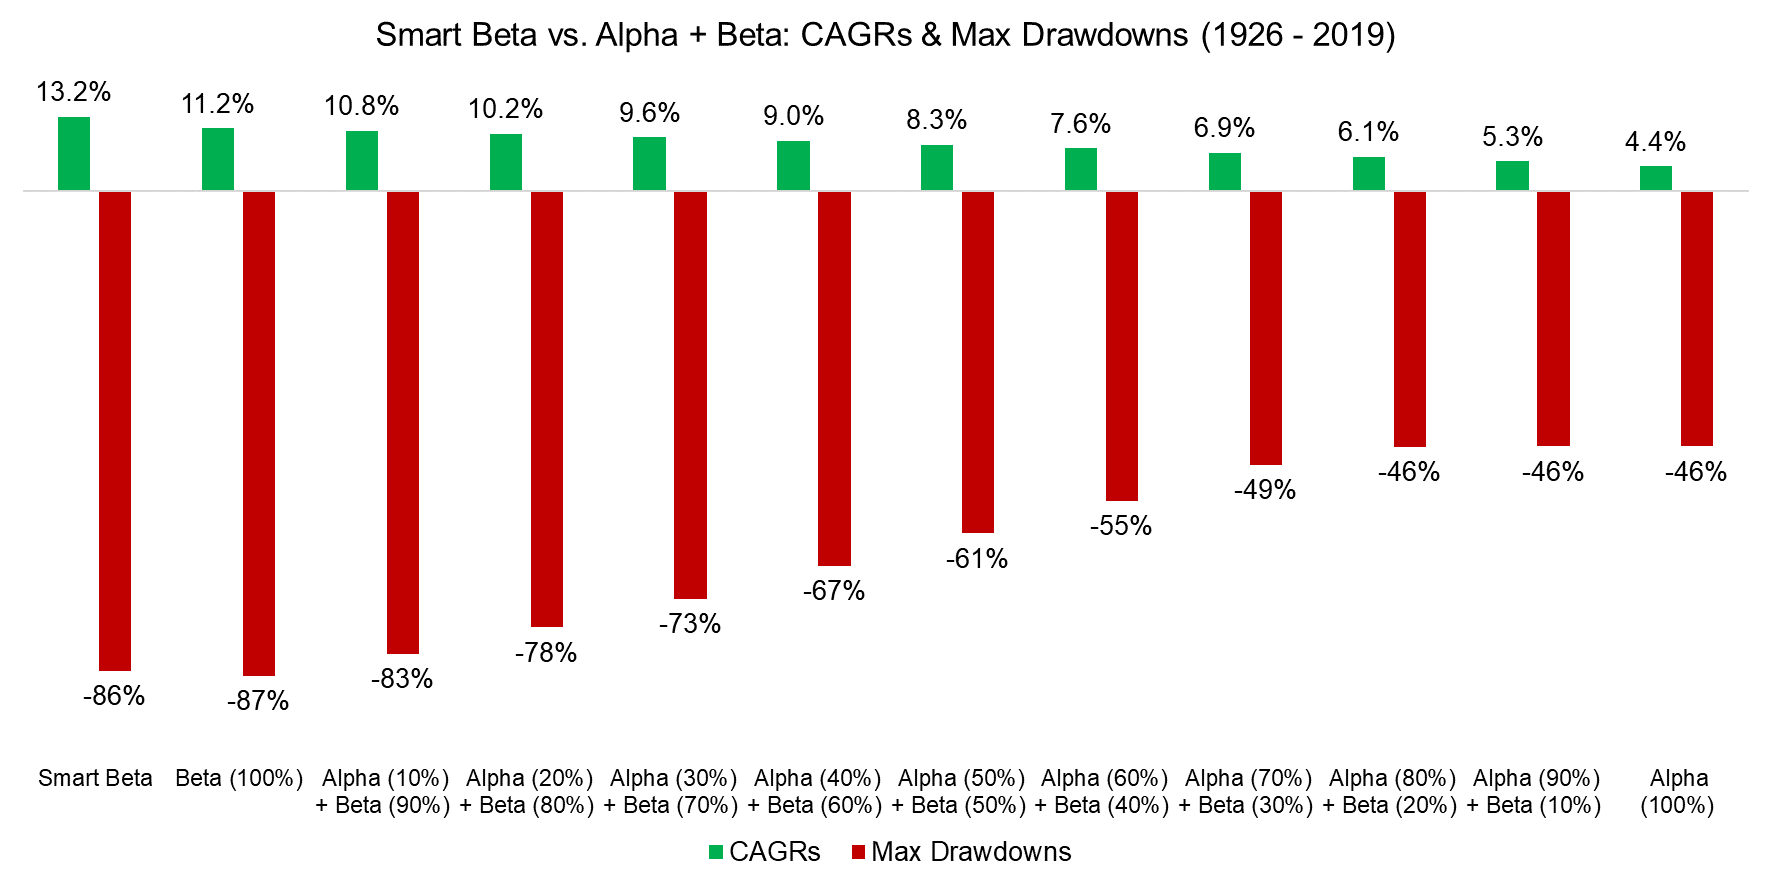
We created a range of alpha + beta portfolios with exposure to the US stock market and to a long-short multi-factor portfolio with exposure to the Size, Value, and Momentum factors. Though we don’t include transaction costs, the portfolios are rebalanced annually to minimize them.
The smart beta portfolio has generated the highest CAGR, followed by the market (beta), and then the various alpha + beta combinations. This reflects in part the power of compounding returns in a steadily rising stock market.
Whatever the benefits of compounding are in hindsight, investors would have had to stick with the smart beta portfolio. Amid maximum drawdowns of over 80%, that would have been challenging. The alpha + beta portfolios avoided such dramatic declines. Theoretically, investors want to maximize returns, but in reality we need a smooth ride to stay invested.
Source: FactorResearch
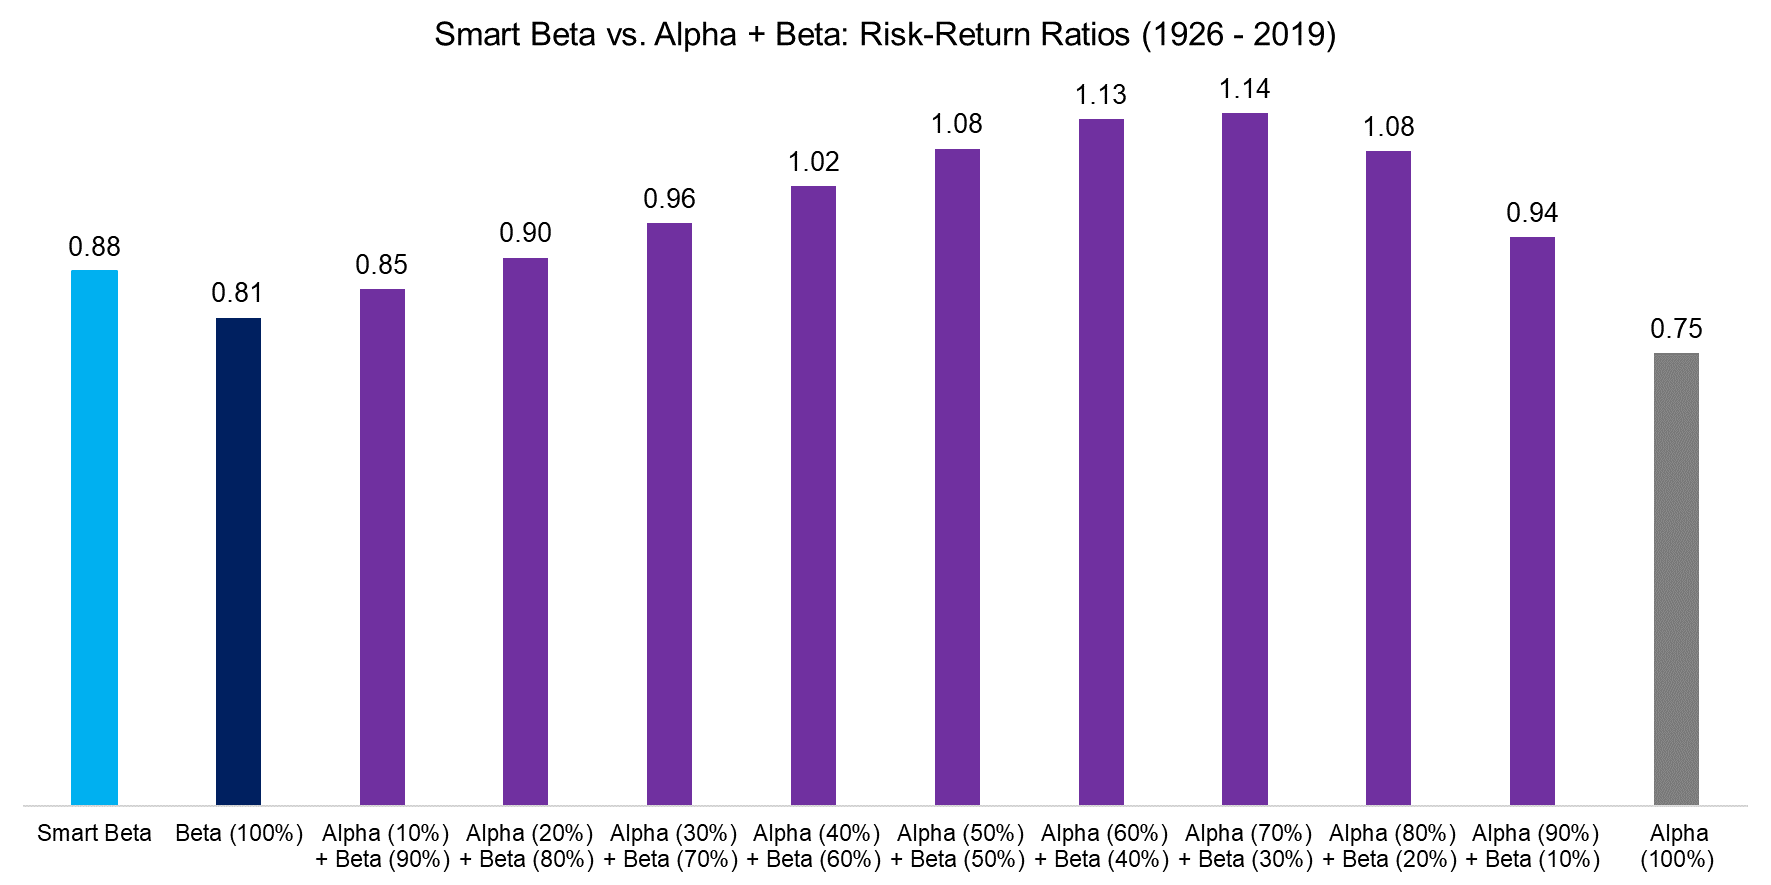
Shifting the focus to risk-adjusted returns, we can calculate risk-return ratios. These were higher for almost every alpha + beta portfolio compared to smart beta or plain beta. The correlation between beta and alpha returns is close to zero, which generated significant diversification benefits.
Those concerned about lower CAGRs from alpha + beta portfolios could apply more leverage given the higher risk-adjusted returns relative to smart beta or beta, although this would naturally increase cost and complexity.
Source: FactorResearch
FACTOR INVESTING IN MORE CHALLENGING TIMES
Factor investing has yielded attractive returns over the long term. But a long-short multi-factor portfolio with exposure to Size, Value, and Momentum in the US stock market has disappointed over the last decade. The annual excess return was 4.4% from 1926 to 2019, but -0.9% from 2009 to 2019. While other factors like Low Volatility did well over the same period, factor investors might have entertained some doubts or been tempted to cut their losses.
Source: FactorResearch
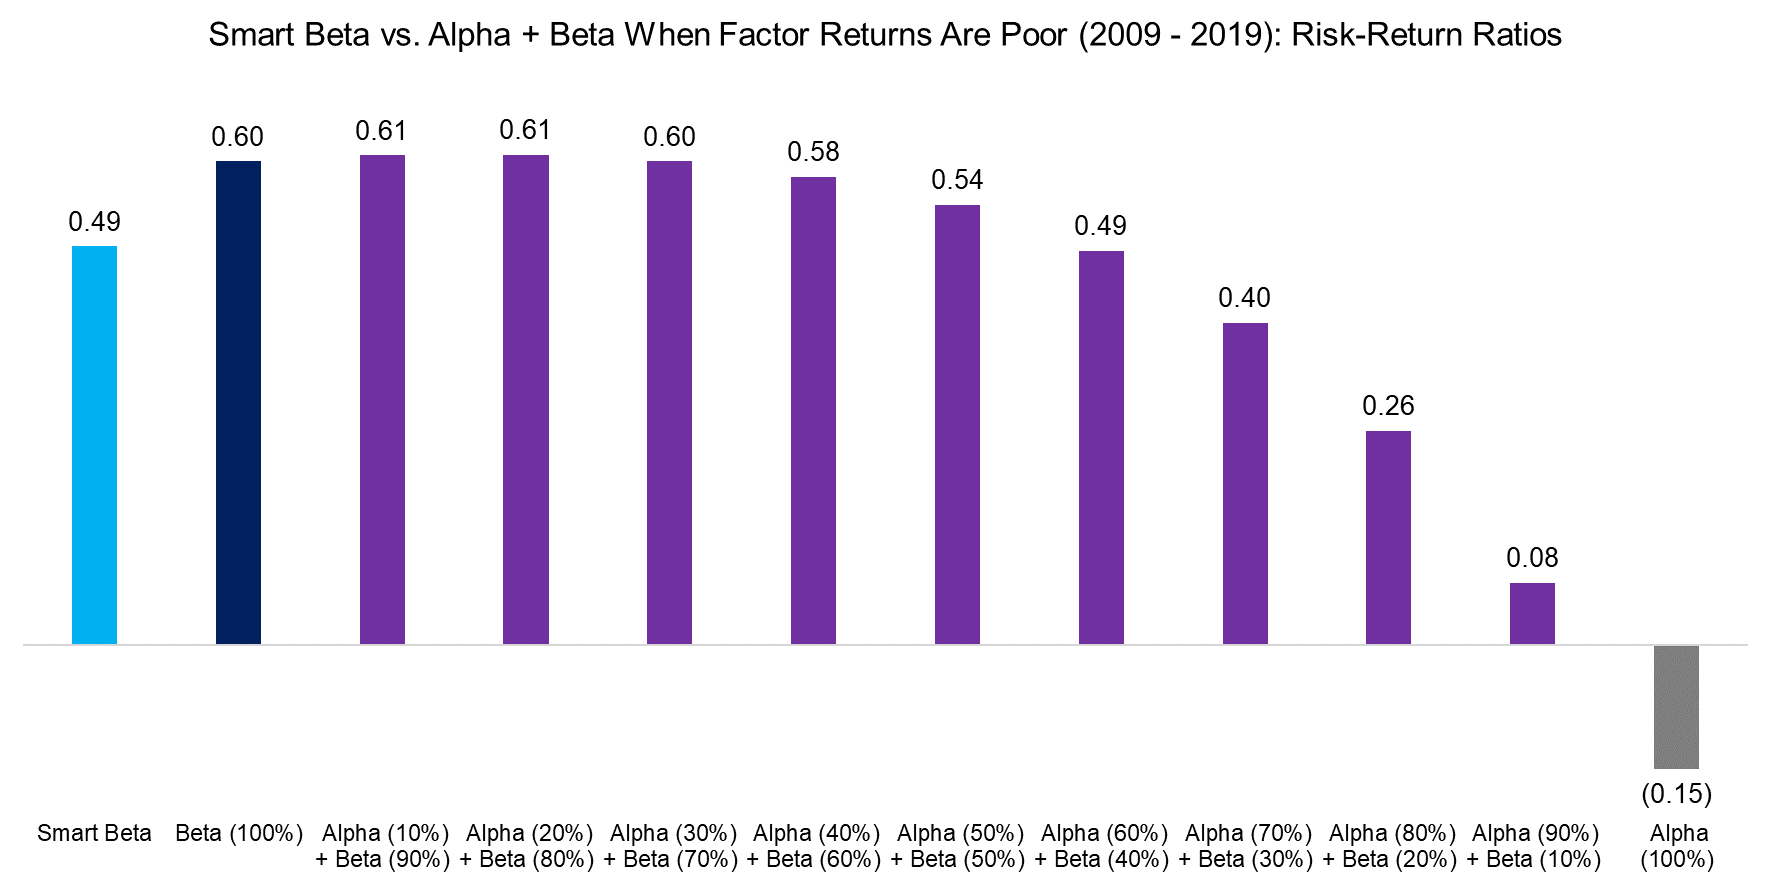
So how have the alpha + beta portfolios held up during factor investing’s lost decade? Adding a minor alpha allocation to a beta portfolio still increased risk-adjusted returns, despite the negative alpha, thanks to the diversification benefits. By comparison, smart beta’s risk-return ratio was lower than the markets.
Source: FactorResearch
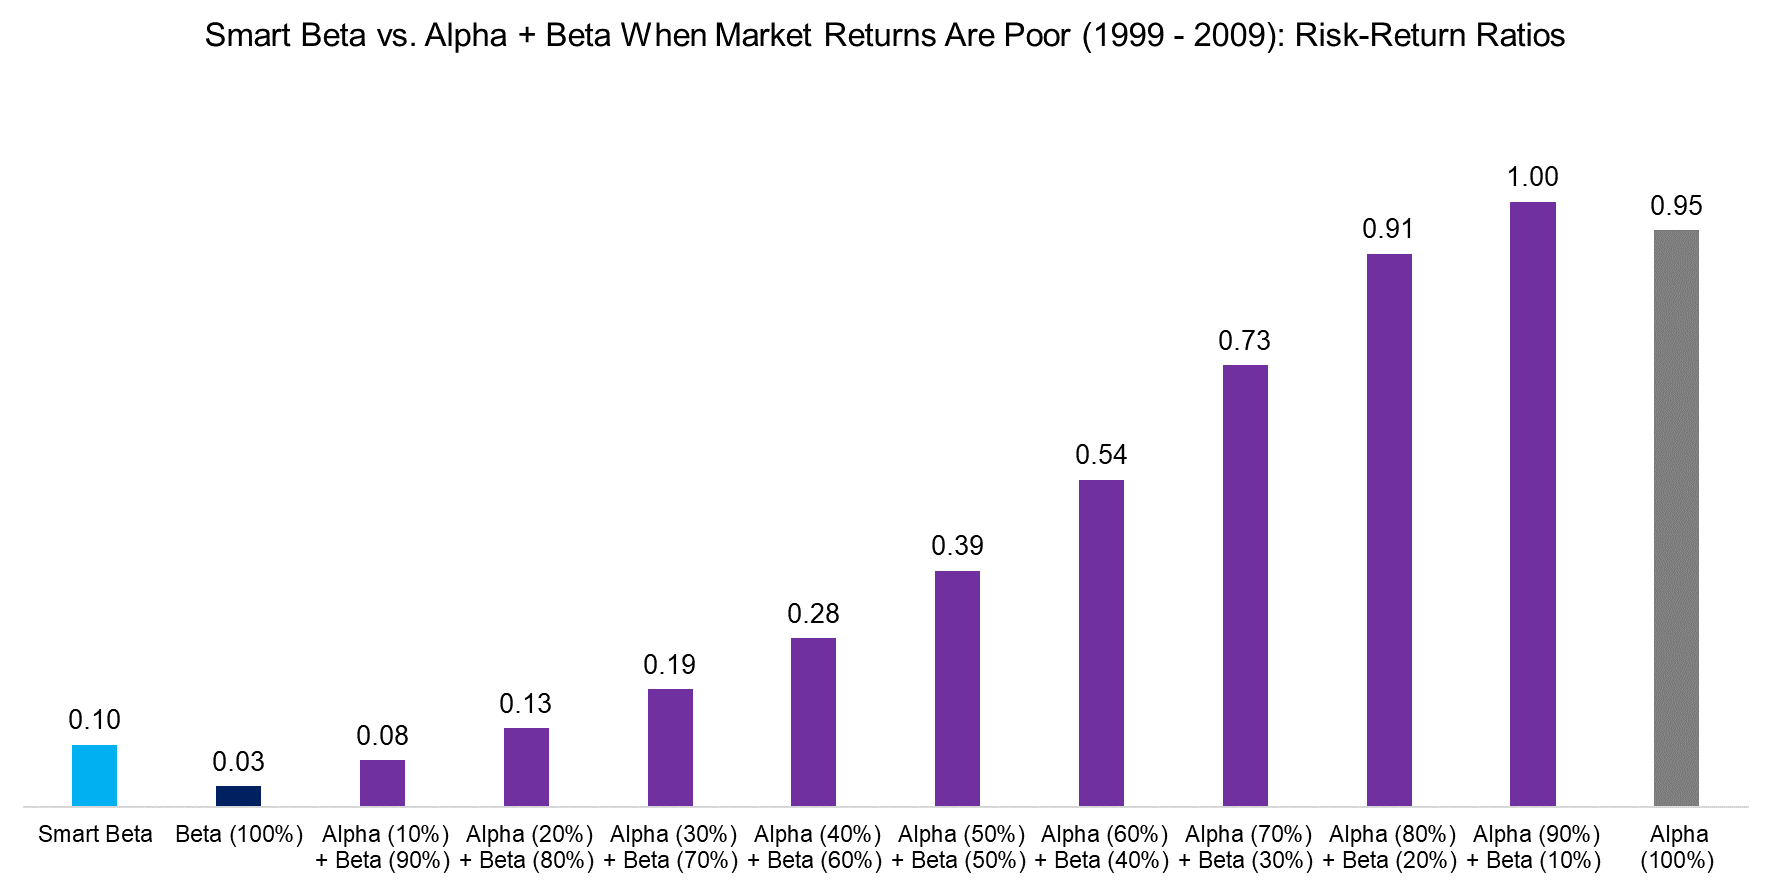
Given our focus on factor investing’s dark decade, for comparison’s sake, we examined periods of poor stock market returns. Equity markets were flat in the 1940s and 1970s, and recent bear markets have been relatively short. But between the tech bubble in 1999 and the global financial crisis in 2009, stock market returns were almost zero.
But factor returns were positive: Smart beta generated stronger risk-adjusted returns than beta. But the alpha + beta portfolios produced even higher risk-return ratios, even with only minor allocations to the long-short multi-factor portfolio. This is diversification at its best.
Source: FactorResearch
FURTHER THOUGHTS
Buddhism teaches that the three poisons have their antidotes: generosity, compassion, and wisdom or non-delusion. These can help us on the path to achieving enlightenment. For investors, the last of the three is especially helpful.
Factor investing’s adherents have volumes of academic research to support their approach. Plenty of products provide direct exposure to long-short factors with transparent methodologies, daily liquidity, and low fees. Through them, investors can build simple and clean equity portfolios comprised of beta and alpha that should deliver superior risk-adjusted returns.
Yet factor products have underperformed over the last couple of years. It turns out, factor investing has some cyclicality.
The lesson is a simple one: No strategy works all the time. And while this truth might be painful to relearn, acknowledging it can also help clarify the mind. And that can hopefully lead to wisdom.
RELATED RESEARCH
How Painful Can Factor Investing Get?
A Horse Race of Liquid Alternatives
REFERENCED RESEARCH
S&P SPIVA Scorecards
ABOUT THE AUTHOR
Nicolas Rabener is the CEO & Founder of Finominal, which empowers professional investors with data, technology, and research insights to improve their investment outcomes. Previously he created Jackdaw Capital, an award-winning quantitative hedge fund. Before that Nicolas worked at GIC and Citigroup in London and New York. Nicolas holds a Master of Finance from HHL Leipzig Graduate School of Management, is a CAIA charter holder, and enjoys endurance sports (Ironman & 100km Ultramarathon).
Connect with me on LinkedIn or X.

