Stock Market Returns and Volatility
Is volatility a friend or foe?
December 2021. Reading Time: 10 Minutes. Author: Nicolas Rabener.
SUMMARY
- Average stock market returns are similar regardless if volatility was high or low
- However, given skewed returns, it was not attractive investing when volatility was high
- Unfortunately implementing a strategy to avoid high volatility periods is emotionally challenging
INTRODUCTION
Active fund managers frequently complain about stock market volatility being too low for their taste and articulate a preference for more volatile markets. When stock markets crash, they can keep calm and carry on with their jobs. Retail investors in panic mode should provide plenty of opportunities to generate alpha.
And indeed, if we analyze the S&P SPIVA data on the underperformance of US domestic fund managers during the global financial crisis (GFC) in 2009, only 41% underperformed their benchmarks, which was the lowest percentage in the last 15 years. Unfortunately, 65% underperformed in 2008, the first year of the GFC, and 57% in 2020, when COVID-19 struck.
It seems that active fund managers are unable to fully exploit crisis times, perhaps as they panic like all other investors. Volatility tends to cluster and perhaps it is wise not to trade much when volatility is high. Perhaps investors should avoid stock market exposure altogether when volatility is high (read Volatility Hedge Funds: The Good, the Bad, and the Ugly).
In this research note, we will explore the relationship between stock market returns and volatility.
STOCK MARKET RETURNS WHEN VOLATILITY WAS HIGH
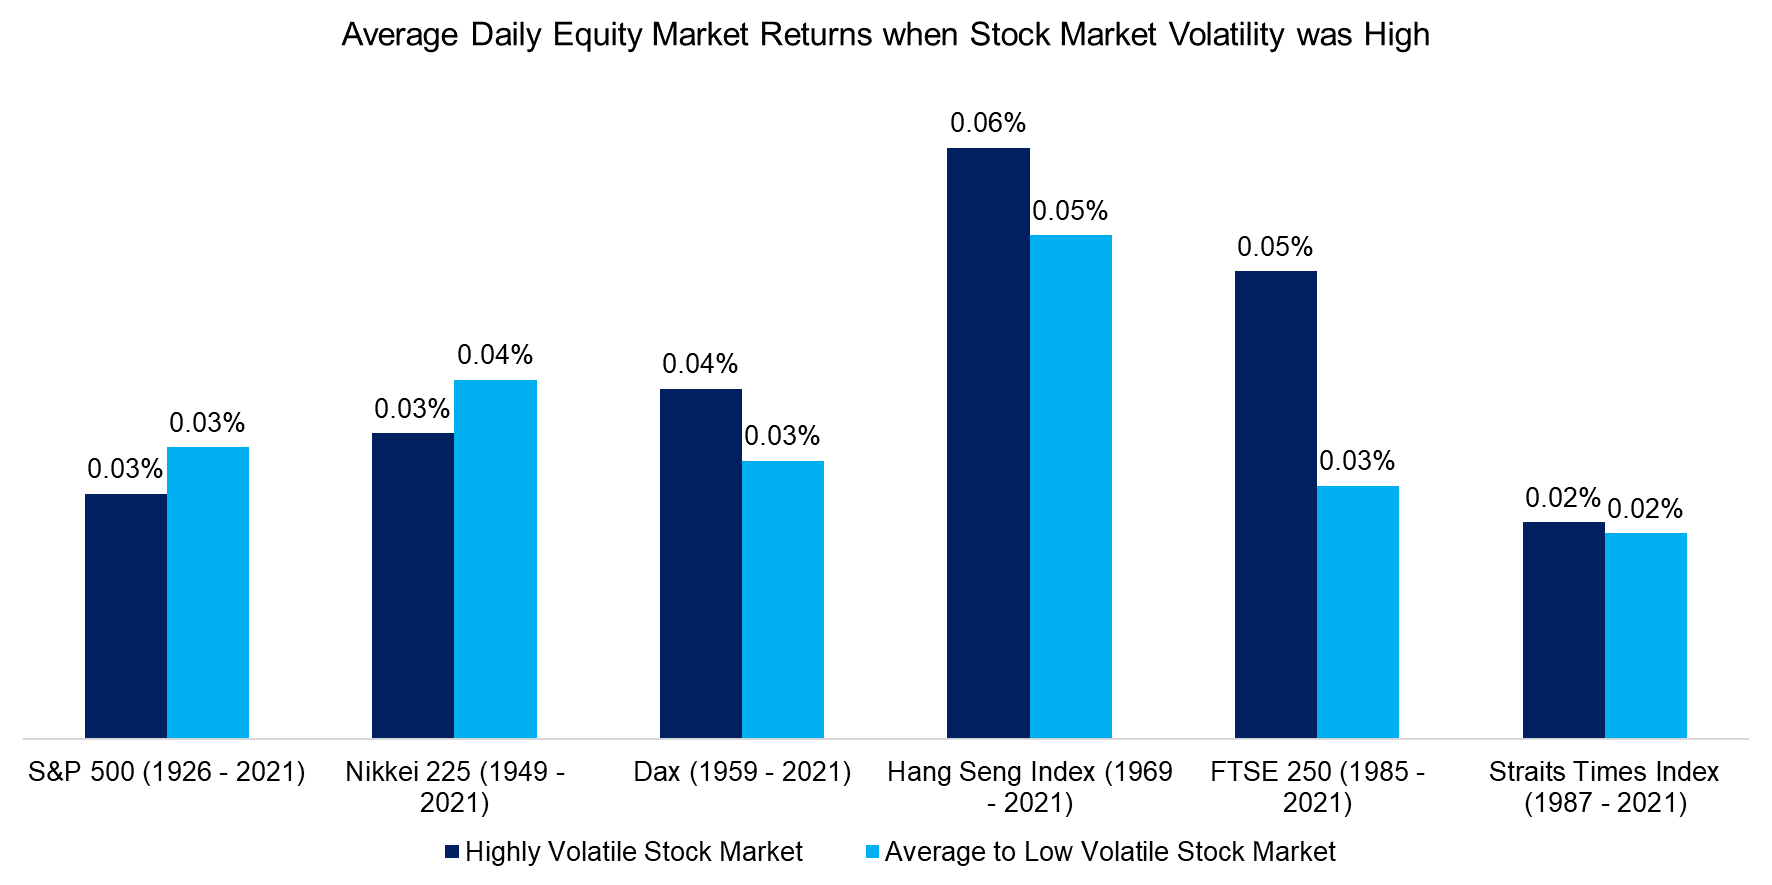
We focus on six stocks markets namely the US, Japan, Germany, Hong Kong, UK, and Singapore. The data history varies for each of these and goes back furthest for the US. First, we calculate the volatility of each stock market using an expanding window. For example, in the US we consider all daily returns since 1926 for determining the top quartile volatility in 2021. Next, we separate the daily returns into when volatility was high, which is defined as the top quartile, and when it was average or low.
We observe that the average daily returns of the six stock markets were positive across the different time periods and the magnitude of returns was similar regardless if volatility was high or not. Based on these results, there is no reason for investors to avoid stock market exposure when volatility is high.
Source: FactorResearch
A common issue with financial research from academics is that data is presented in tables. For example, a certain investment strategy might have generated 5% per annum, which seems attractive if presented as an average return in a table. However, a fund manager requires also consistent returns as a volatile strategy with large drawdowns creates significant career risks.
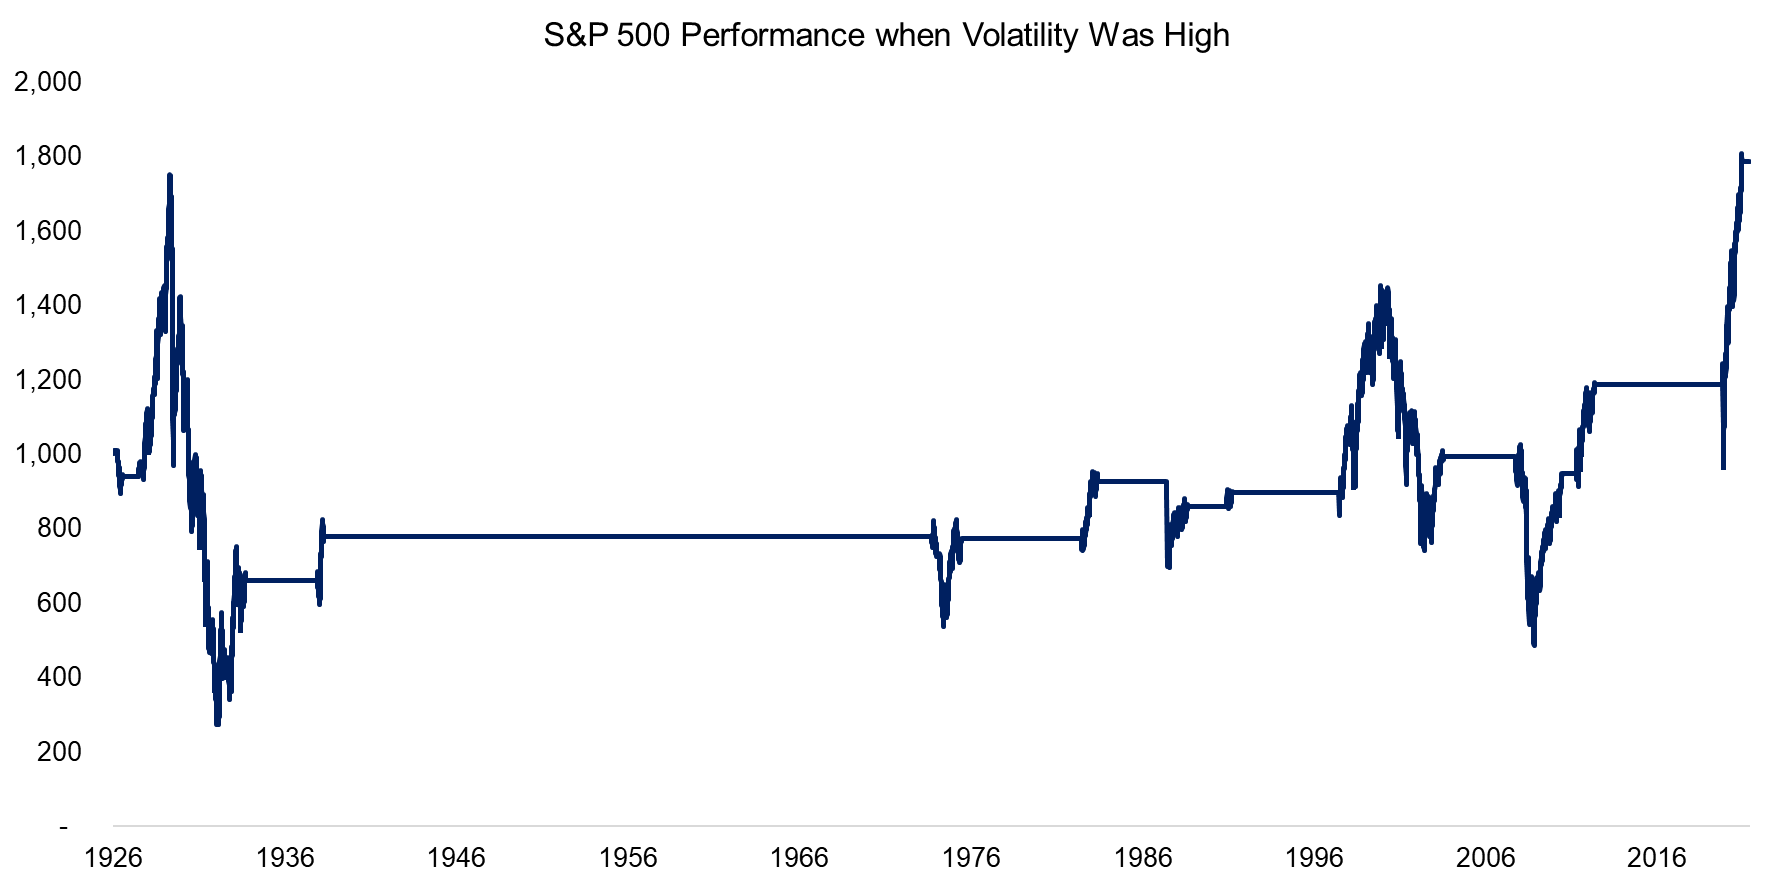
Given this, we show the performance of the S&P 500 when volatile was high in chart form, which paints a truly abysmal picture. The total return between 1926 and 2021 was positive, but only if 2020 and 2021 were included. In these two years, stock markets were volatile given the COVID-19 crisis, but also generated strong positive returns based on the significant government and central bank support.
Source: FactorResearch
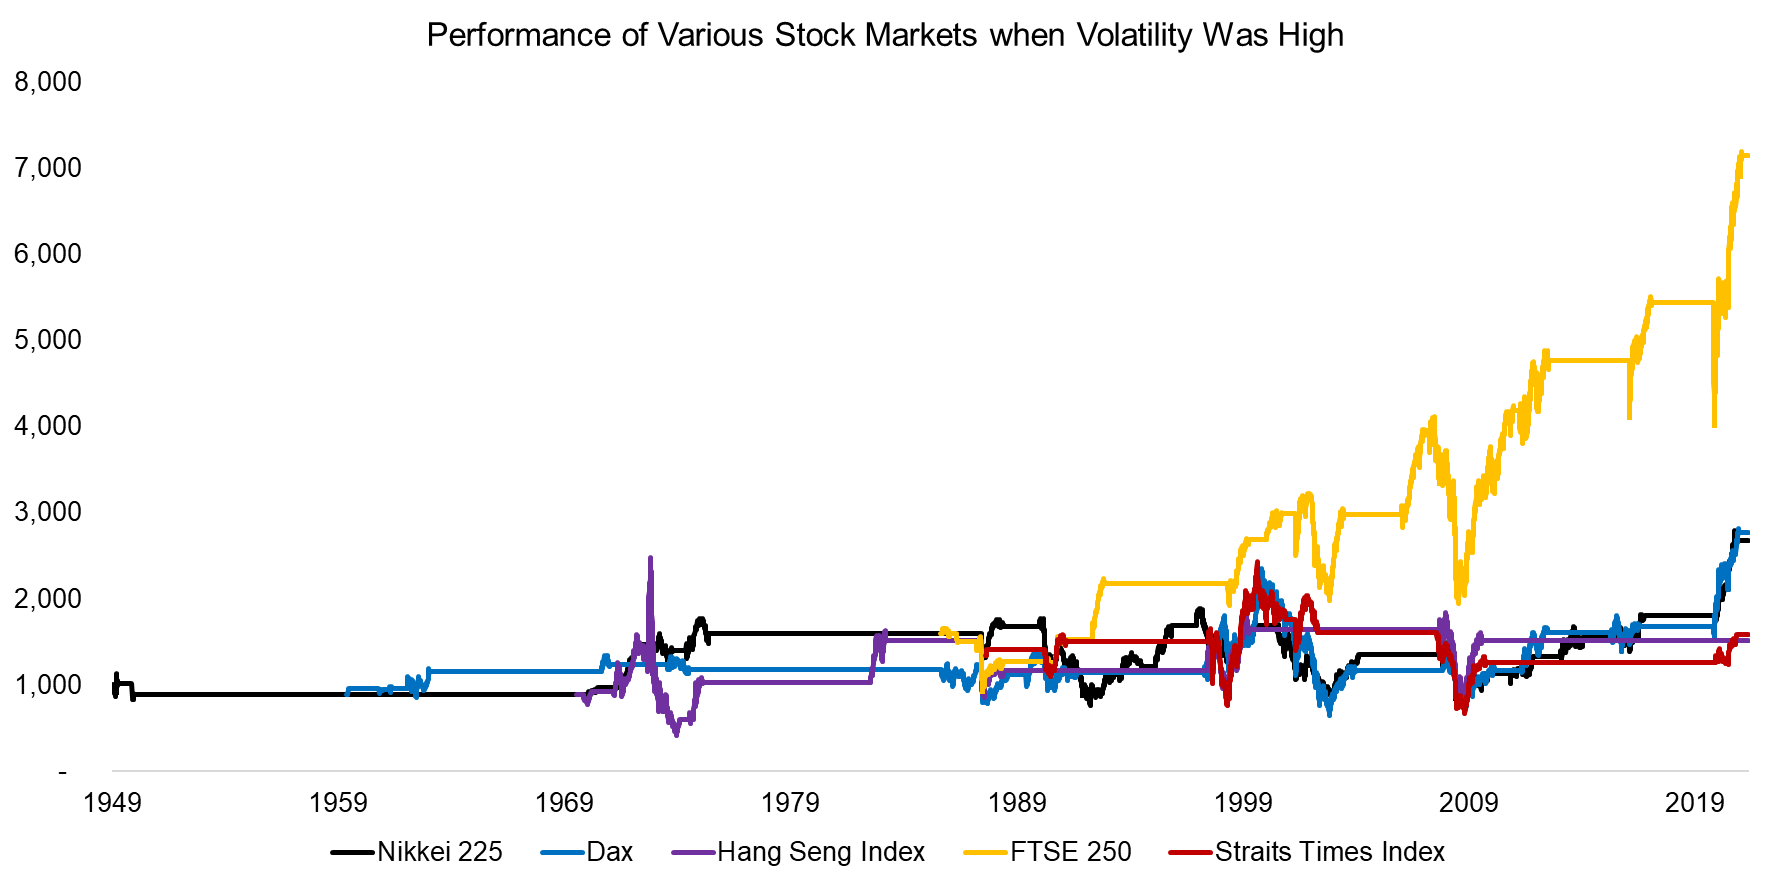
The performance of the US stock market was unattractive when volatility was high and we observe the same perspective when replicating the analysis for the Nikkei 225, Dax, Hang Seng Index, and Straits Times Index, where returns were essentially zero over various decade-long periods.
Only the FTSE 250 of the UK offered a differentiated performance as returns were strongly positive despite high volatility. However, there is no particular reason for the divergent results in the UK, which may be considered random.
Source: FactorResearch
SKEWNESS OF STOCK MARKET RETURNS
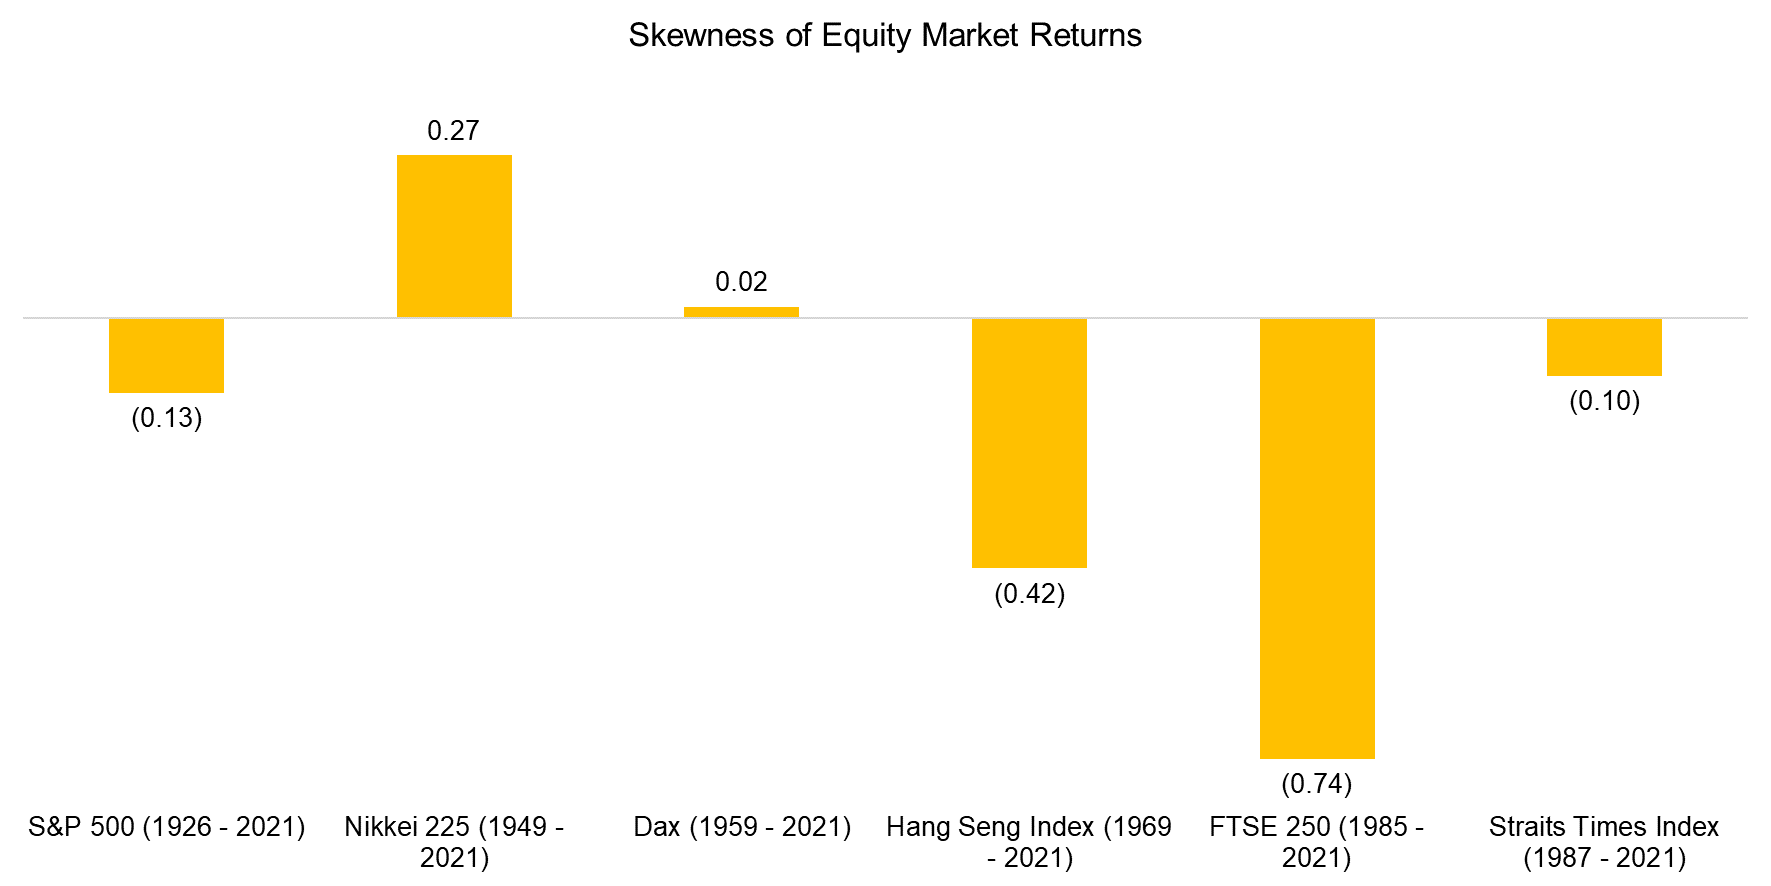
The explanation for why average returns may be misleading when perusing financial research is the distribution of the stock market returns, which are negatively skewed on average. Negative skewness implies many small positive returns and a few very large negative ones (read Skewness as a Factor).
The UK had the most negatively skewed returns, but it is worth highlighting that the observation periods of each stock market are different, eg we only have daily returns for the FTSE 250 from 1985, which essentially represents one long bull market interspersed with a few crashes, compared data from 1926 to the US, which includes more diverse market environments.
Source: FactorResearch
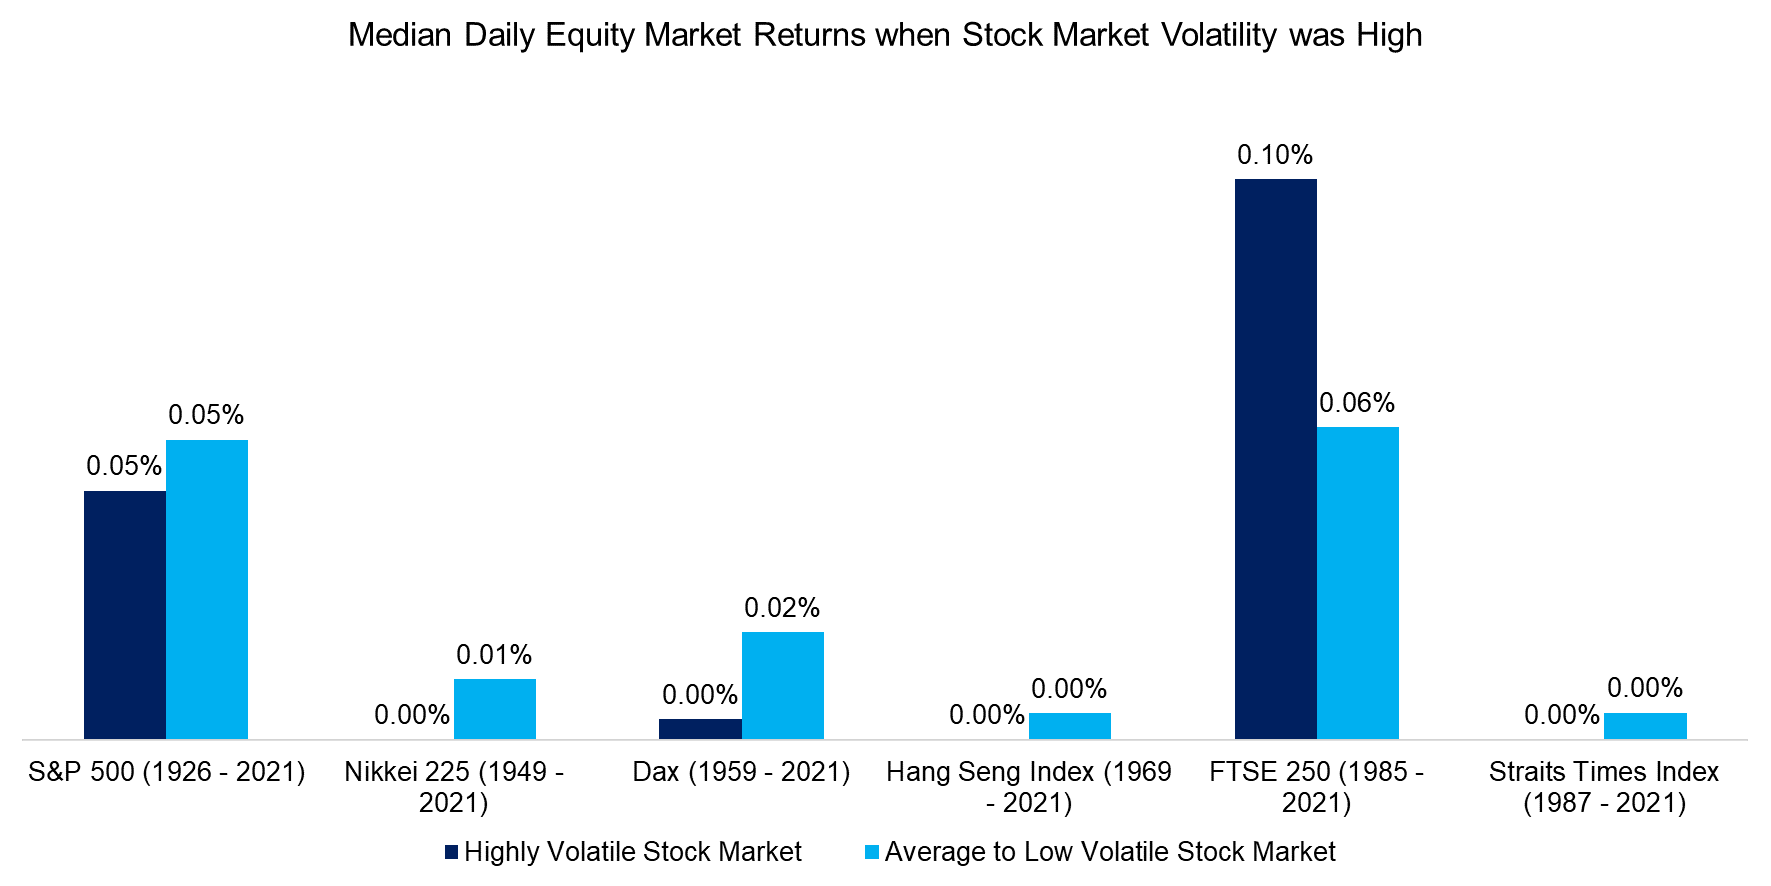
MEDIAN STOCK MARKET RETURNS WHEN VOLATILITY WAS HIGH
In order to reflect the negative skewness of stock market returns, we can switch from using average to median returns. We observe that except for the UK, the median return was lower when volatility was high than when it was average or low across all six stock markets.
Based on these results, it may seem sensible to avoid periods when volatility is high. Naturally, this would require active management where transaction costs and implementation also need to be considered.
Source: FactorResearch
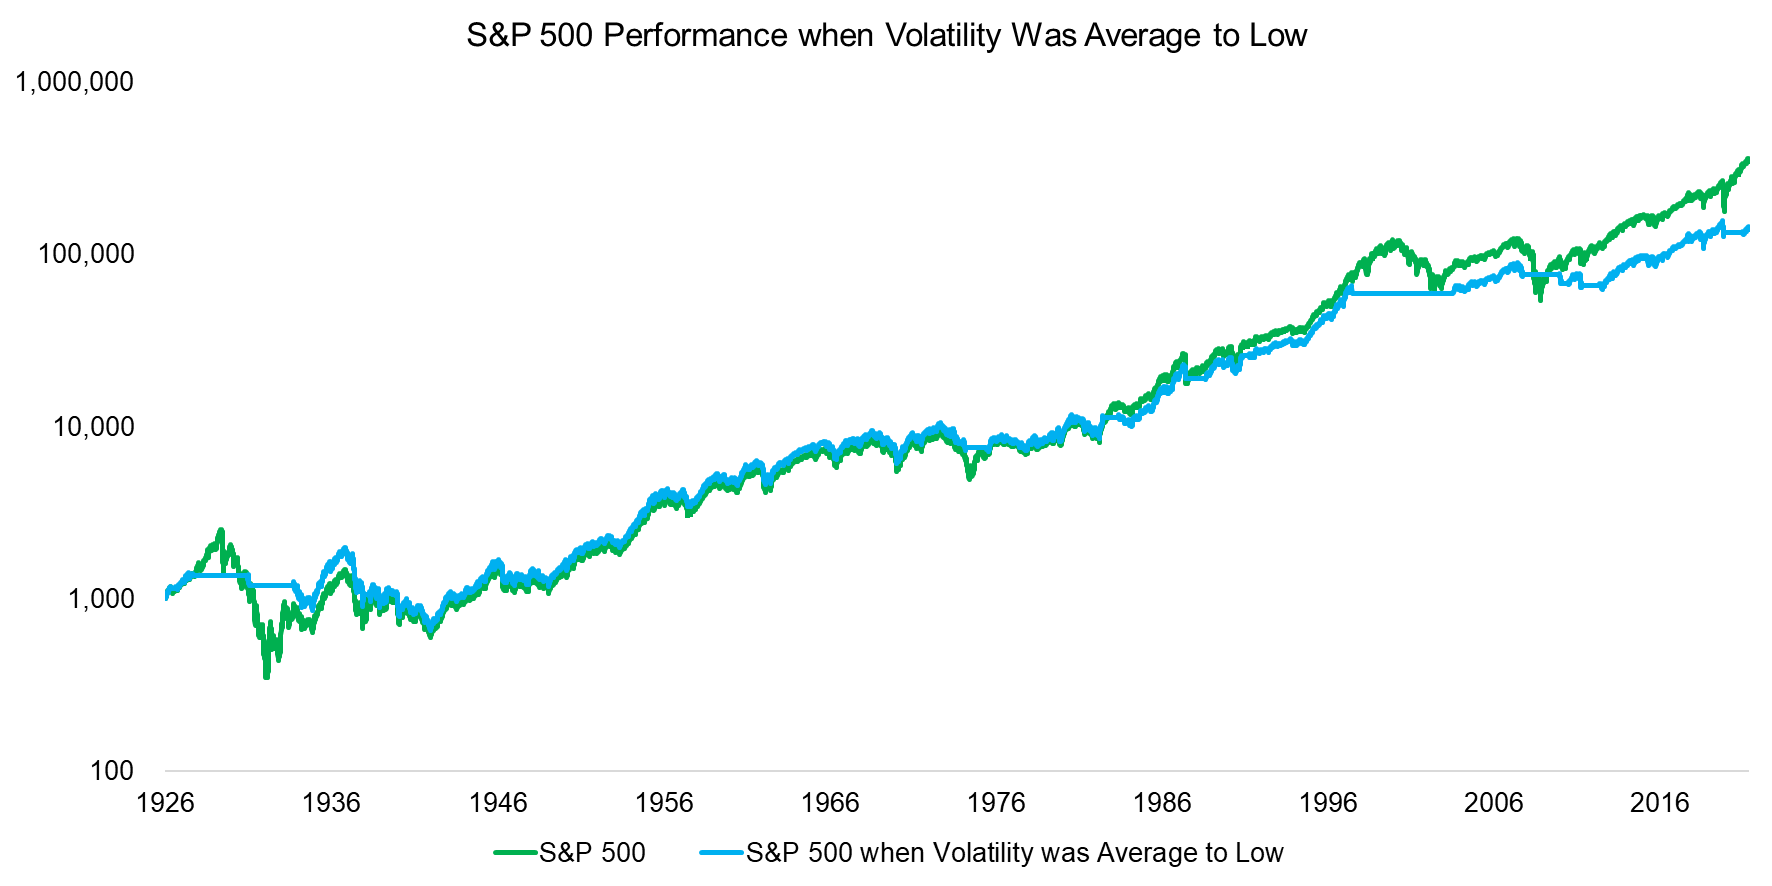
S&P 500 PERFORMANCE WHEN VOLATILITY WAS AVERAGE OR LOW
We can simulate the performance of the S&P 500 if we would have avoided periods when stock market volatility was high. Although we ignore transaction costs in the backtest, we add one day of delay before acting on a trading signal to make the implementation
We observe that such a trading strategy would have avoided the major stock market crashes of the last 90 years, ie there was little stock market exposure during the Great Depression in the 1930s, the tech bubble implosion in 2001, or the global financial crisis in 2008. Even the loss from the COVID-19 crisis was reduced significantly.
Furthermore, volatility tends to cluster, which means that the turnover of such a strategy is not excessive. Given that the stock markets can be traded cheaply via futures and ETFs, transaction costs would be marginal.
Source: FactorResearch
FURTHER THOUGHTS
Using volatility as a trading signal is well-established in financial research and serves as the foundation of many risk management frameworks and strategies, eg risk parity. Applying a volatility-based allocation framework to equities seems sensible based on the results of this analysis.
However, it is worth highlighting that such a strategy would also have required investors to reduce their equity exposure during bull markets, which would have been emotionally challenging given the fear of missing out. For example, investors would have had zero exposure to the S&P 500 during the boom in technology stocks between 1997 and 2000. The number of investors who would have had the discipline to hold on to such a framework is likely very small.
RELATED RESEARCH
Market Timing with Multiples, Momentum, and Volatility
Market Timing versus Risk Management
ABOUT THE AUTHOR
Nicolas Rabener is the Founder of Finominal, which empowers investors with data and technology to analyze and improve their portfolios. Previously he created Jackdaw Capital, an award-winning quantitative hedge fund. Before that Nicolas worked at GIC and Citigroup in London and New York. Nicolas holds a Master of Finance from HHL Leipzig Graduate School of Management, is a CAIA charter holder, and enjoys endurance sports (100km Ultramarathon).

