Tactical Mean-Reversion
Hedging Tail Risks of Equity Portfolios Efficiently
May 2018. Reading Time: 10 Minutes. Author: Nicolas Rabener.
SUMMARY
- The Mean-Reversion factor is driven by volatility
- Allocating tactically when volatility is high generates an attractive payoff profile
- The strategy can be considered as a tail risk hedge for equity portfolios
INTRODUCTION
Our most recent research note focused on the Mean-Reversion factor (please see the report Mean-Reversion Across Markets), which highlighted performance and strategy characteristics. We noted that the strategy is attractive as a diversifier for equity portfolios; however, is difficult to hold given positive skewness, which implies long periods of flat or declining returns with infrequent, but significant positive returns. In this research note we will explore allocating tactically versus strategically in the context of viewing Mean-Reversion as a hedge against equity tail risks.
METHODOLOGY
We focus on the Mean-Reversion factor in the US, which is created via dollar-neutral long-short portfolios buying the stocks with the worst weekly returns and shorting the stocks with the highest weekly returns. The portfolios are created daily and rebalanced weekly, which results in a strategy with an exceptionally high turnover. The top and bottom 2.5% of the stock universe are selected in portfolio construction and only stocks with a market capitalisation of larger than $1 billion are included. Each transaction incurs costs of 5 basis points.
MEAN-REVERSION AND VOLATILITY
Mean-Reversion is the inverse of short-term Momentum as the strategy consists of buying the worst performing and selling the best performing stocks, measured over very short time frames. These stocks have significantly under- or outperformed the market, which is due to stock-specific news. When volatility is low, then markets are likely to reflect news accurately; however, when volatility is high, then mispricings occur more frequently. The Mean-Reversion factor represents a liquidity-providing strategy and the compensation for providing liquidity is highest when markets are in turmoil and investors panic. The chart below compares the performance of the Mean-Reversion factor in the US to the VIX and highlights that more than 50% of the returns can be attributed to a few months during the Global Financial Crisis in 2008 and 2009, when implied volatility was at record levels (read Mean-Reversion on Equity Index Level).
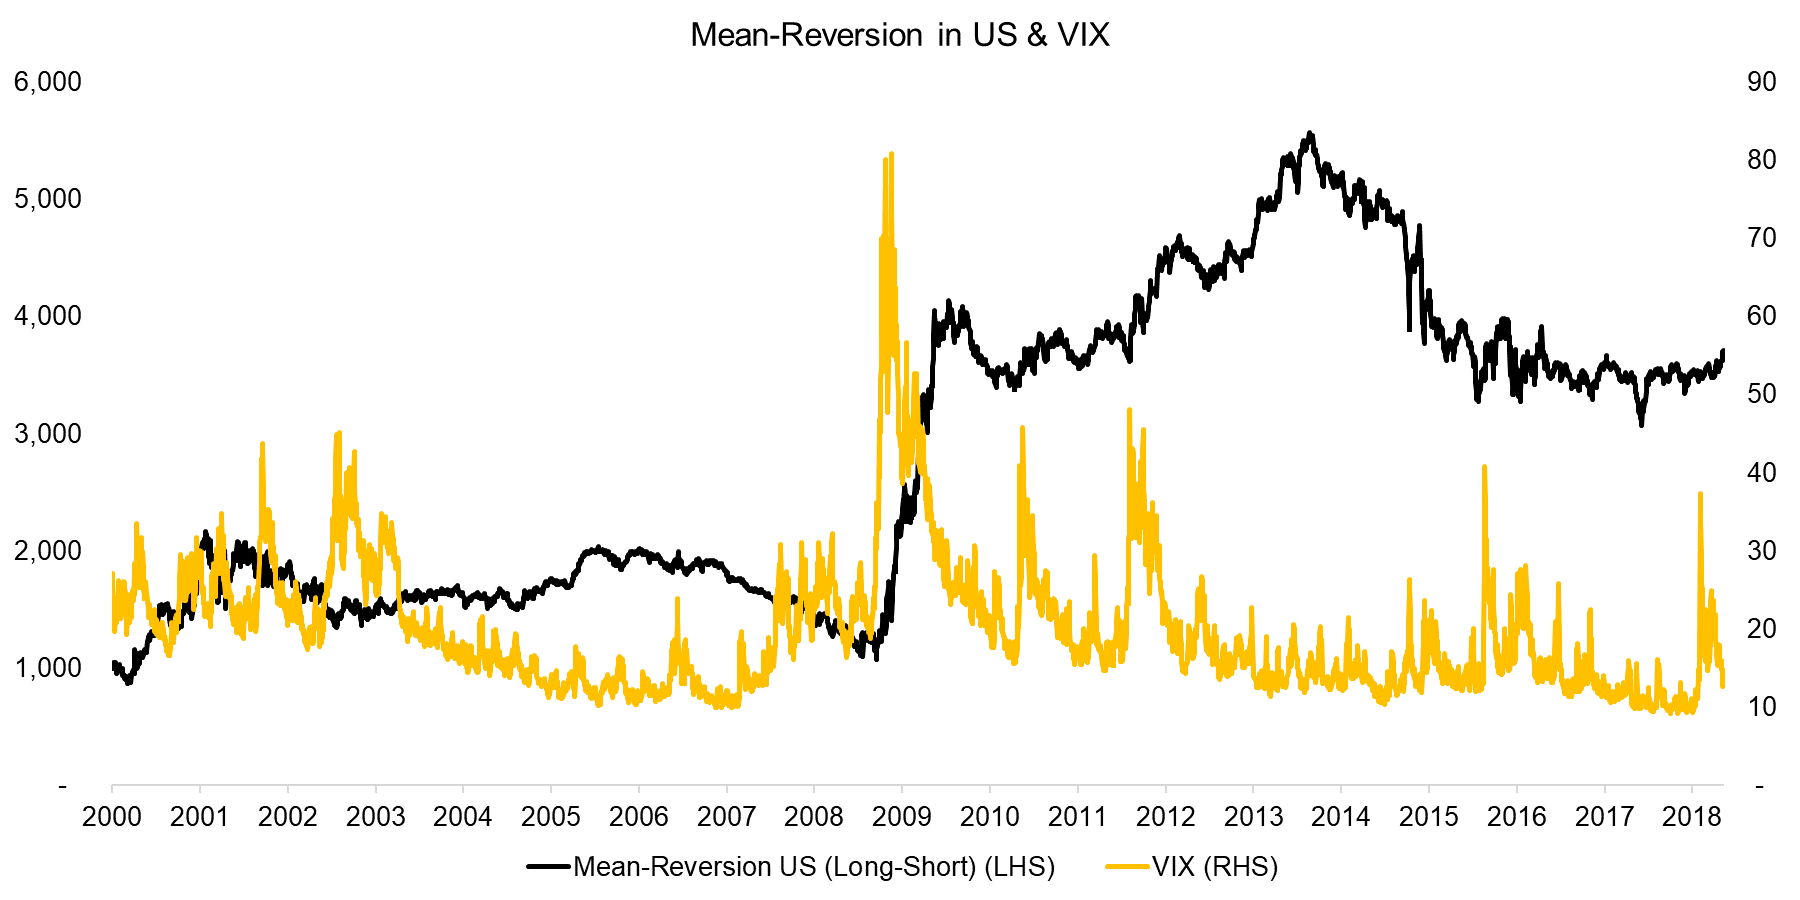
Source: CBOE, FactorResearch
Given that volatility is the key driver of Mean-Reversion returns, we can analyse the returns by splitting the performance into quartiles of implied volatility. The chart below highlights that effectively all positive returns of the Mean-Reversion factor during the last two decades can be contributed to periods when volatility was extremely high, which mainly occurred during the Global Financial Crisis. One conclusion from this analysis is that under normal markets conditions new information is processed efficiently and almost zero alpha can be captured from what investors might perceive as short-term over- and underreaction on single stock level.
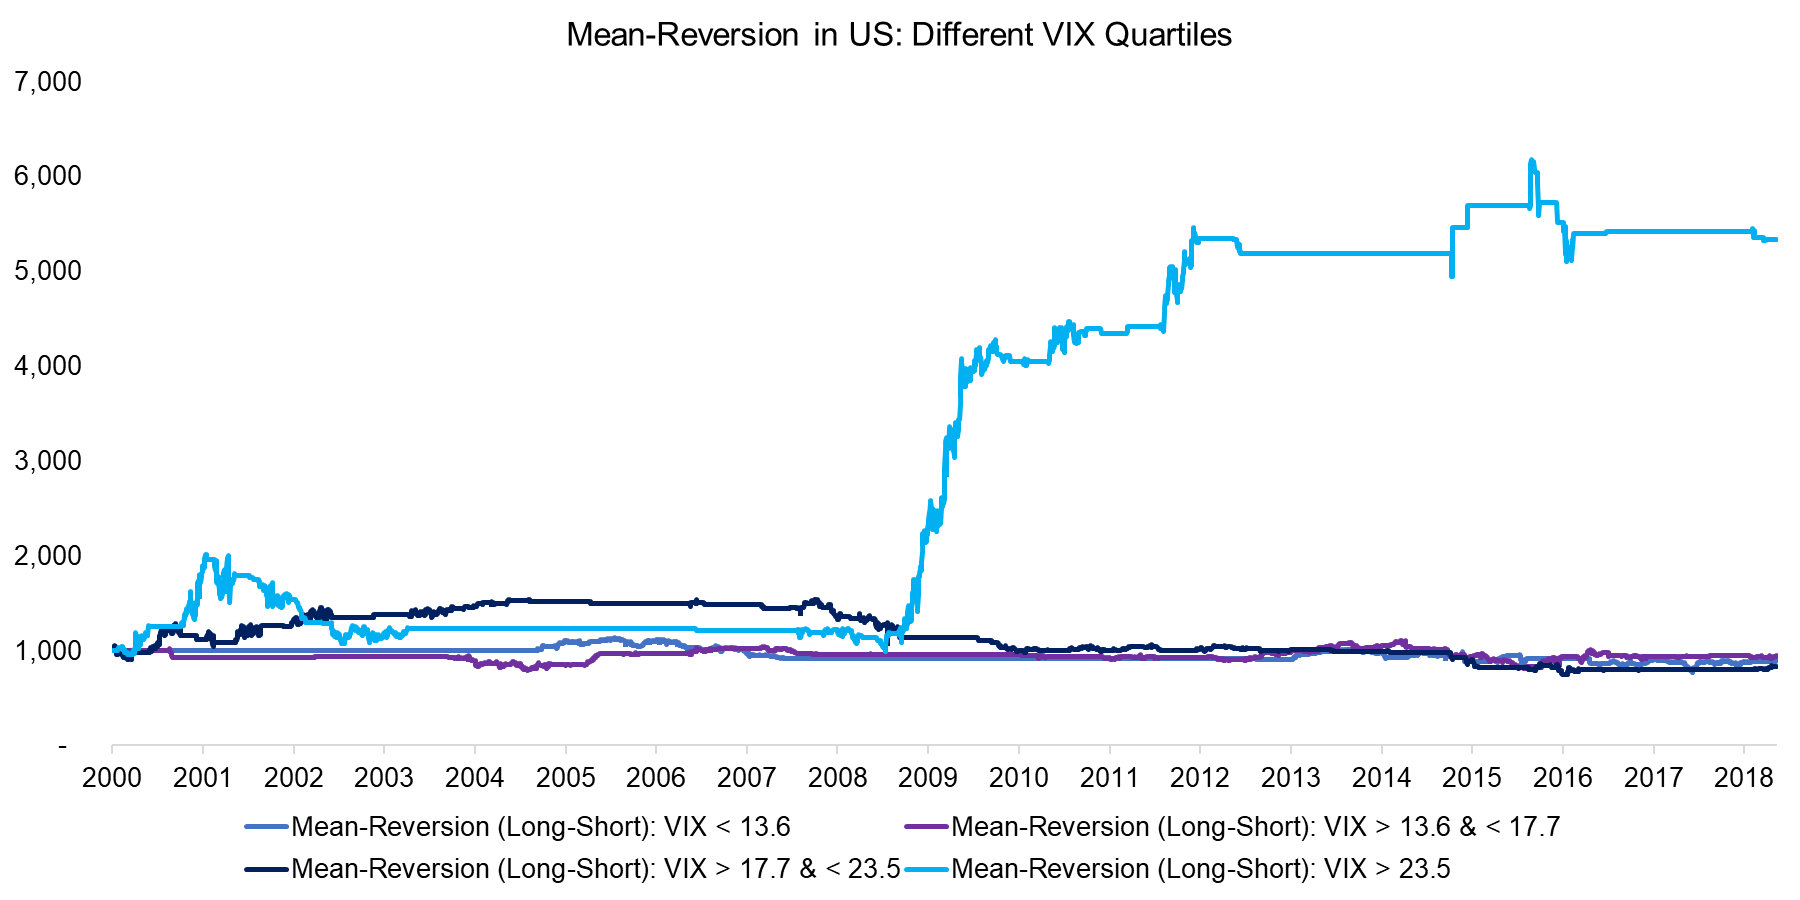
Source: FactorResearch
HEDGING TAIL RISKS OF EQUITY PORTFOLIOS
Investors have many choices when considering hedging tail risks of equity portfolios and these can broadly be differentiated between internal risk management frameworks and allocations to external strategies. The most common external products are trend following funds (CTAs) and option-based strategies. Most of these, like Mean-Reversion, exhibit positive skewness, which implies frequent multi-year periods of flat or negative returns before significant payoffs, which makes these investments emotionally challenging to hold.
However, an allocation to Mean-Reversion can be structured tactically by only providing liquidity to markets when compensation is likely attractive, which occurs at higher levels of volatility. The chart below compares the performance of the S&P 500 and two combinations with exposure to long-short Mean-Reversion, one strategic and one tactical. The tactical portfolio allocates 20% to the Mean-Reversion factor when implied volatility is in the highest quartile and otherwise 100% into the S&P 500.
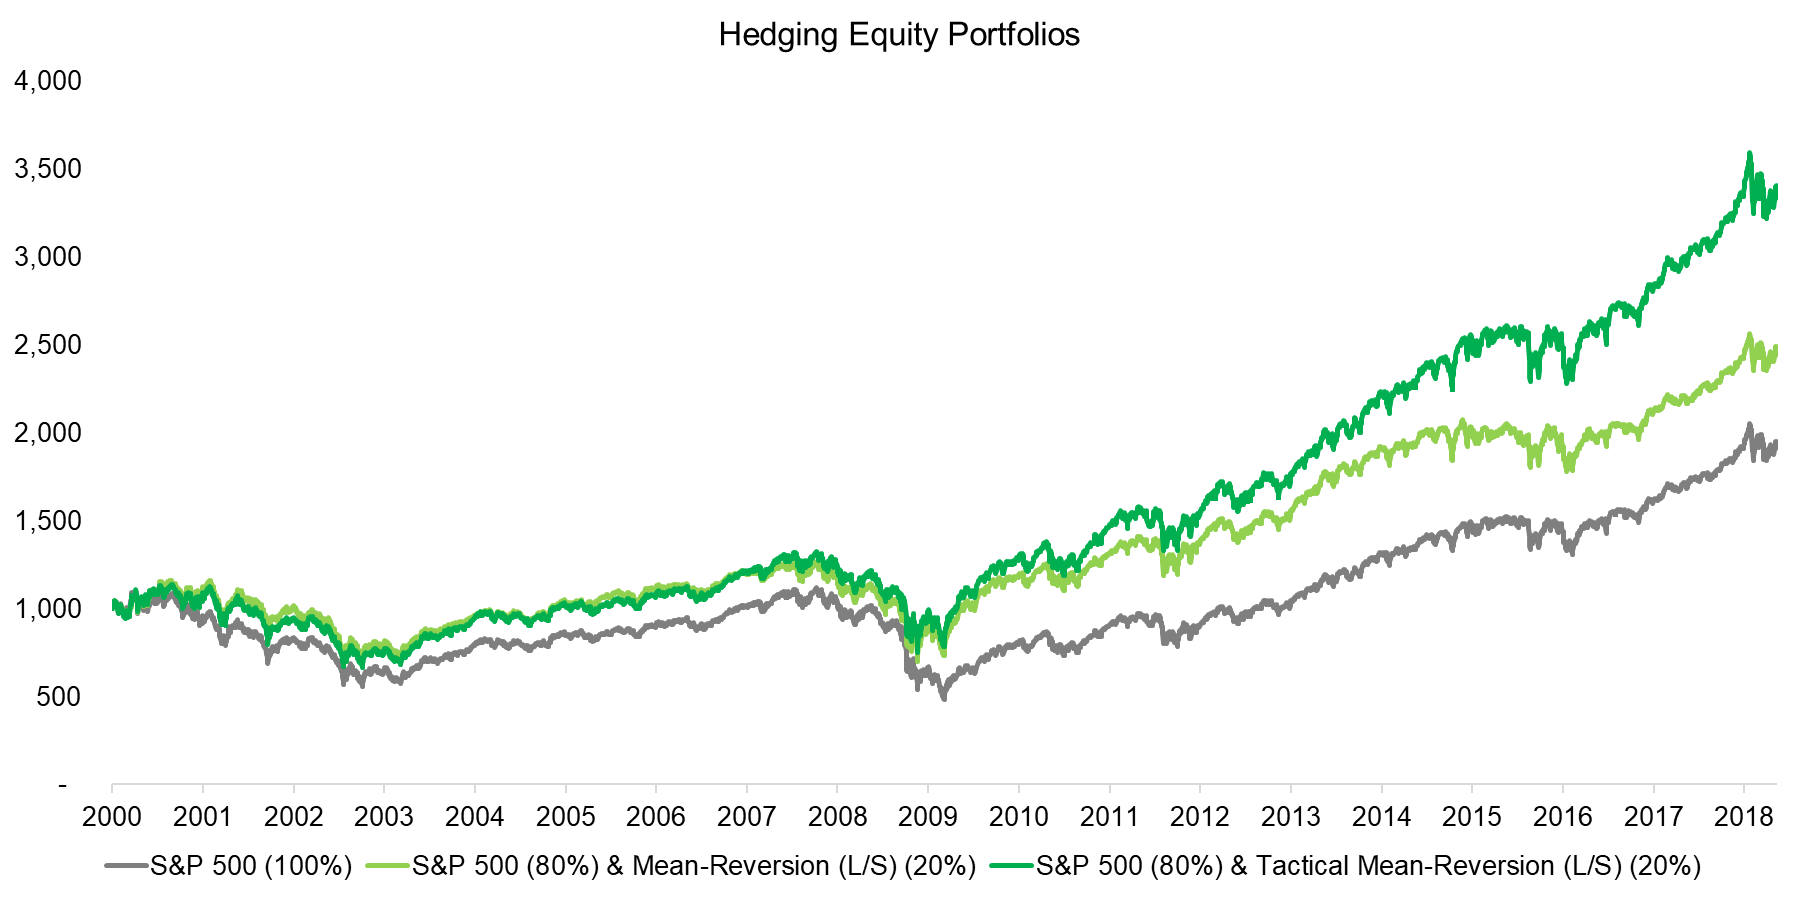
Source: FactorResearch
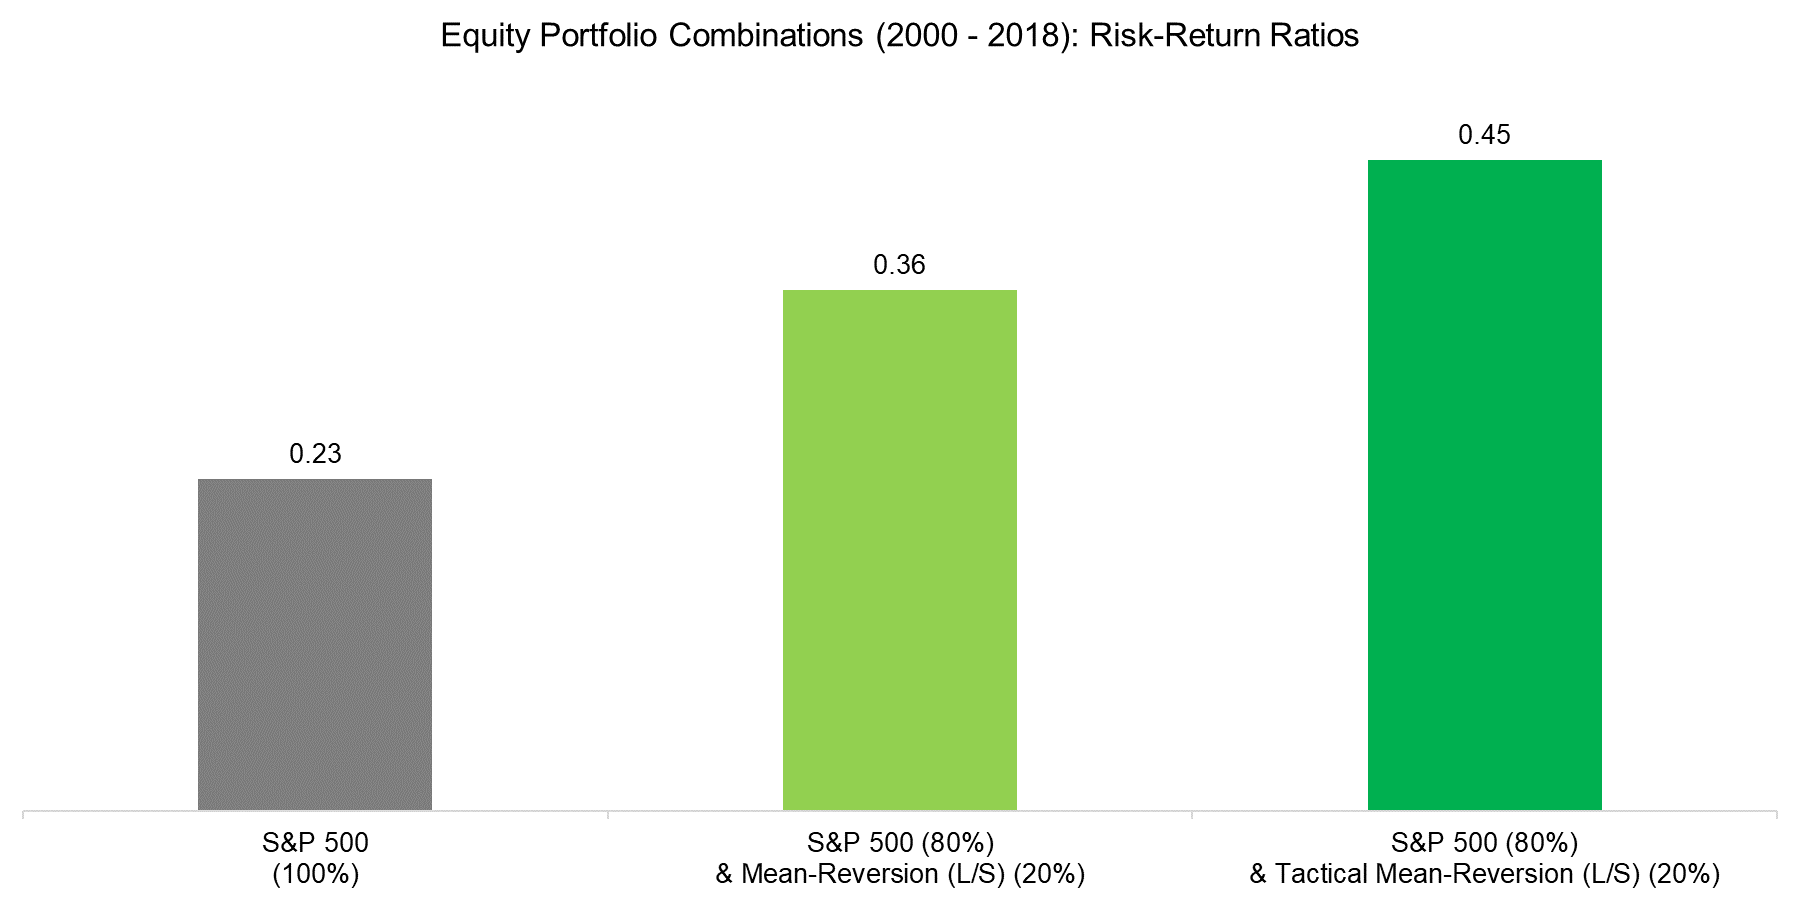
The analysis below shows the impact of adding exposure to the long-short Mean-Reversion factor for an equity portfolio. As expected the maximum drawdown is reduced significantly and returns increase, especially when considering the tactical allocation, which only invests into Mean-Reversion when volatility is extreme.
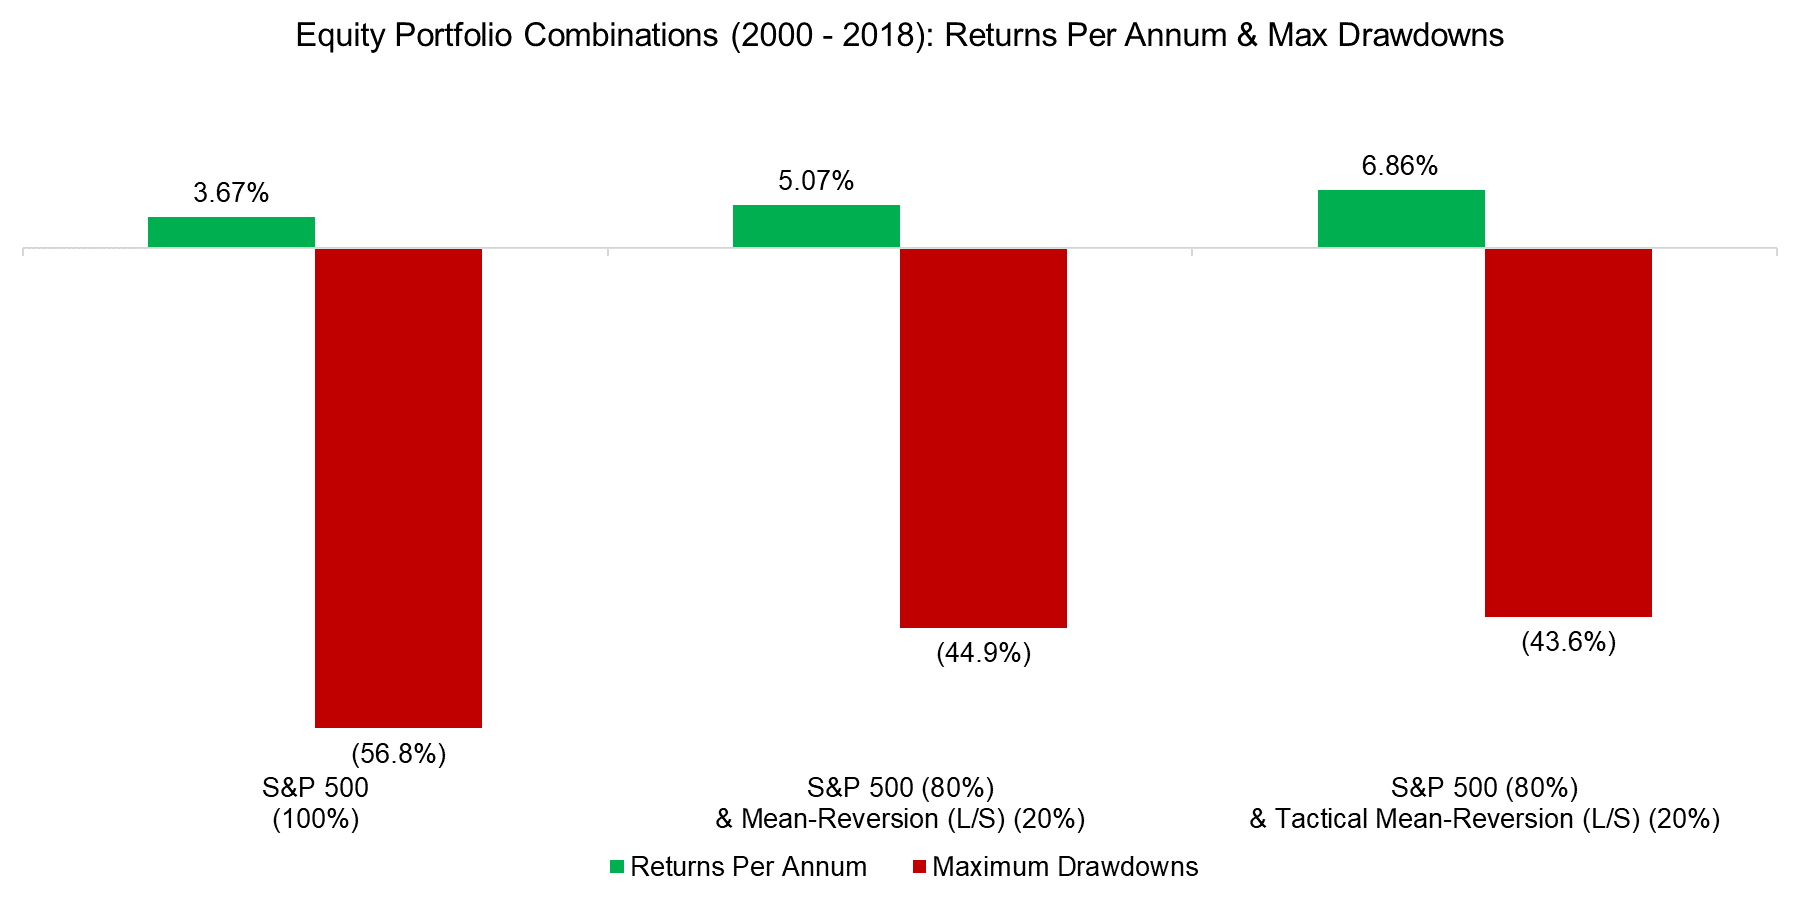
Source: FactorResearch
The risk-return ratio of an equity portfolio can be increased significantly by adding exposure to the long-short Mean-Reversion factor, especially if structured tactically. The factor characteristics make the strategy attractive from a diversification perspective as higher volatility is not associated with higher equity returns. Tactical Mean-Reversion is also cheaper than other tail risk hedges as the exposure is limited, although the capacity is smaller and execution risks are higher, especially when compared to CTAs.
Source: FactorResearch
FURTHER THOUGHTS
This short research note highlights that allocating tactically to the Mean-Reversion factor can improve the performance and risk metrics of an equity portfolio significantly. It is worth highlighting that this strategy has an exceptionally high turnover and therefore requires very low commission rates and an excellent operational infrastructure. Investors considering this strategy might be better suited to find an external party, e.g. an index provider and an investment bank that offers the factor exposure via a total return swap, versus managing it internally. Naturally it also requires a thoughtful and systematic framework for defining when volatility is attractive enough for deploying the strategy, which is likely the biggest challenge.
ABOUT THE AUTHOR
Nicolas Rabener is the CEO & Founder of Finominal, which empowers professional investors with data, technology, and research insights to improve their investment outcomes. Previously he created Jackdaw Capital, an award-winning quantitative hedge fund. Before that Nicolas worked at GIC and Citigroup in London and New York. Nicolas holds a Master of Finance from HHL Leipzig Graduate School of Management, is a CAIA charter holder, and enjoys endurance sports (Ironman & 100km Ultramarathon).
Connect with me on LinkedIn or X.

