Tactical Statistical Arbitrage
Tactical versus Strategic Exposure
November 2018. Reading Time: 10 Minutes. Author: Nicolas Rabener.
SUMMARY
- Statistical arbitrage behaves similarly across markets
- Volatility is the main performance driver
- Attractive strategy for diversifying an equity portfolio
INTRODUCTION
Strategies like Value or Momentum are like staples that deserve a permanent allocation in investors portfolios. In contrast, other strategies are more like sunscreen, which is mainly used tactically to minimize the risk of getting a sunburn when going to the beach. Statistical arbitrage is a strategy that is likely more interesting on a tactical than strategic basis as returns are only attractive when volatility is high. In this short research note we will investigate statistical arbitrage across markets and the utilization as a tactical strategy for hedging equity portfolios (read Statistical Arbitrage in the US).
METHODOLOGY
We focus on all stocks in the US, European and Asian markets with a market capitalization of larger than $1 billion. The strategy is to create a diversified portfolio of pair trades, which will be dollar-neutral. Each pair consists of one long and one short position in stocks. In addition, the two stocks of a pair need to be cointegrated, which is measured with a one-year lookback and a maximum p-value of 0.3. A trade in a pair is entered when the z-score of the stock price ratio breaches +/- 2.0 and exited when the z-score reaches 0 subsequently. The z-score is calculated with a 21-day lookback. Each transaction incurs 10 basis points of costs. The portfolio is created sector-neutral in the US while cross-sector in other stock markets.
It is worth noting that statistical arbitrage is a sophisticated strategy that comes in all kind of forms and requires many assumptions. Our methodology is in line with academic research and relatively simple.
STATISTICAL ARBITRAGE ACROSS MARKETS
Peter Muller’s proprietary trading team at Morgan Stanley is often accredited for pioneering statistical arbitrage in the US stock market in the 1980s, although hedge fund managers like Edward Thorpe had also been employing the strategy at the same time. Since then the strategy has been explored by academics and rolled out to other markets by practitioners.
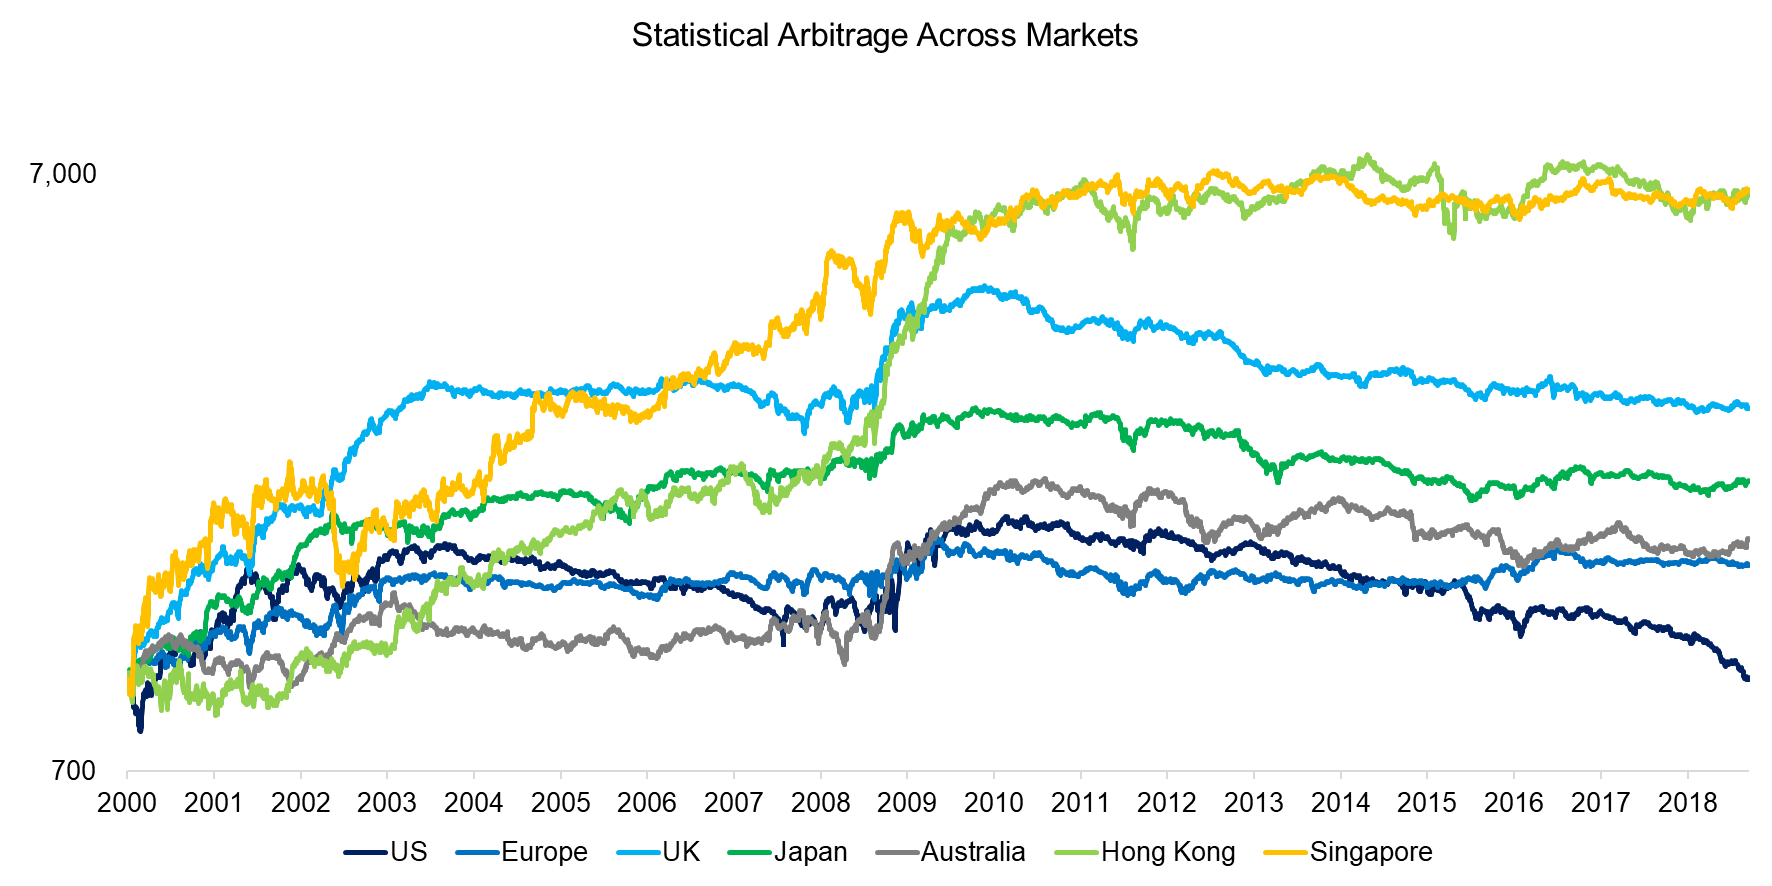
The analysis below highlights that the performance of the statistical arbitrage strategy is relatively comparable across markets. The market-neutral strategy generated attractive returns between 2000 and 2004 and then again during the global financial crisis between 2008 and 2010. However, the last few years seem to be evolving into a lost decade as most markets show a declining or flat performance.
The markets with most consistent returns appear to be Hong Kong and Singapore, although the performance needs to be discounted. We assume the same 10 basis points of cost per transaction across all markets, but trading stocks in these two markets is more expensive in reality, especially given that they feature stamp duty transaction taxes. Stocks are only held for a number of days, which makes statistical arbitrage a high-turnover strategy that is extremely sensitive to transaction cost assumptions (read Factor Portfolios: Turnover Analysis).
Source: FactorResearch
GLOBAL STATISTICAL ARBITRAGE
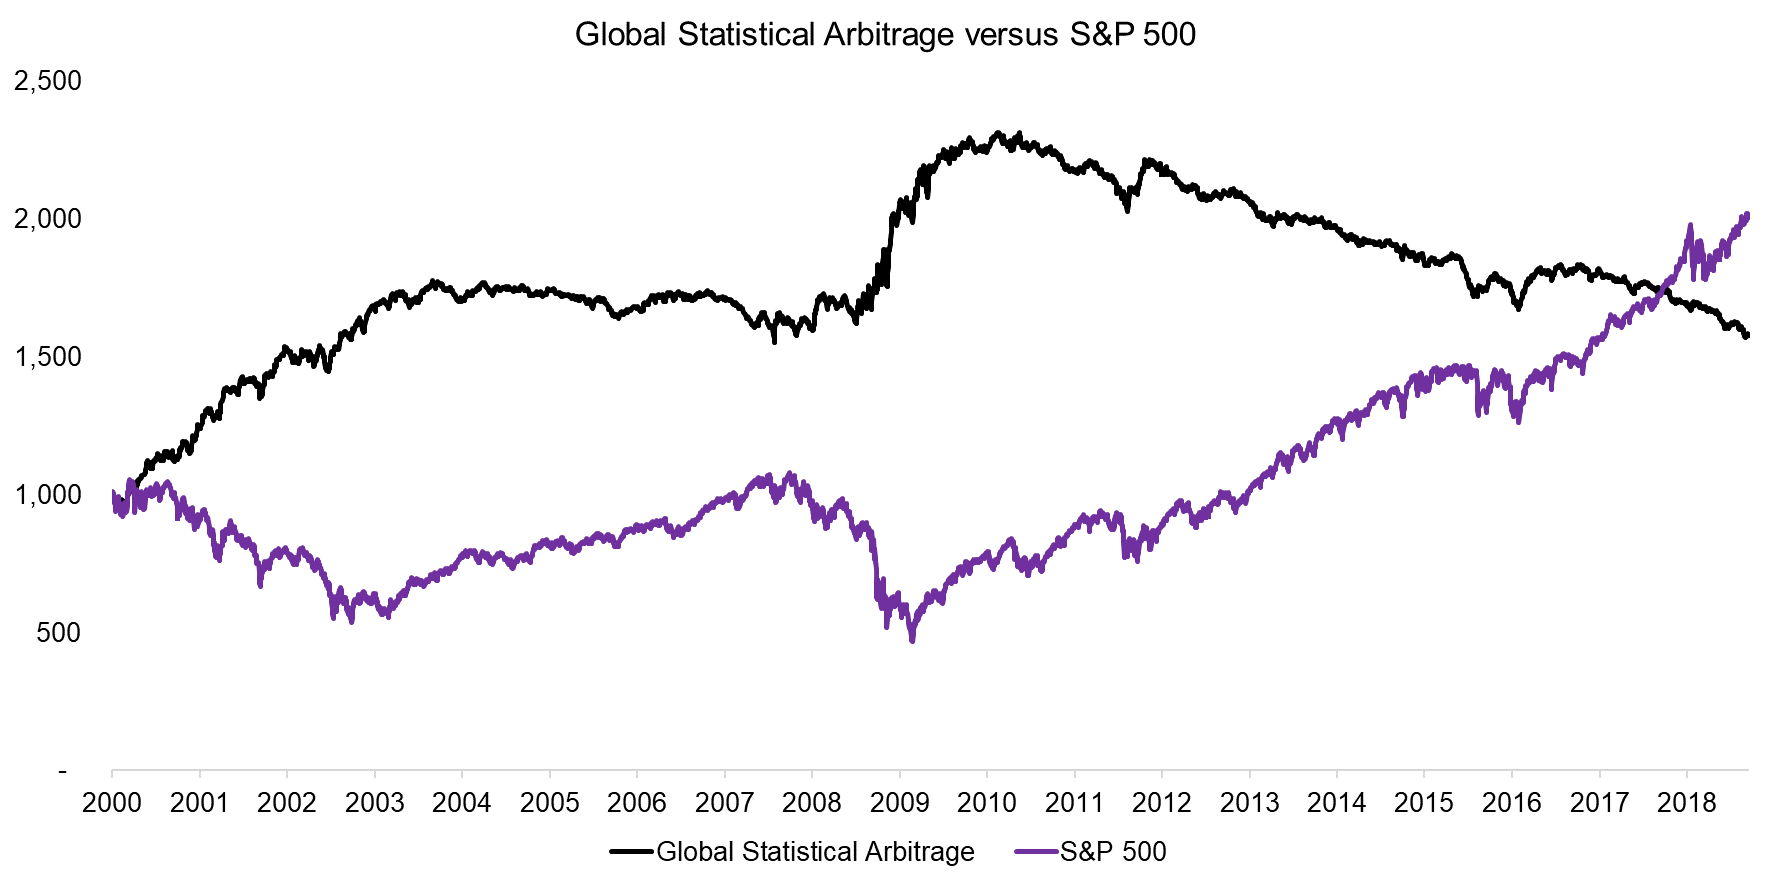
Next, we create a global statistical arbitrage portfolio by combining the country portfolios and weighting them according to their market capitalizations, which gives the US the largest weight with approximately 50%.
The analysis highlights that before 2010 the strategy was attractive as it was either flat or increasing, but experienced hardly any drawdowns. However, since the global financial crisis, the returns have been consistently negative. We also observe that statistical arbitrage performed best when the S&P 500 was declining, which typically coincides with high levels of market volatility. The poor performance since 2010 can likely be explained by increased competition and low market volatility.
Source: FactorResearch
TACTICAL GLOBAL STATISTICAL ARBITRAGE
Statistical arbitrage can be characterized as a liquidity-providing strategy as it takes the opposite direction of the current trend. For example, the long position in a statistical arbitrage trade is a stock that has been decreasing rapidly on a relative basis to another stock. The strategy is to offer liquidity to any investor who wants to sell the stock. Naturally this is more likely to be a profitable strategy when investors are reacting less rational, i.e. buying or selling aggressively, which tends to occur when market volatility is high.
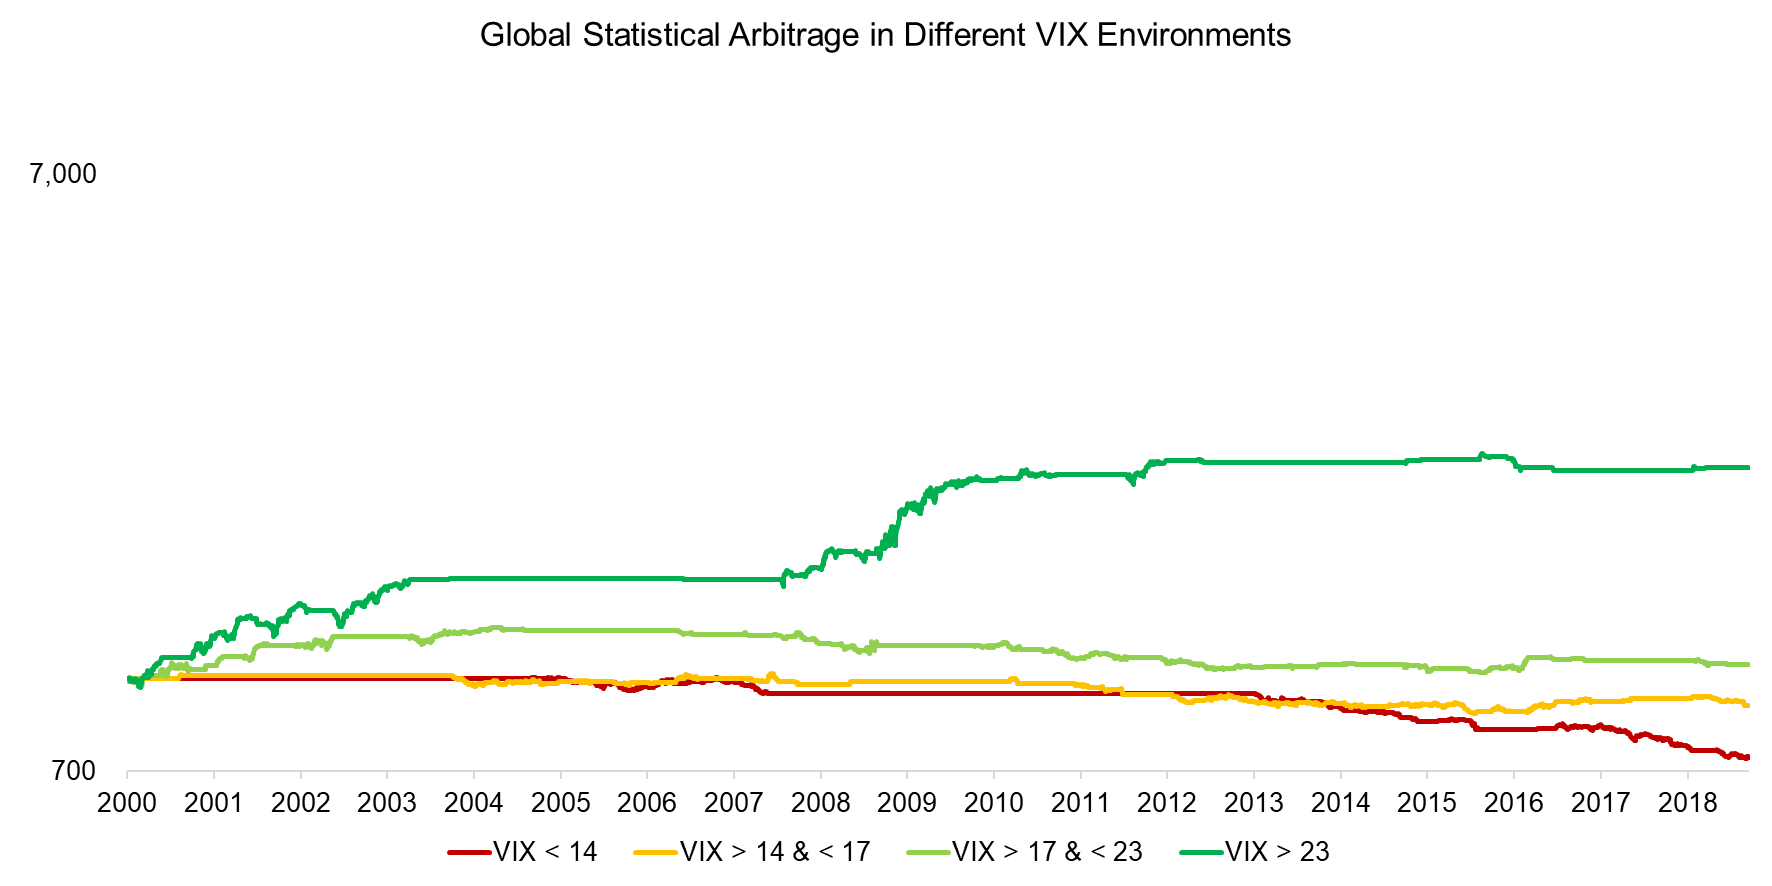
We can differentiate market volatility by VIX quartiles. Given that the VIX is mean-reversionary in nature, there is no significant look-ahead bias in this analysis. We observe that statistical arbitrage generated only positive returns when the VIX was above 17, which represents high levels of market volatility.
Source: FactorResearch
The analysis can be challenged by the assumption of constant transaction costs of 10 basis points throughout the observation period. Investors might argue that bid-and-ask spreads are going to be wider in periods of high market volatility.
HEDGING EQUITY PORTFOLIOS WITH TACTICAL STATISTICAL ARBITRAGE
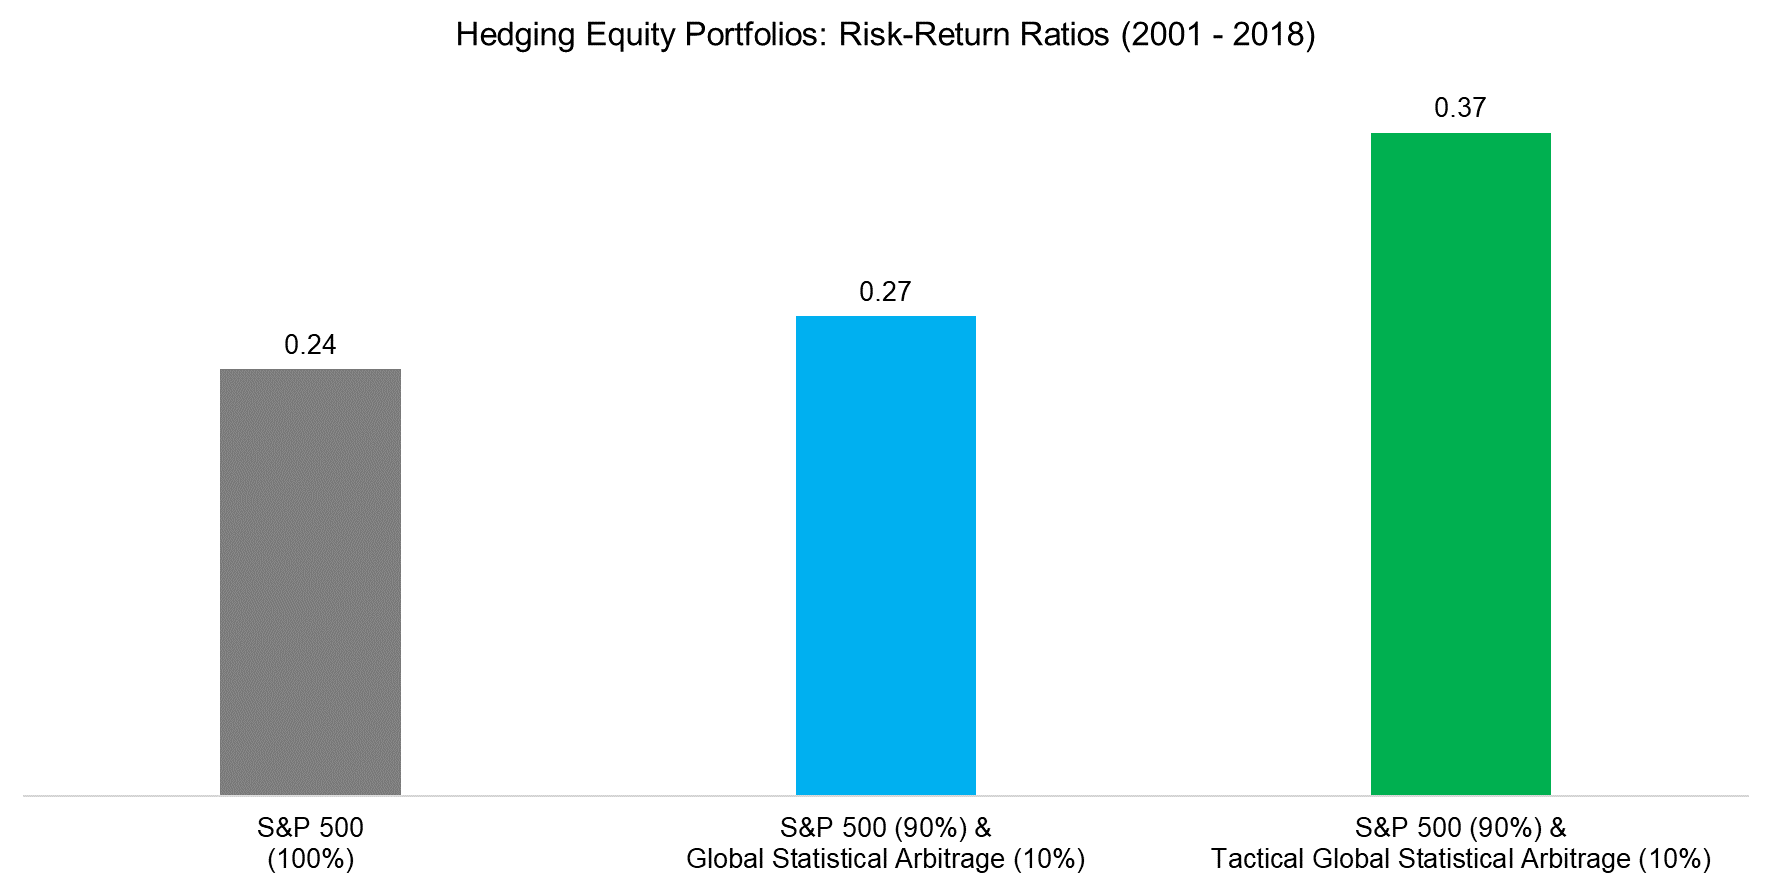
Given that statistical arbitrage tends to perform best when markets are declining and volatility is high, it might be an attractive strategy for diversifying an equity portfolio. We create two portfolios that allocate 90% to the S&P 500 and 10% to the statistical arbitrage strategy, once with continuous exposure and the other with tactical exposure when the VIX is in the top quartile, i.e. above 23.
We observe that adding a 10% allocation to statistical arbitrage improves the risk-return ratios, especially if it represents a tactical rather than strategic allocation. Investors might be concerned that a tactical allocation requires frequent changes in the portfolio composition, but allocations rarely change as stock market volatility tends to cluster.
Source: FactorResearch
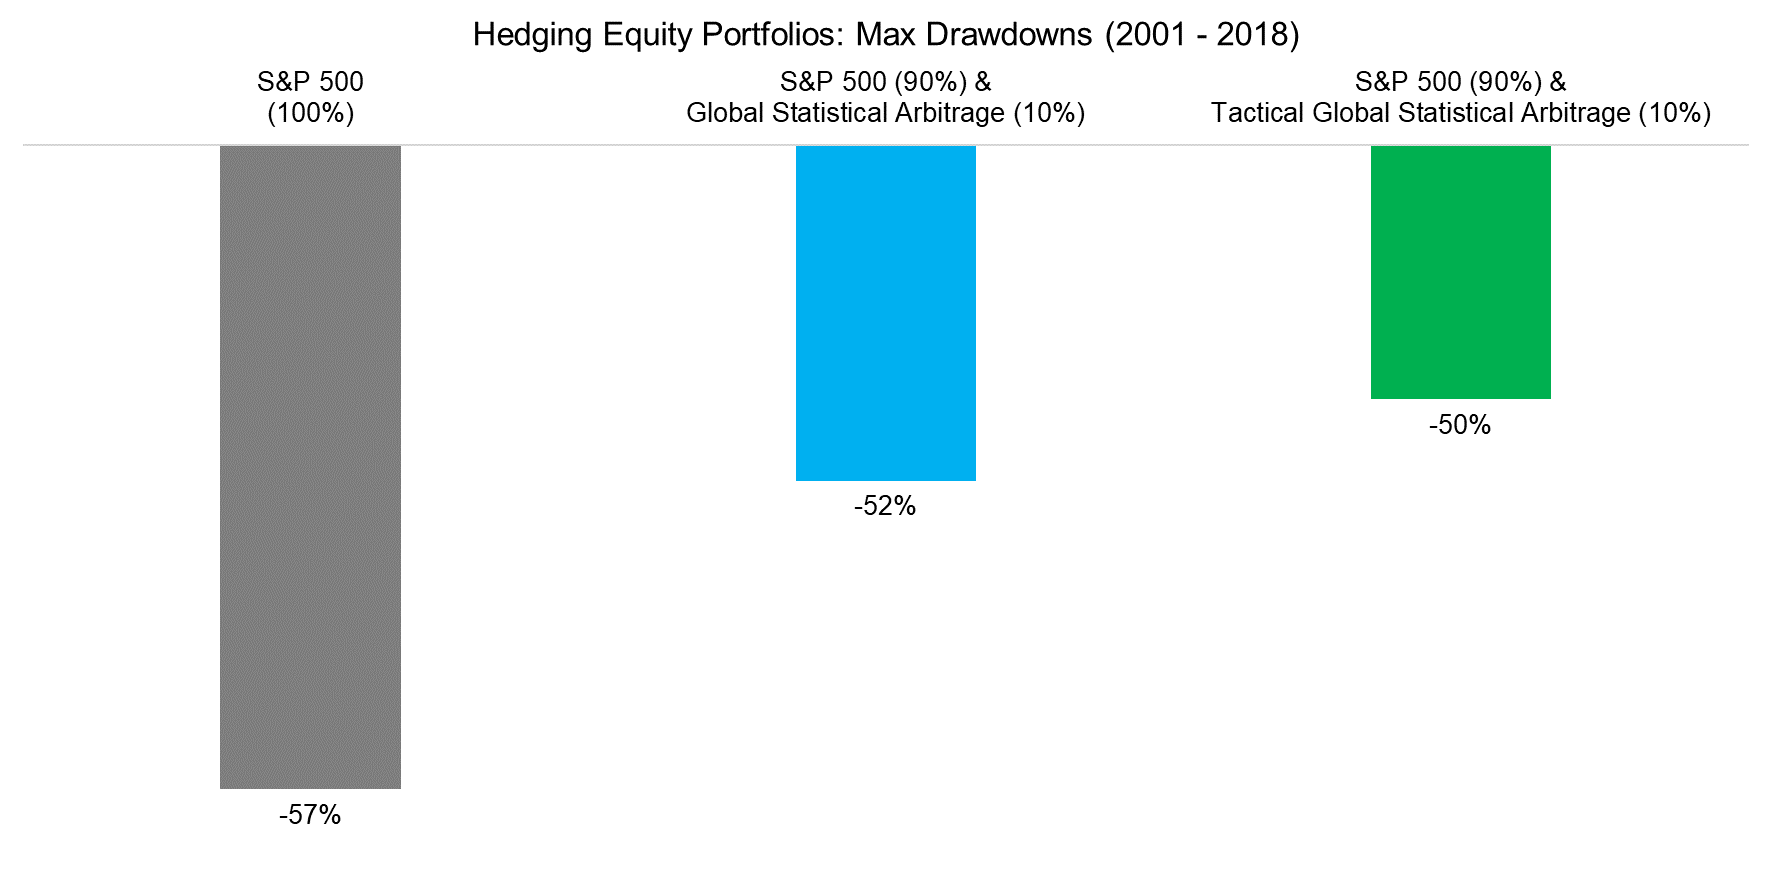
It is also worth highlighting a significant decrease in maximum drawdowns when adding an allocation to statistical arbitrage to an equity portfolio. Common equity factors like Quality or Low Volatility can also be used to hedge equity risk when structured as beta-neutral long-short portfolios, but the link to market volatility is less clear, which makes statistical arbitrage particular attractive.
Source: FactorResearch
FURTHER THOUGHTS
This short research note highlights that statistical arbitrage might be an attractive diversifier for an equity portfolio. Historically statistical arbitrage was only available to institutional investors via hedge funds, but more recently there have been attempts in the US to make the strategy available as a liquid alternative fund in the mutual fund format.
However, it is somewhat questionable if strategies like this are suitable for a wider investor audience given the complexity. It is also worth considering that the ongoing automation of financial markets likely reduces the expected returns, even when volatility will be high.
RELATED RESEARCH
ABOUT THE AUTHOR
Nicolas Rabener is the CEO & Founder of Finominal, which empowers professional investors with data, technology, and research insights to improve their investment outcomes. Previously he created Jackdaw Capital, an award-winning quantitative hedge fund. Before that Nicolas worked at GIC and Citigroup in London and New York. Nicolas holds a Master of Finance from HHL Leipzig Graduate School of Management, is a CAIA charter holder, and enjoys endurance sports (Ironman & 100km Ultramarathon).
Connect with me on LinkedIn or X.

