The Alpha Games: Technology Funds
And the winners are…
April 2023. Reading Time: 10 Minutes. Author: Nicolas Rabener.
SUMMARY
- US tech funds underperformed their benchmark indices by 4% between 2018 and 2022
- The factor contributions were marginal
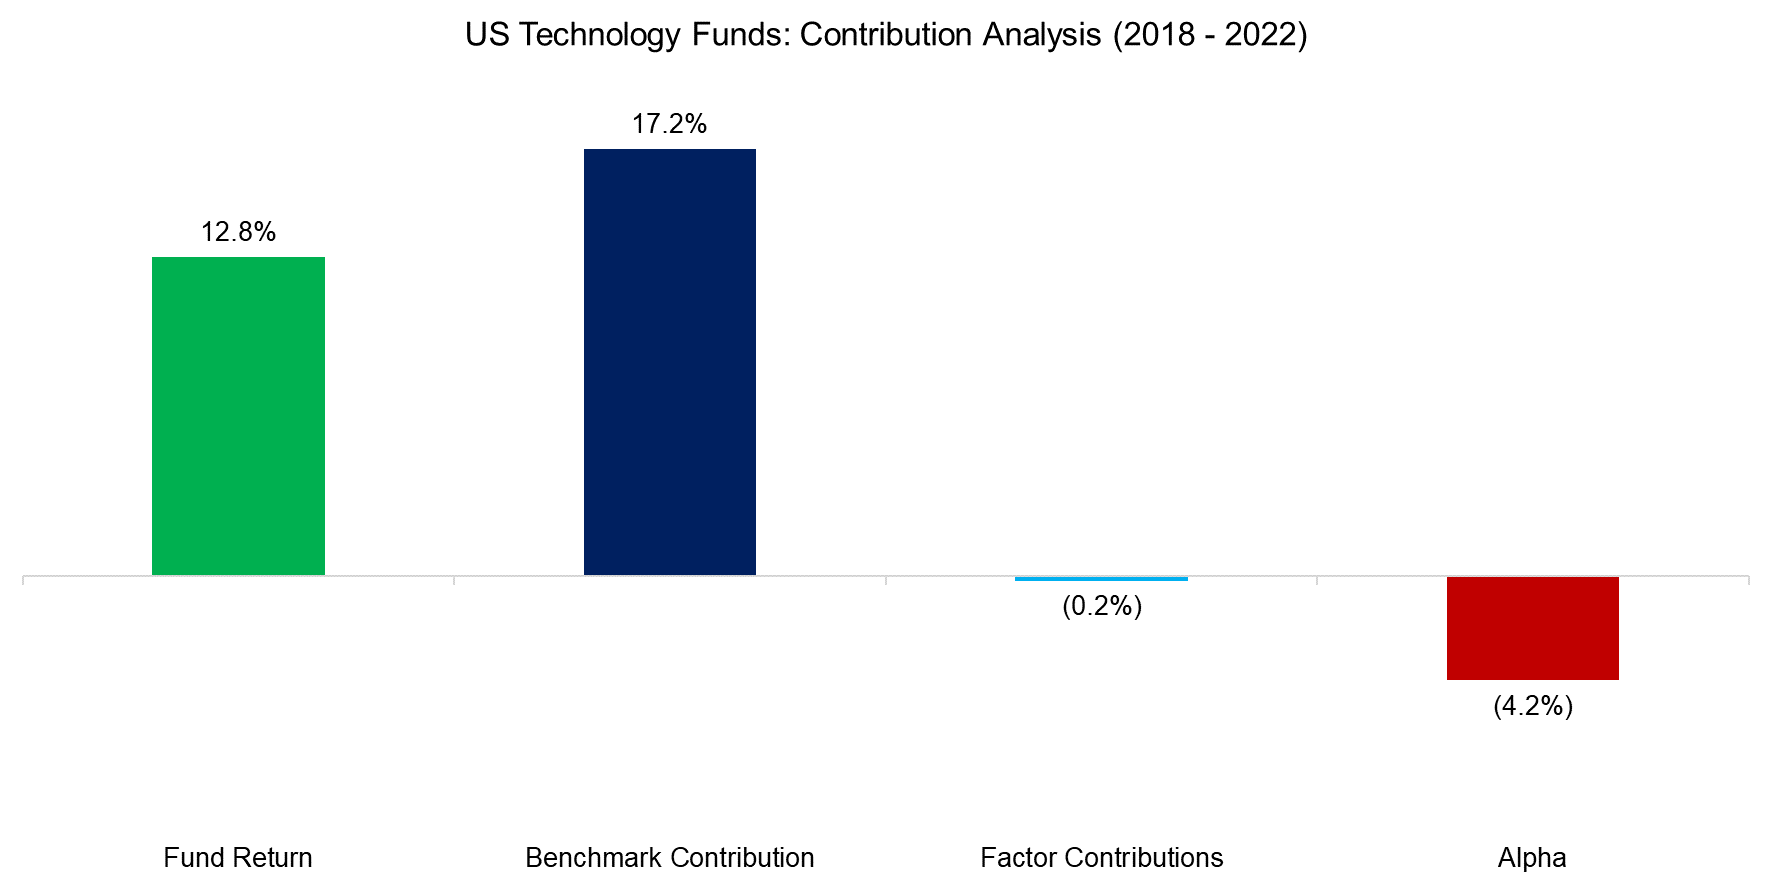
- This resulted in a median alpha of -4% over the 5-year period
INTRODUCTION
Every day, fortunes are won and lost on the stock market. However, investing in stocks is not a zero-sum game as wealth is created from the profits earned and distributed by public companies. In contrast, searching for alpha is a zero-sum game as for every investor that outperforms the stock market, there is one that underperforms it.
The search for alpha can be considered a fool’s journey as there is plenty of research that shows that few active managers create alpha, and even fewer achieve it consistently. Yet, still most investors believe in alpha and continue the pursuit of it.
In this article series, we evaluate the alpha generation of mutual funds and ETFs, starting with technology-focused funds. Let the games begin…
METHODOLOGY
We focus on mutual funds and ETFs trading in the US that focus on technology stocks. We exclude any funds with less than five years of performance history, which results in a universe of 94 funds for our analysis.
It is worth mentioning that we do not include any funds that have been liquidated, which implies that this analysis suffers from survivorship bias. Given that the poorly-performing funds are liquidated, this means that the median return of these funds will be overstated.
We use our proprietary benchmark selection method to automatically select the benchmark index that has the most similar sector exposure for each fund. In almost all cases, this results in the MSCI Information Technology Index.
However, there are a few exceptions where the name and classification of the fund are misleading. For example, our benchmark for the Kinetics Internet Fund (KINAX) is an energy index, which is explained by the fund’s largest holding being the Texas Pacific Land Corporation (TPL), an energy company, with a 33% weight. The fund uses the S&P 500 and Nasdaq as benchmark indices on its factsheet, which highlights the value of an automated and unbiased benchmarking process (read Mirror, Mirror, on the Wall, which is the Fairest Benchmark of All?).
Computing the median fund return highlights that these funds underperformed their benchmarks by 4% in the five years between 2018 and 2022, which includes a boom and bust in technology stocks.

Source: Finominal
FACTOR EXPOSURE ANALYSIS
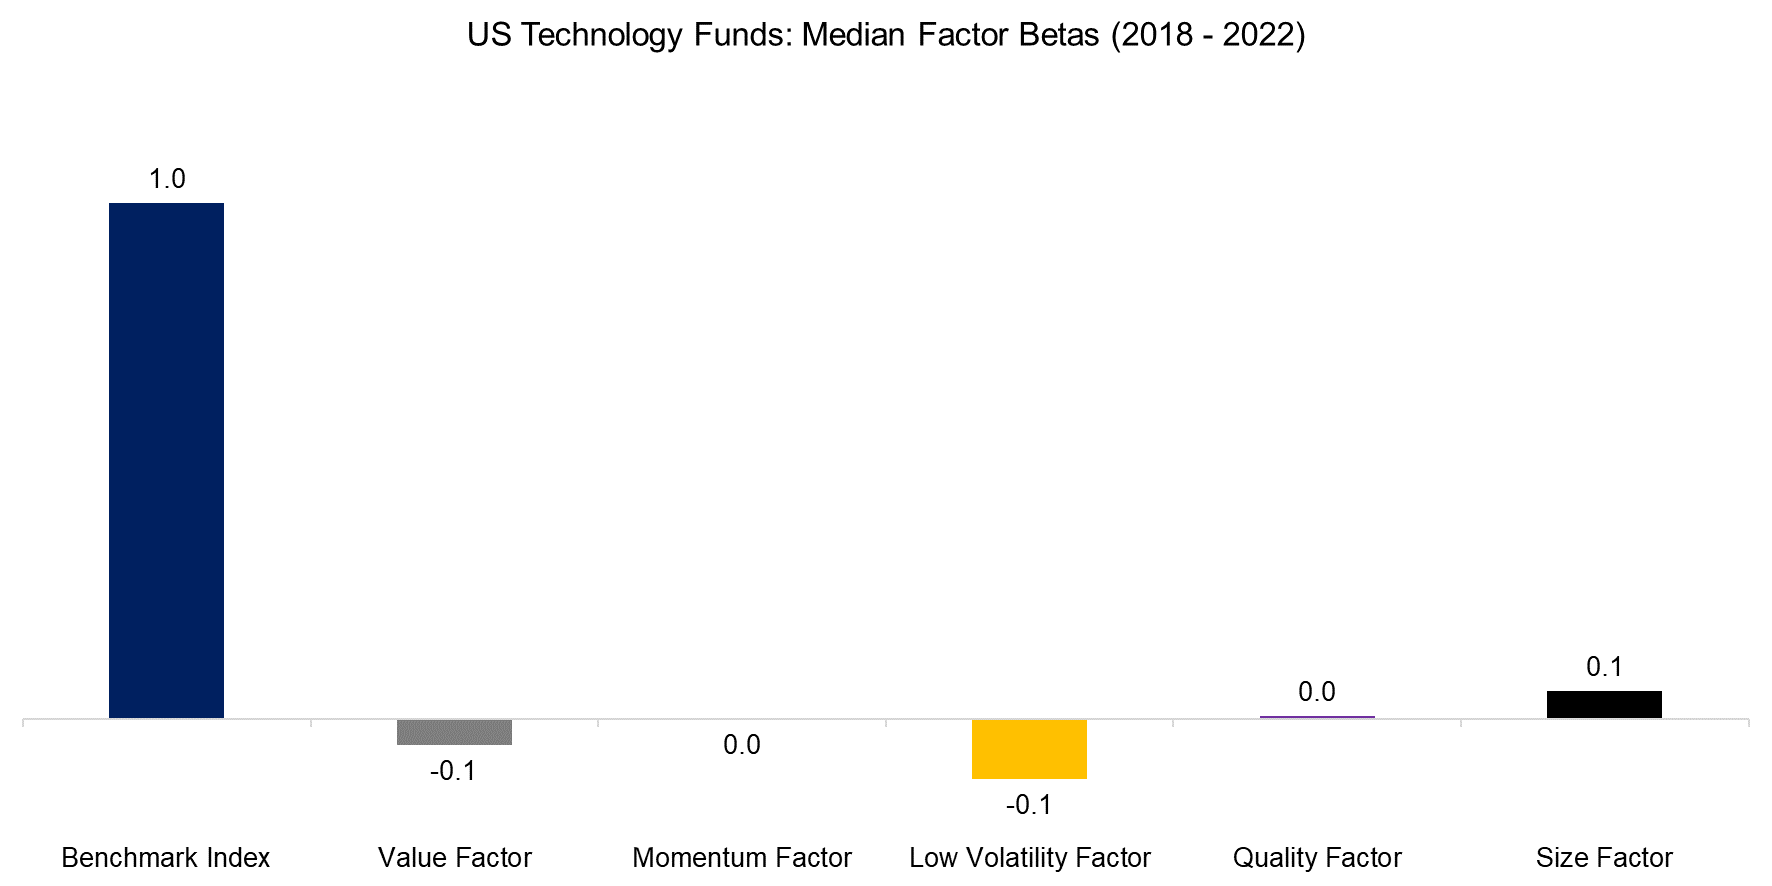
Next, we run a factor exposure analysis using five common equity factors with standard industry definitions. This highlights that these funds had betas of close to zero to the value, size, quality, momentum, and low volatility factors (read Factor Exposure Analysis 101: Linear vs Lasso Regression).
However, although the median factor betas are close to zero, there is a dispersion amongst funds with betas ranging from +1.1 to -1.1 across the factors, which indicates differentiated portfolios. Some are concentrated while others are diversified and the geographical exposure diverges also significantly.

Source: Finominal
FACTOR CONTRIBUTIONS
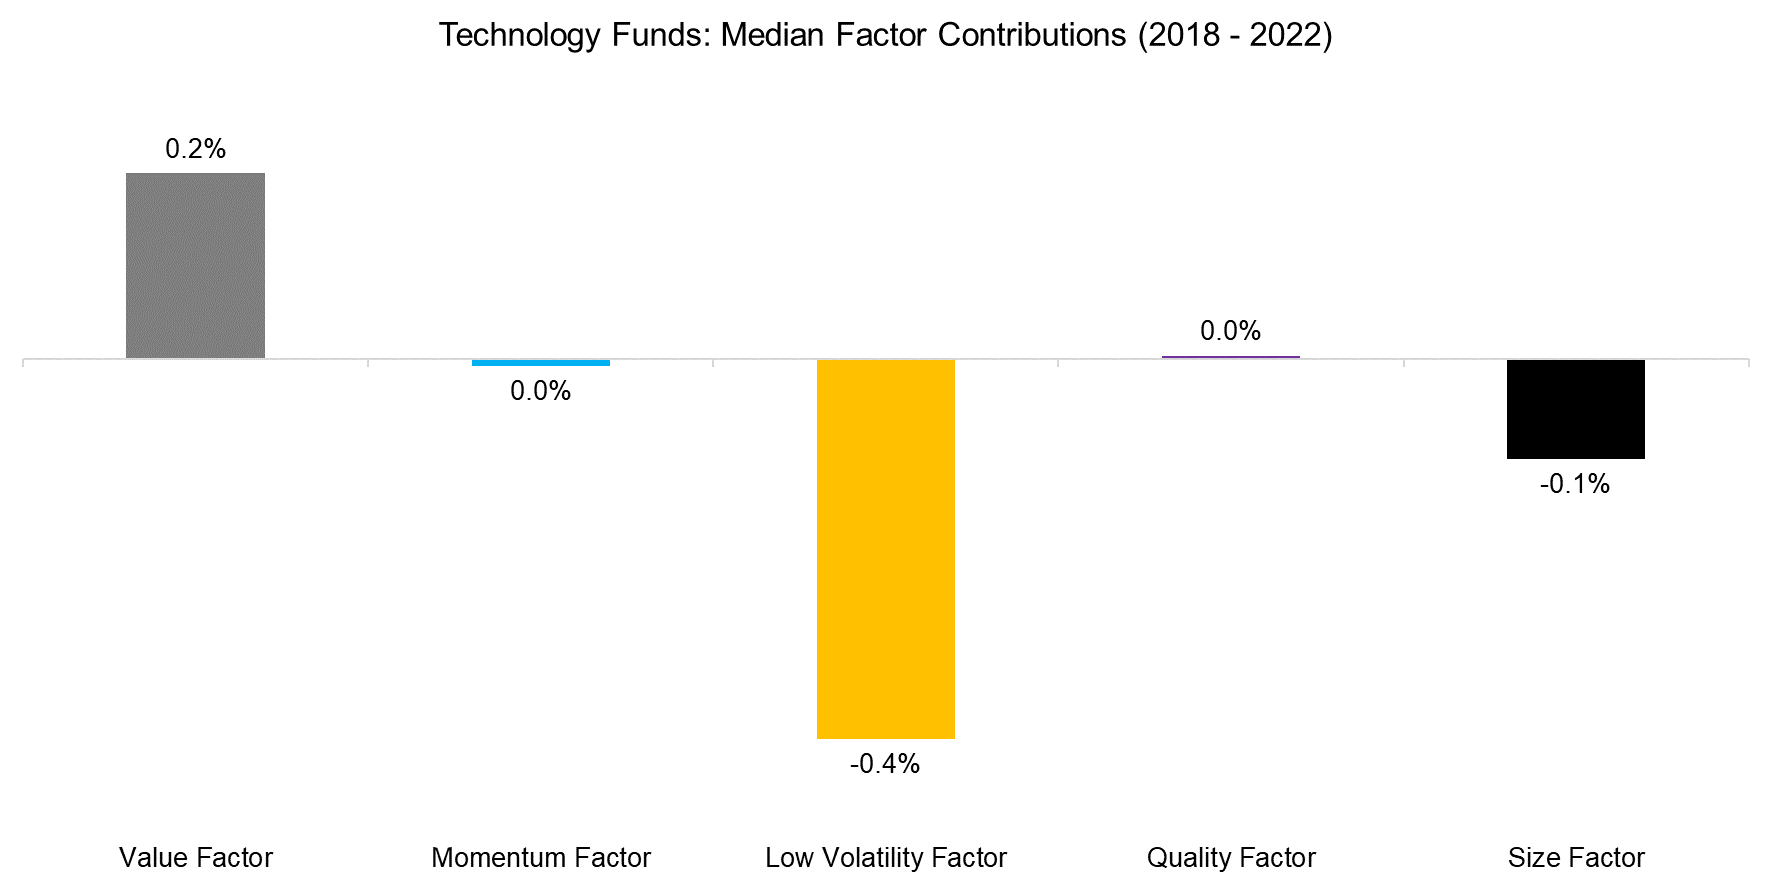
Given that the median factor betas of these funds were low, the factor contributions to the performance of these funds were minor. Intuitively investors might have expected that the value factor would have contributed most negatively as technology stocks tend to be expensive, but that was not the case. The slightly negative exposure of the value factor contributed positively as the factor performance was negative over the five-year period since 2018.

Source: Finominal
CONTRIBUTIONS ANALYSIS
Finally, we calculate the median alphas of technology funds, which was -4% in the period from 2018 to 2022 (read Outperformance Ain’t Alpha).
Given that factors only contributed insignificantly to the funds’ performance, investors would have been better off simply holding the benchmark indices. The value destruction can be explained by fees, transaction costs, poor stock selection and portfolio construction.

Source: Finominal
TOP 10 ALPHA FUNDS
Research from S&P SPIVA shows that fund managers struggle to consistently outperform their benchmarks, which makes fund rankings debatable. The ranking below shows the funds that generated the most alpha, but should be used to identify trends rather than funds.
We observe that the alpha was relatively low with only two out of the top 10 funds achieving more than 5% over the five-year period from 2018 to 2022. Furthermore, most of these funds are ETFs that simply provide exposure to the semiconductor industry, which outperformed the broader technology sector since the COVID-19 crisis in 2020 given supply chain issues and rising demand for computer chips.
The case for active managers is to predict such trends and buy into such industries before they outperform. However, most of the top 10 funds are passive index-trackers and not actively managed products, which highlights the challenges of forecasting technology trends.

Source: Finominal
Reviewing the top 10 technology funds with the most negative alpha highlights an almost even split between ETFs and mutual funds. We also observe that four of these focus thematically on the internet, which perhaps reflects the violent repricing over some stocks like Zoom or Peleton that boomed during the COVID-19 crisis, but crashed thereafter.

Source: Finominal
FURTHER THOUGHTS
Although the pursuit of alpha may not be rational for capital allocators given the poor track record of active managers, stock markets need fund managers for pricing securities efficiently. If there were only passive investors, then fundamentals become less meaningful. Companies would still be bought based on their valuations or profitability, but only indirectly via ETFs offering certain exposures like value or quality or themes.
The rise of passive investing might even offer active managers better opportunities for generating alpha. Small companies might be discarded by index investors, but they can make fine investments and distribute cash back to their shareholders via dividends or stock buybacks.
Alpha is dead, long live alpha.
RELATED RESEARCH
Outperformance Ain’t Alpha
Less Efficient Markets = Higher Alpha?
Smart Beta vs Alpha + Beta
Alpha Generation: The Search for the Unexplainable
Sector vs Factor-based Benchmark Selection
Mirror, Mirror, on the Wall, which is the Fairest Benchmark of All?
Factor Exposure Analysis 101: Linear vs Lasso Regression
REFERENCED RESEARCH
S&P SPIVA Scorecards
ABOUT THE AUTHOR
Nicolas Rabener is the CEO & Founder of Finominal, which empowers professional investors with data, technology, and research insights to improve their investment outcomes. Previously he created Jackdaw Capital, an award-winning quantitative hedge fund. Before that Nicolas worked at GIC and Citigroup in London and New York. Nicolas holds a Master of Finance from HHL Leipzig Graduate School of Management, is a CAIA charter holder, and enjoys endurance sports (Ironman & 100km Ultramarathon).
Connect with me on LinkedIn or X.

