Factor Exposure Analysis 100: Holdings vs Regression-Based
Searching for Truth
October 2019. Reading Time: 10 Minutes. Author: Nicolas Rabener.
SUMMARY
- Factor exposure analysis is essential for performance and risk contribution
- However, the results vary depending on methodologies, factor definitions, and other assumptions
- A holdings-based approach is preferable over regression analysis
INTRODUCTION
A large part of a capital allocator’s job is to be a detective and solve puzzles. A never-ending puzzle is explaining past performance and risk drivers, especially when capital allocations went wrong as humans suffer from a negativity bias, which is the notion of being more influenced by negative than neutral or positive events.
For example, there will be far more scrutiny of a fund manager that has underperformed compared to one that has outperformed his benchmark, although both should deserve equal attention. Although fund managers insist on being highly skilled, most excess returns, regardless if positive or negative, are explained by simple exposure to systematic factors.
A popular tool for detective work on fund managers is factor exposure analysis, which provides essential insight into which factors have been driving past performance. However, there are different methodologies and data sources that can be used, which make such an exercise as much an art as a science.
In this short research note, we will highlight the complexity of factor exposure analysis by investigating the performance drivers of a relatively simple equity portfolio.
CLASSIC MULTI-FACTOR STRATEGY IN EUROPEAN EQUITIES
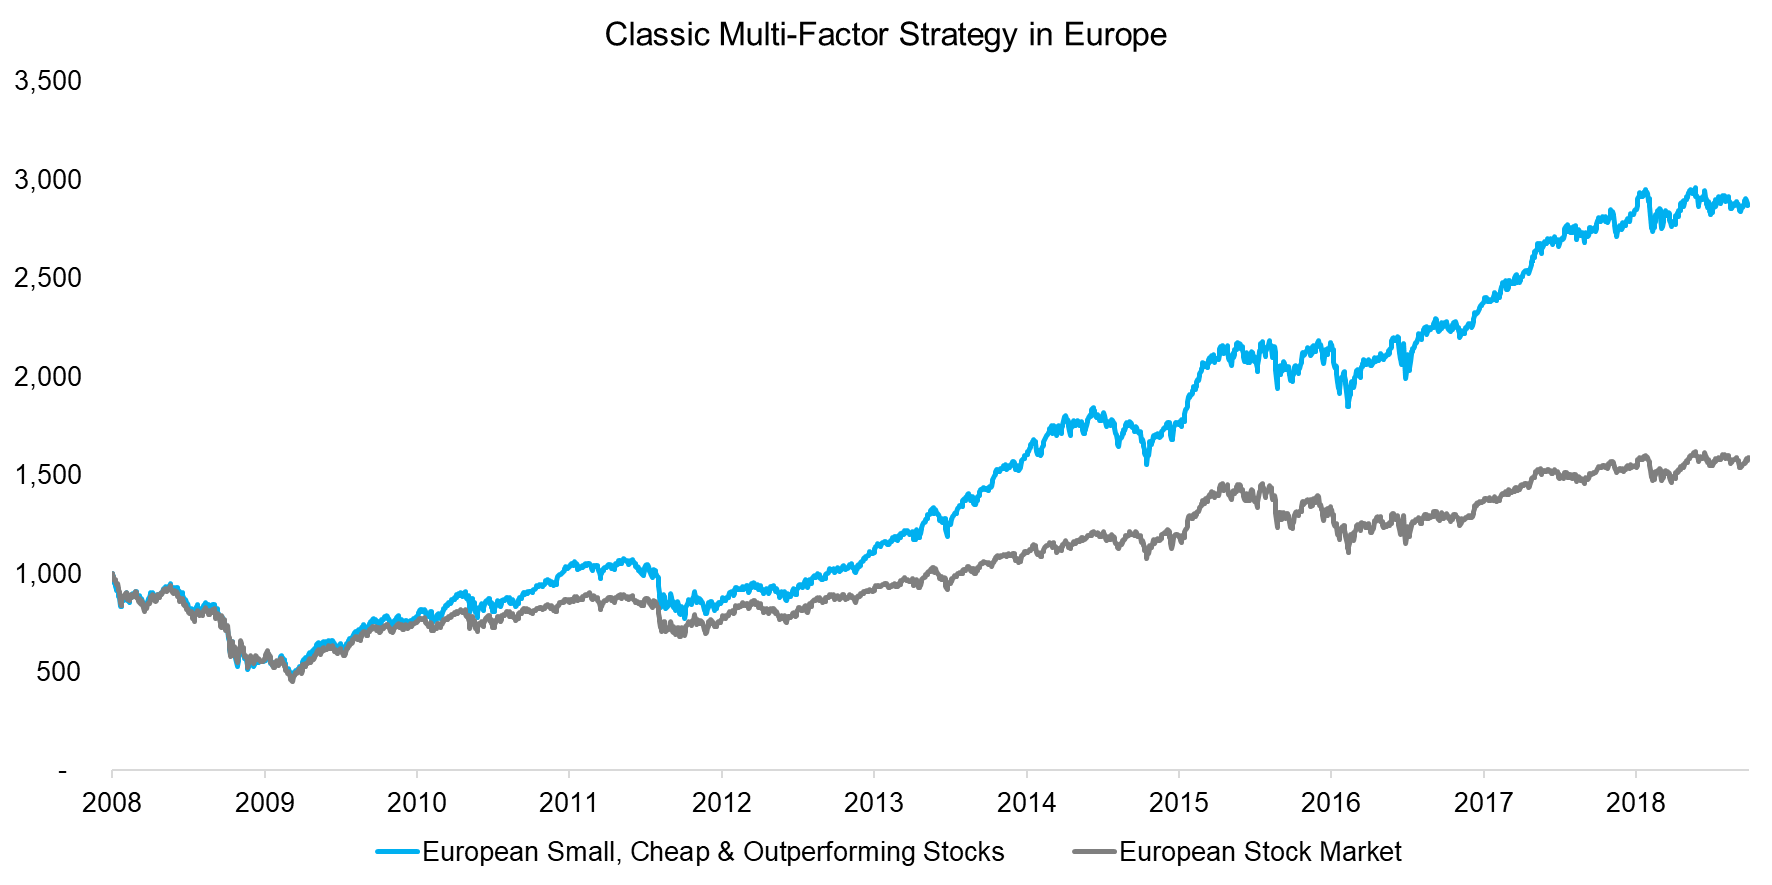
We define the investible universe as all European stocks with a minimum market capitalization of $1 billion and utilize the sequential model to create a long-only multi-factor portfolio. First, we select the smallest 50% of all stocks ranked by market capitalization, then take this portfolio and select the cheapest 50% of stocks ranked by a combination of price-to-book and price-to-earnings multiples, and finally select the best performing 50% of stocks from this portfolio ranked by their 12-month performance, excluding the most recent month (read Multi-Factor Models 101).
The final portfolio features approximately 140 stocks that are small, cheap, and outperforming, which represents a classic multi-factor strategy. We observe that the strategy would have been attractive as it outperformed its European benchmark index significantly from 2012 onward.
Source: FactorResearch
Factor exposure analysis can be conducted top-down by regression analysis or bottom-up via a holdings-based approach. The former only requires return data while the latter demands the portfolio constituents and factor ranks for all stocks, which makes it the more complex approach from a data and computational perspective. Given different methodologies, the results will likely be only approximately similar (read Factor Exposure Analysis: Dow Jones).
FACTOR EXPOSURE ANALYSIS: HOLDINGS-BASED
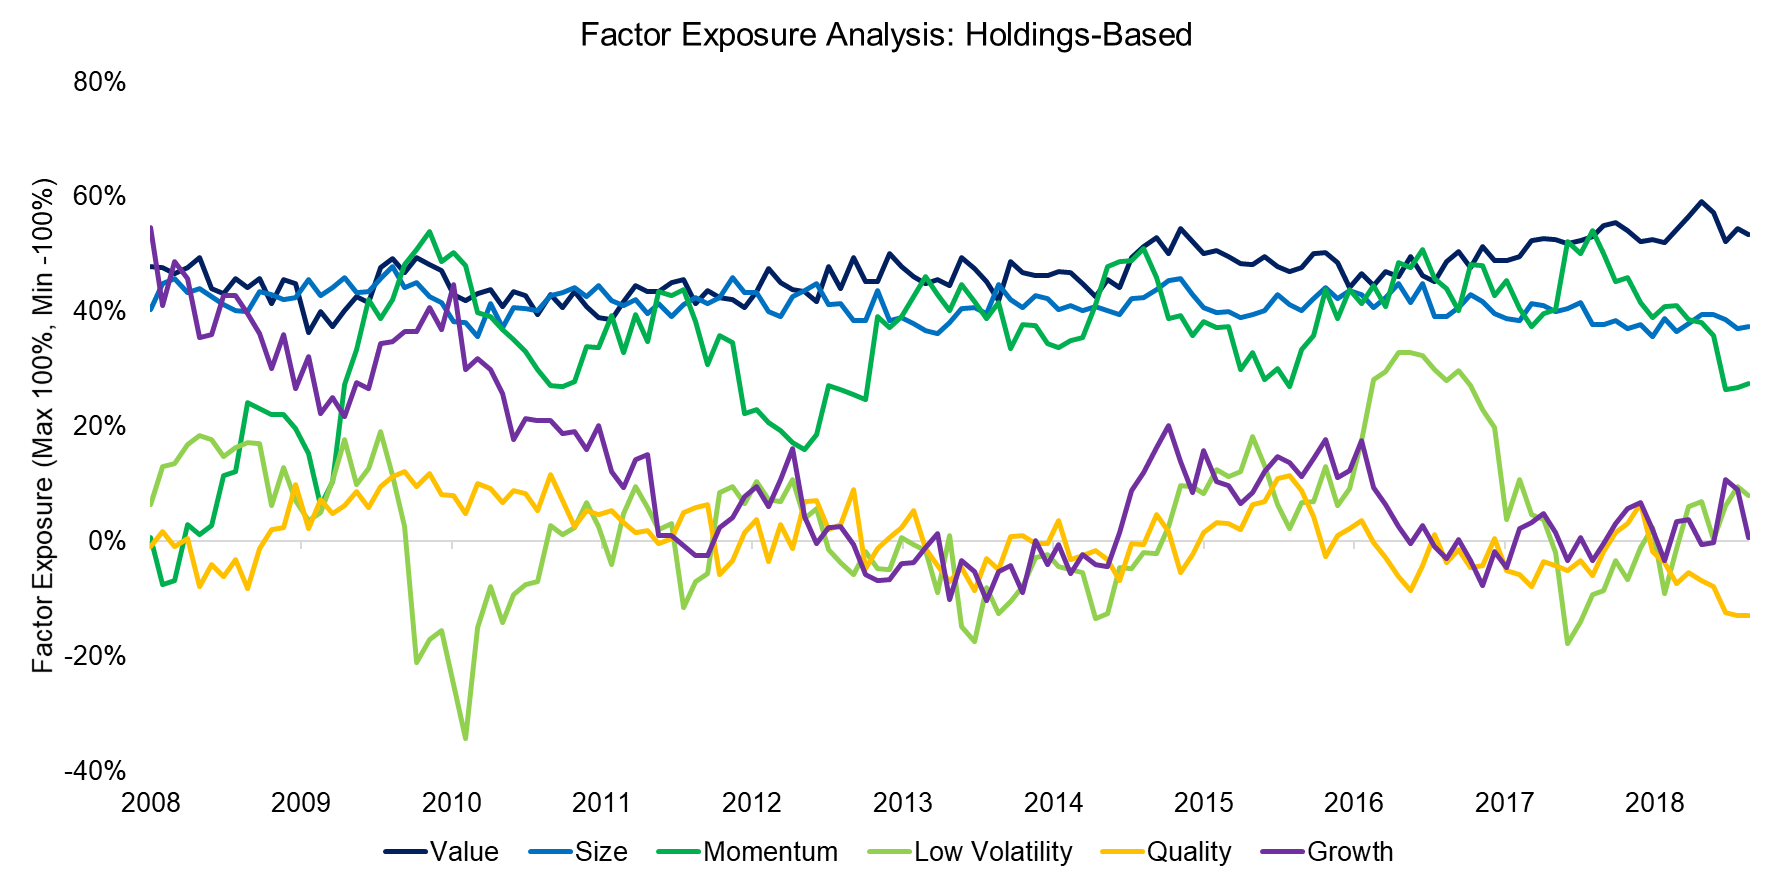
We generate a holdings-based factor exposure analysis and observe that the strategy had significant exposure to the Size, Value, and Momentum factors, which is expected given that the portfolio was constructed to contain small, cheap, and outperforming stocks.
It is interesting to note that the exposure to the Momentum factor was not as consistently high as to the Value and Size factors, which is a consequence of using the sequential model for portfolio construction. For example, in the global financial crisis from 2008 to 2009 there were few stocks that were cheap and outperforming, which explains why the exposure to Momentum was low during that period.
Source: FactorResearch
FACTOR EXPOSURE ANALYSIS: REGRESSION-BASED
Next, we conduct a top-down factor exposure analysis using regression analysis, which is the most commonly used methodology as historic holdings data is typically not easily available for funds or complex to analyse in the case of multi-asset portfolios.
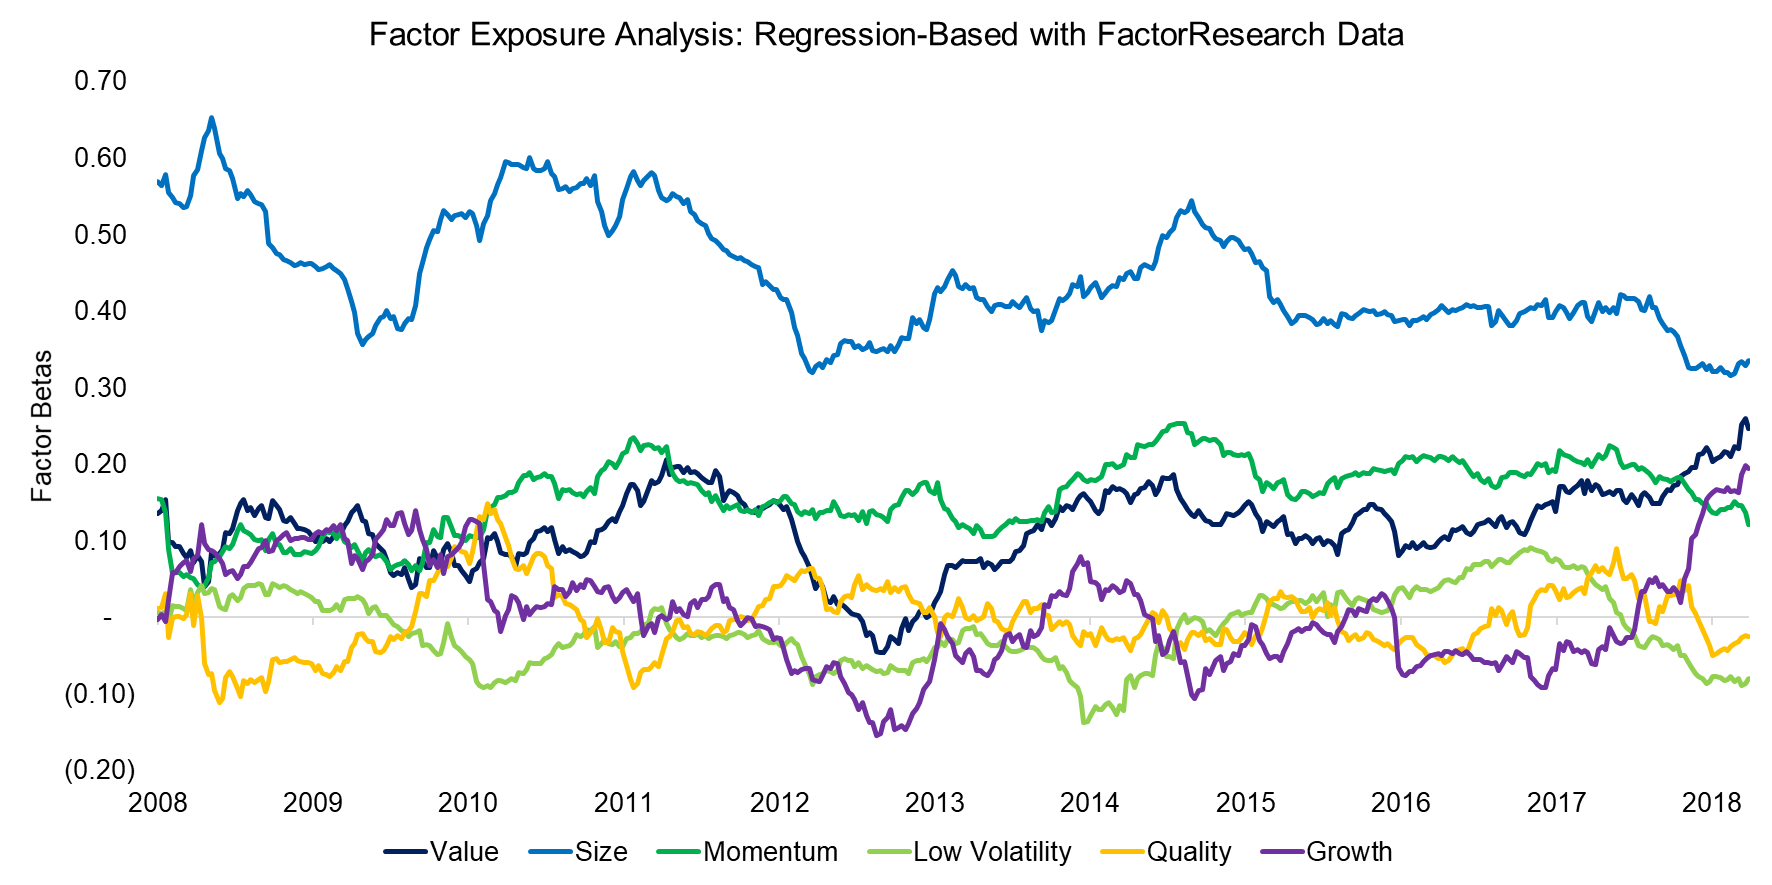
Somewhat surprising, we observe a significantly different result compared to the holdings-based analysis. Specifically, the result shows a portfolio that had large positive exposure to the Size factor and only moderately positive exposure to Value and Momentum. Given that the portfolio was created by first sorting for small stocks, this is not unreasonable.
However, investors might be confused given that the holdings-based analysis highlighted almost equal exposure to the Value, Size, and Momentum factors.
Source: FactorResearch
Given that a capital allocator would likely appreciate certainty in understanding which factors have been driving the portfolio’s performance, we can use external factor data and hope that this will clarify the slightly conflicting results between the bottom-up and top-down results.
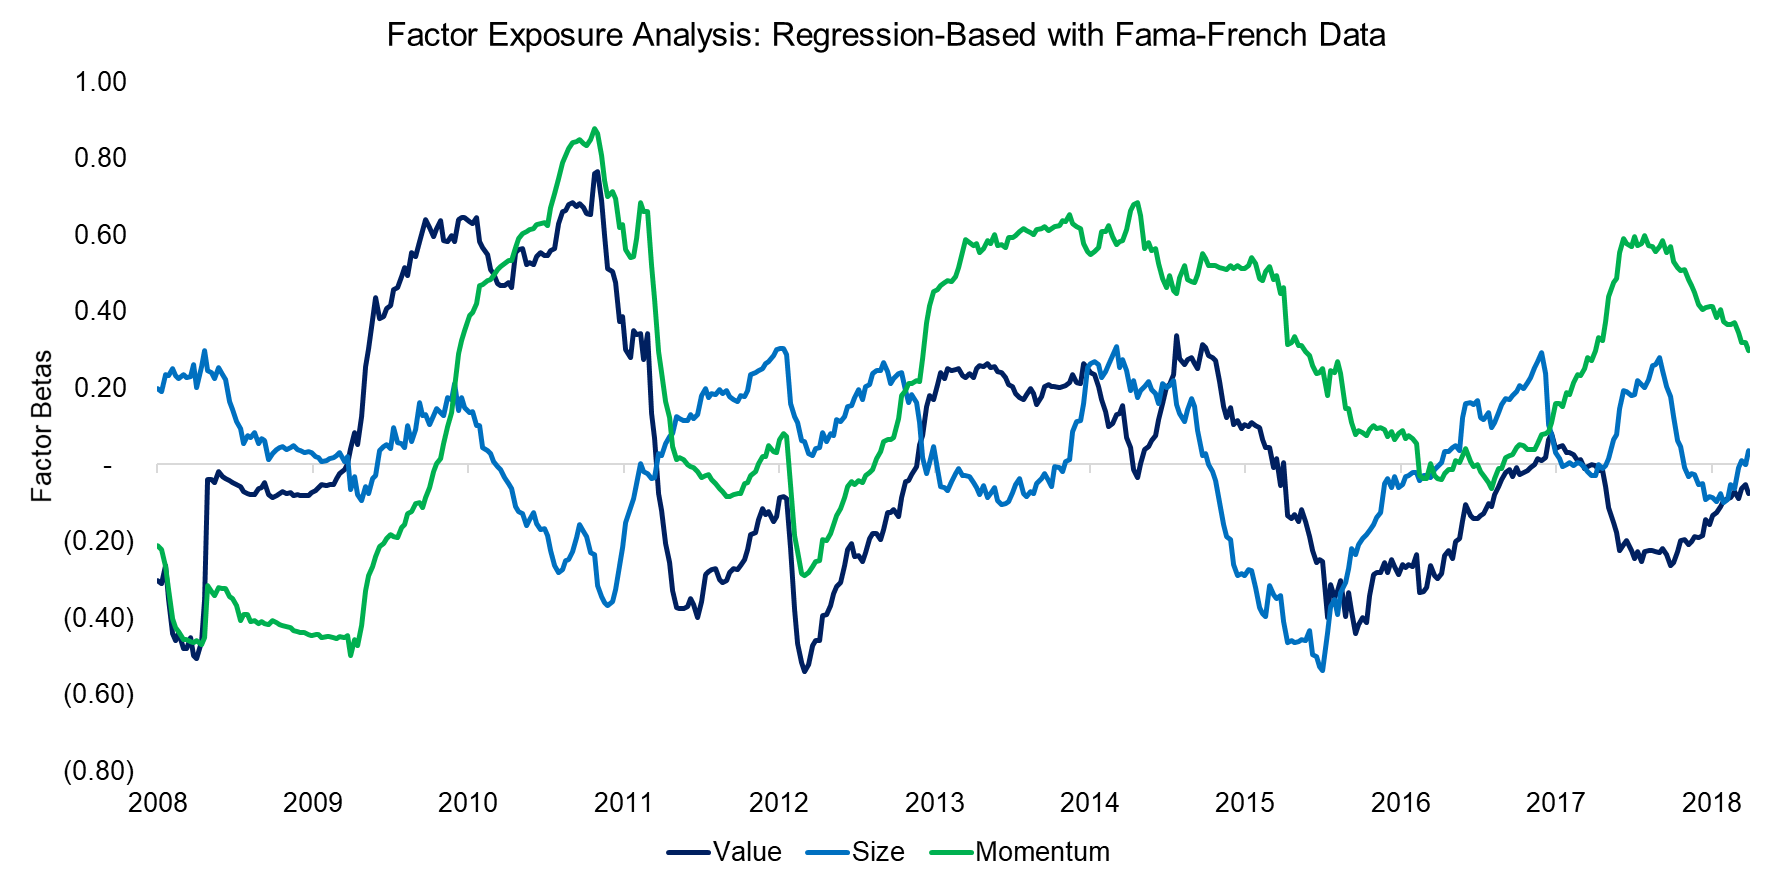
We conduct a second regression analysis using public factor data from the Kenneth R. French data library. It is worth noting that this data set does not include Low Volatility, Quality, or Growth factors.
Unfortunately, this analysis highlights factor exposures that are even more different than the two initial results. We observe that the exposure to the Value, Size, and Momentum factors was more extreme as measured by the factor betas across time, but on average almost zero. Given that the portfolio consists of small, cheap, and outperforming stocks, this is naturally highly unusual.
Source: Kenneth R. French, FactorResearch
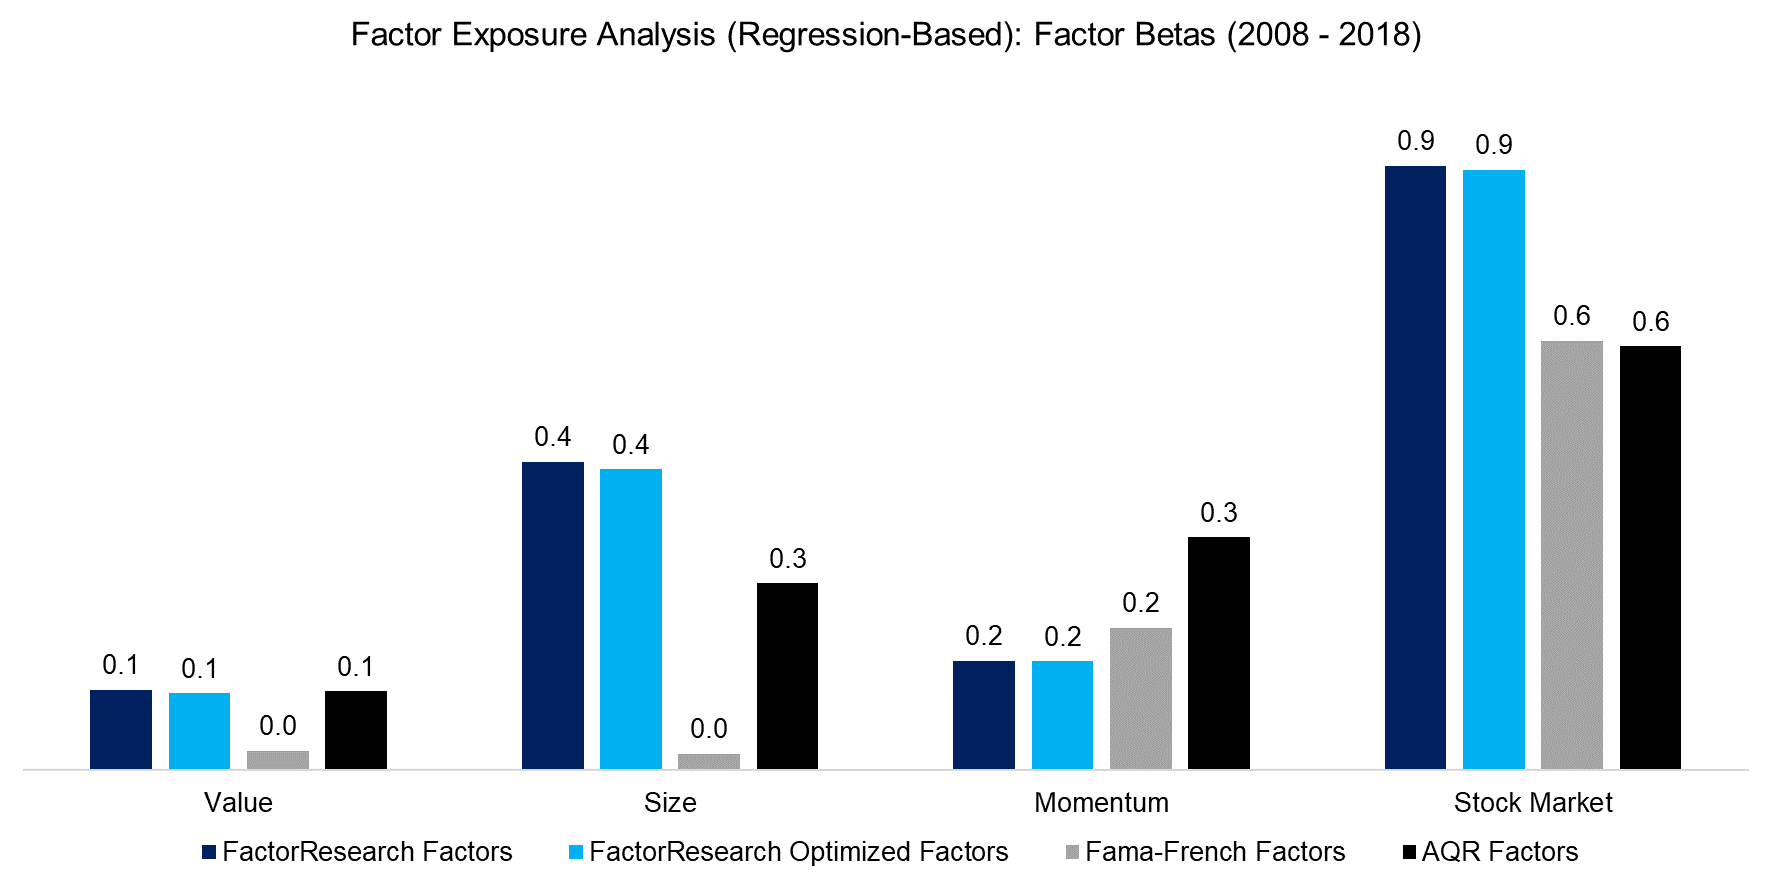
Finally, we aggregate the initial results and add additional analysis that was generated by using public data from AQR as well as FactorResearch optimized factors, which reduce the exposure to other common equity factors and are also called pure or residual factors.
We observe the following:
- Given that the strategy is long-only, most of the returns are explained by the stock market.
- FactorResearch factors (R2 of 0.91): High positive exposure to the Size and moderately positive exposure to Value and Momentum factors. Zero exposure to other factors on average.
- FactorResearch optimized factors (R2 of 0.90): Almost the same factor betas as when using simple factors.
- Fama-French factors (R2 of 0.61): High positive exposure to Momentum, but almost zero exposure to other factors.
- AQR factors (R2 of 0.80): High positive exposure to Momentum and moderate positive exposure to Value and Size.
In summary, using FactorResearch and AQR data results in similar factor exposures that highlight that the strategy’s performance can be attributed to Size, Value, and Momentum, while Fama-French only reveals meaningful exposure to Momentum.
However, AQR defines its factors in accordance with Fama-French, which requires a further conceptual reconciliation. The contrasting result is likely explained by slight differences in portfolio construction, data sources, and definitions of the investible universe. Regression analysis is highly sensitive to the input parameters.
Source: Kenneth R. French, AQR, FactorResearch
FURTHER THOUGHTS
This analysis highlights the complexity of factor exposure analysis as the results depend on the methodology, factor definitions, number of factors, lookback periods, and other assumptions.
If holdings data is available, then a holdings-based approach can be considered superior to a regression analysis as the methodology provides a more precise perspective of the factor exposure of a portfolio at any given time. However, the results still depend on the definition of the factors and investible universe. Best practise is to define factors in line with academic and industry standards as well as considering practical implications such as a universe that is actually tradable.
Factor exposure analysis is theoretically easy, but requires thoughtful implementation.
RELATED RESEARCH
Factor Optimisation
Factor Exposure Analysis: Dow Jones
Factor Exposure: Smart Beta vs Mutual Funds
ABOUT THE AUTHOR
Nicolas Rabener is the CEO & Founder of Finominal, which empowers professional investors with data, technology, and research insights to improve their investment outcomes. Previously he created Jackdaw Capital, an award-winning quantitative hedge fund. Before that Nicolas worked at GIC and Citigroup in London and New York. Nicolas holds a Master of Finance from HHL Leipzig Graduate School of Management, is a CAIA charter holder, and enjoys endurance sports (Ironman & 100km Ultramarathon).
Connect with me on LinkedIn or X.

