
The Impact of Market Beta on Smart Beta Performance
Does it matter?
November 2026. Reading Time: 10 Minutes. Author: Nicolas Rabener.
SUMMARY
- The market betas of smart beta funds vary significantly
- The beta explains partially the underperformance of some strategies
- Value and growth stocks have the largest beta delta in 20 years
INTRODUCTION
Low volatility investing boomed in the 2010s as falling interest rates supported low-risk stocks like REITs and utility companies, which represent highly leveraged business models. Simultaneously, asset managers and associated academics fed the investment community a steady diet of papers that provided the research needed for investment decisions and for committees.
Most investors likely recall from these papers that low-risk stocks outperformed, which upended the central tenet of investing theory that higher risk is compensated with higher returns. Naturally, the fine print states that such stocks only outperform on a risk-adjusted basis.
Unfortunately, taking the largest low volatility ETF, Invesco’s S&P 500 Low Volatility ETF (SPLV), as a proxy, shows that it did neither over the last 15 years. Its CAGR was 10.1% with a Sharpe ratio of 0.59, compared to 14.1% and 0.73 for the S&P 500. Even its maximum drawdown was worse, at -36% versus -33%.
Although low volatility funds have disappointed investors, we should acknowledge that they were indeed less volatile than the broader stock market, with an annualized volatility of 14.5% versus 17.1%. SPLV’s beta to the S&P 500 was only 0.6.
This raises an interesting question: can we attribute SPLV’s underperformance – and that of smart beta funds in general – to their low market betas?
VALUE VS GROWTH PERFORMANCE
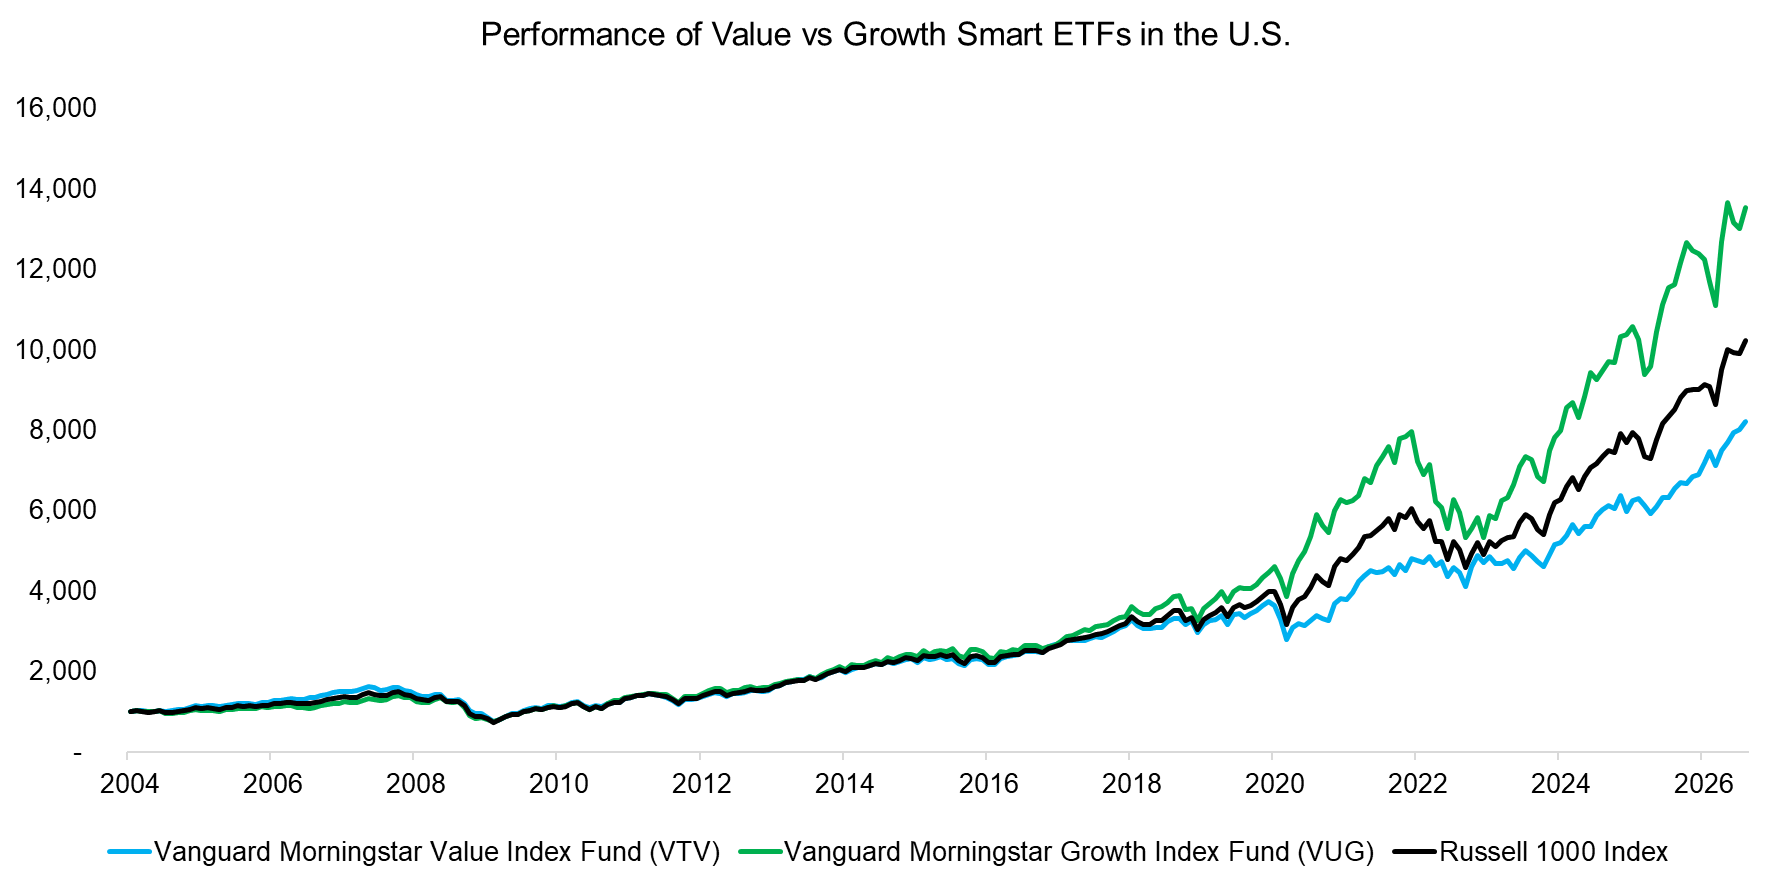
We will evaluate the impact of market beta on smart beta funds by studying the two largest investment strategies, value and growth stocks, as proxied by the Vanguard Morningstar Value Index Fund (VTV) and Vanguard Morningstar Growth Index Fund (VUG). A performance comparison highlights the significant outperformance of growth stocks versus both value stocks and the broad market since 2018.
Source: Finominal
BETAS TO THE STOCK MARKET
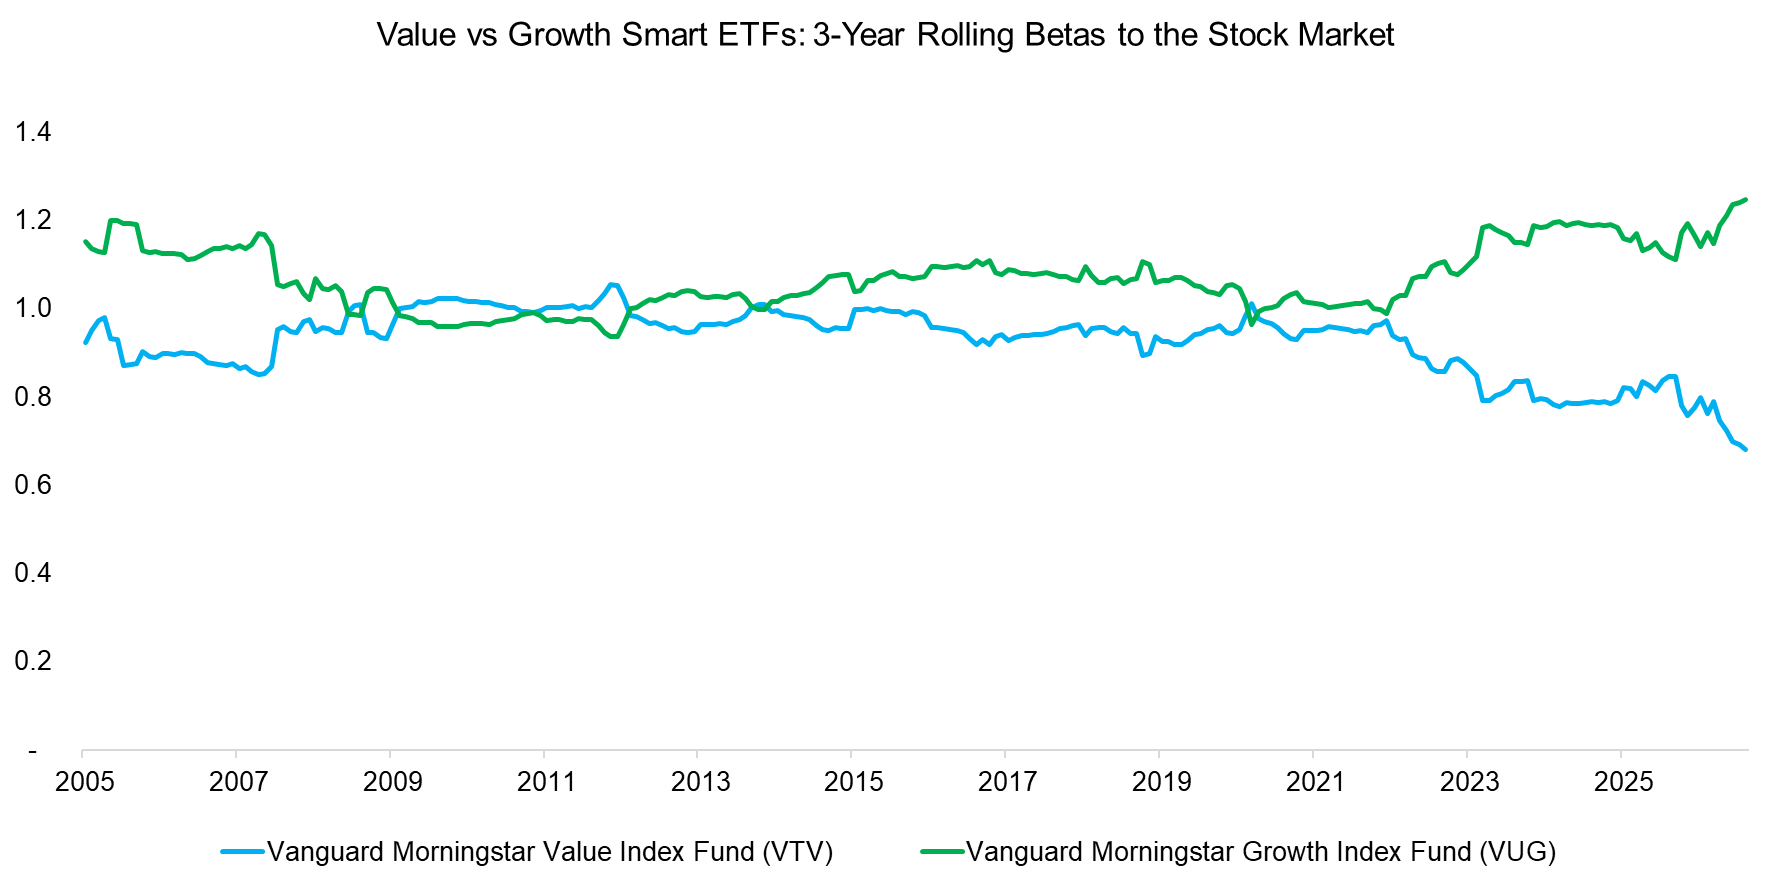
Next, we compute the 3-year rolling betas of value and growth stocks, which average 0.92 and 1.06 between 2005 and 2026, respectively. Only during the Global Financial Crisis in 2008 did growth stocks feature a beta below that of value stocks. The difference was also significant before 2007, and has been widening again since 2022. It is currently at its largest over the 20-year period, at 0.57.
Source: Finominal
BETA-ADJUSTED PERFORMANCE
Having a beta below one does not necessarily mean that a fund underperforms the market; it simply means the fund reacts less to market movements. However, in the case of the U.S. stock market, which has seen a significant increase in total market capitalization since 2005, a U.S. equity fund with a beta below 1 would likely have underperformed over the long period.
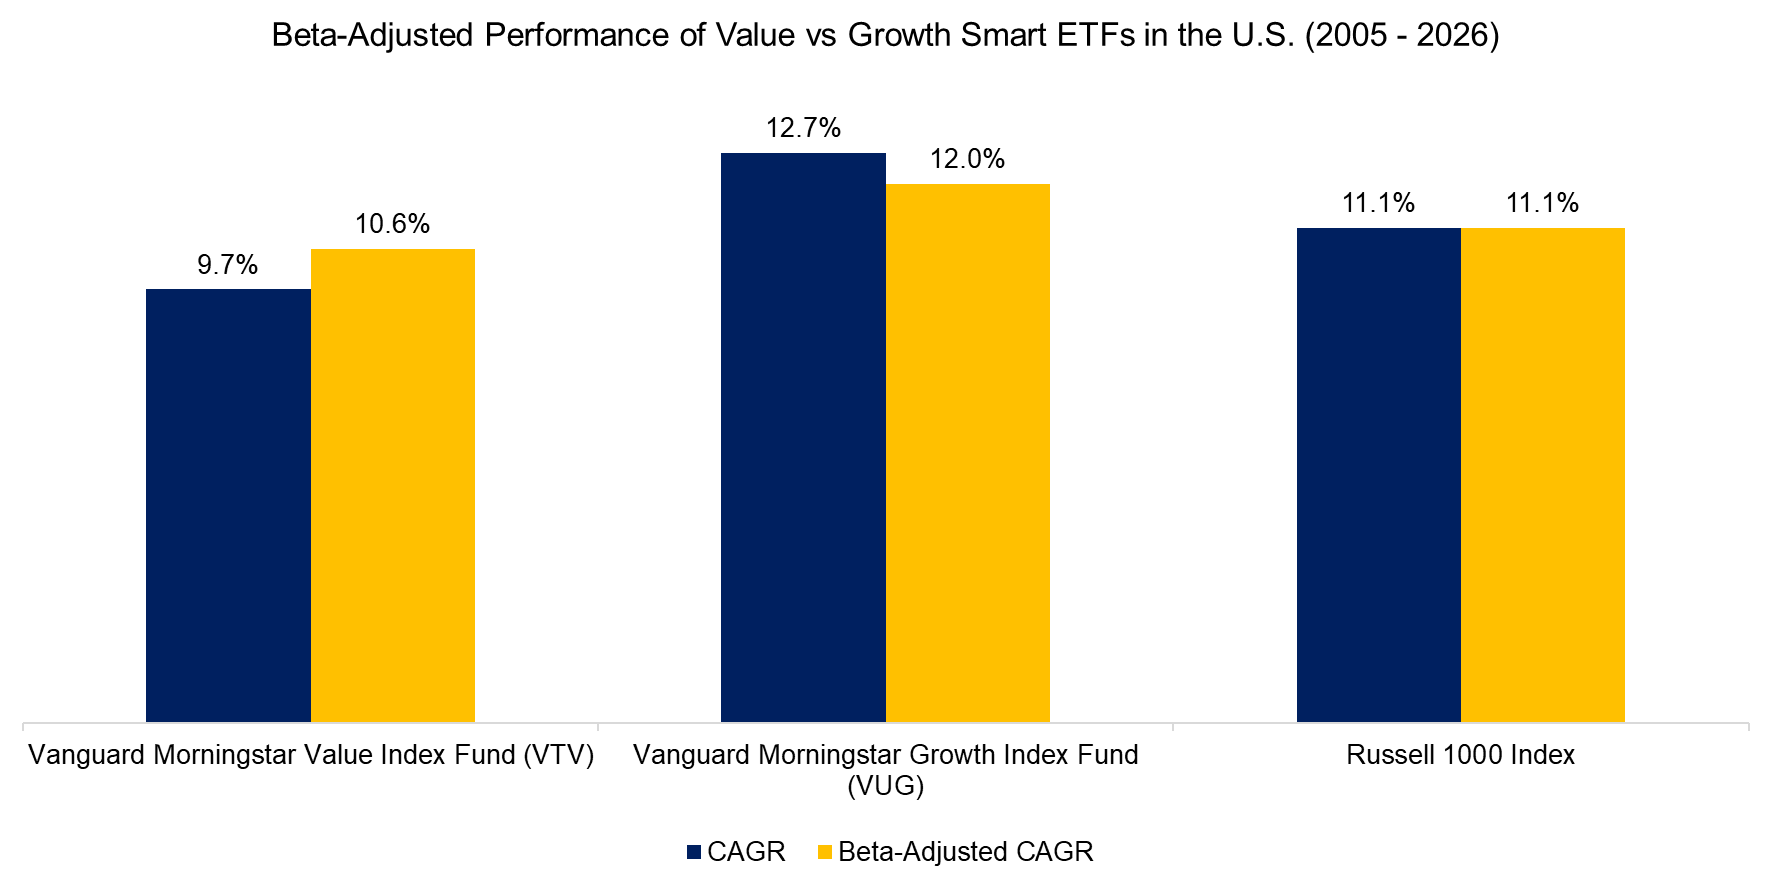
Given this, we adjust the returns of the value and growth smart beta ETFs using 3-year rolling betas to bring their betas closer to 1. For value, this essentially means leveraging up; for growth, deleveraging. We observe that VTV’s CAGR would have increased from 9.7% to 10.6%, and VUG’s would have decreased from 12.7% to 12.0%, compared to 11.1% for the market. This highlights that beta does impact performance, but it is not exclusively responsible for the under- or outperformance. The type of stocks, i.e., the factor exposures, and investors’ preferences for these explain the residual return.
Source: Finominal
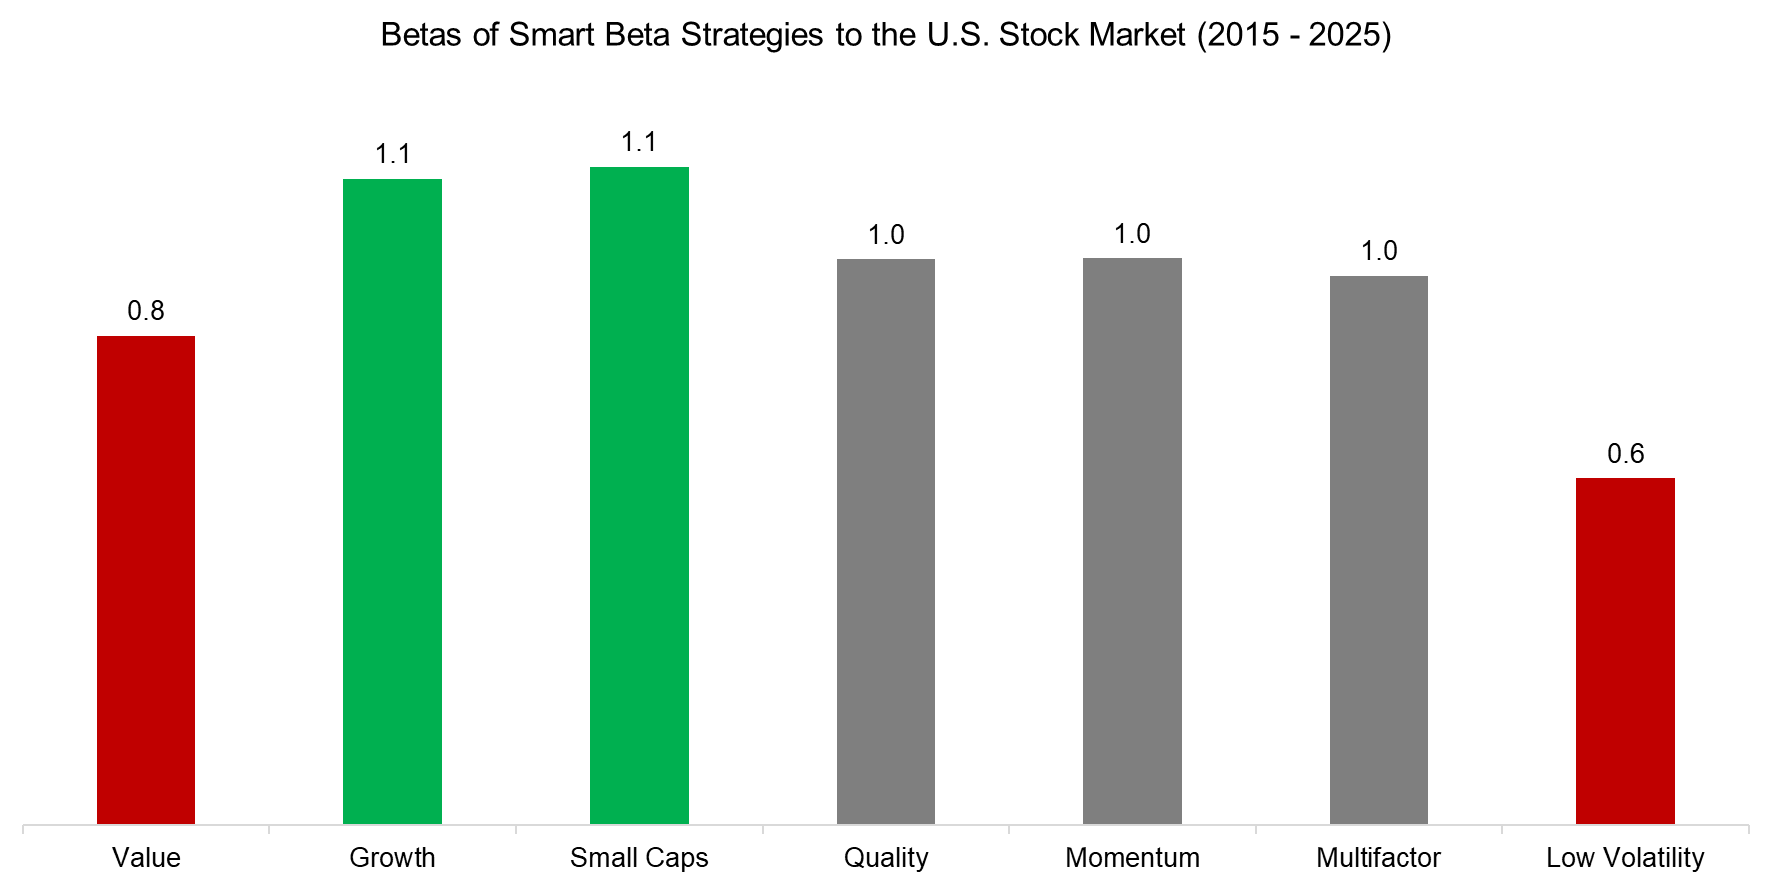
Finally, we measure the betas of the other major smart beta categories over the last 10 years. This highlights that only value and low volatility stocks feature betas meaningfully below one, while other styles are at or slightly above one.
Source: Finominal
FURTHER THOUGHTS
Should fund managers be concerned about running strategies with betas to the stock market below one?
It depends. For strategies marketed as defensive, a beta below one is the main selling point. However, such strategies should still produce a Sharpe ratio at least as high as that of the stock market, as otherwise investors can replicate the defensiveness more simply and cheaply with the S&P 500 and T-Bills.
For other fund managers, having a beta below one can be viewed as unattractive at times, especially in bullish markets, where their clients are likely to be more greedy than fearful. However, increasing the beta of a strategy is not easy for all investment strategies. It could be accomplished either via a more concentrated portfolio, which carries higher risk, or via derivatives, which add operational complexity.
RELATED RESEARCH
Timing Luck in Factor Investing
Market-Neutral versus Smart Beta Factor Investing
Factor Optimization via ETFs
Smart Beta ETF vs Customized Factor Portfolios
Factor Exposure Analysis 114: Factor Offsetting
Improving Smart Beta Attribution Analysis II
Quality in Small versus Large-Cap Stocks
The Illusion of the Small-Cap Premium
Shorting Lousy Stocks = Lousy Returns?
Higher Volatility, Higher Alpha?
Outperformance Ain’t Alpha
Improving the Odds of Value Investing
The Value Factor’s Pain: Are Intangibles to Blame?
Smart Beta vs Alpha + Beta
How Painful Can Factor Investing Get?
GARP Investing: Golden or Garbage? II
Are Low-Risk Stocks Really Low-Risk?
ABOUT THE AUTHOR
Nicolas Rabener is the CEO & Founder of Finominal, which empowers professional investors with data, technology, and research insights to improve their investment outcomes. Previously he created Jackdaw Capital, an award-winning quantitative hedge fund. Before that Nicolas worked at GIC and Citigroup in London and New York. Nicolas holds a Master of Finance from HHL Leipzig Graduate School of Management, is a CAIA charter holder, and enjoys endurance sports (Ironman & 100km Ultramarathon).
Connect with me on LinkedIn or X.