The Odd Factors: Profitability & Investment
Odd, but attractive?
November 2018. Reading Time: 10 Minutes. Author: Nicolas Rabener.
SUMMARY
- The Profitability factor generated attractive returns in the US and Europe since 1990
- It is difficult to explain why investors should be compensated for holding highly profitable companies
- The Investment factor was less attractive and is unusual from a financial analyst’s perspective
INTRODUCTION
Discretionary and systematic investors tend to have different perspectives on what works in the stock market. On the topic of factor investing, both types of investors tend to agree that Value is an attractive strategy. It is intuitively appealing to discretionary investors given that everyone likes bargains while systematic traders can rely on a significant amount of academic research. Views diverge on the Momentum factor, which is too simple for most discretionary investors while being a favorite amongst systematic investors. Finally, there the Profitability and Investment factors from 5-factor model of Fama-French and the Q-factor model from Zhang, which are challenging for both types of investors. In this short research note, we will analyze these two factors – Profitability and Investment – across markets.
METHODOLOGY
We focus on the Profitability and Investment factors in the US, European and Japanese stock markets. Profitability is defined as return-on-equity and investment as the one-year change in total assets. Factor performance is calculated by creating long-short beta-neutral portfolios comprised of the top and bottom 10% of the stocks ranked by the factor. Only stocks with a market capitalization of larger than $1 billion are included. Portfolios are rebalanced monthly and each transaction incurs costs of 10 basis points.
THE PROFITABILITY FACTOR ACROSS MARKETS
Profitability is a subset of the Quality factor and may be attractive in times of market stress as these stocks should outperform weaker ones. However, it is questionable if the Profitability factor should generate positive returns across time. It is challenging to derive a theory of why investors should be compensated for holding highly profitable companies (read Quality Factor: Zero Alpha for Most Investors?).
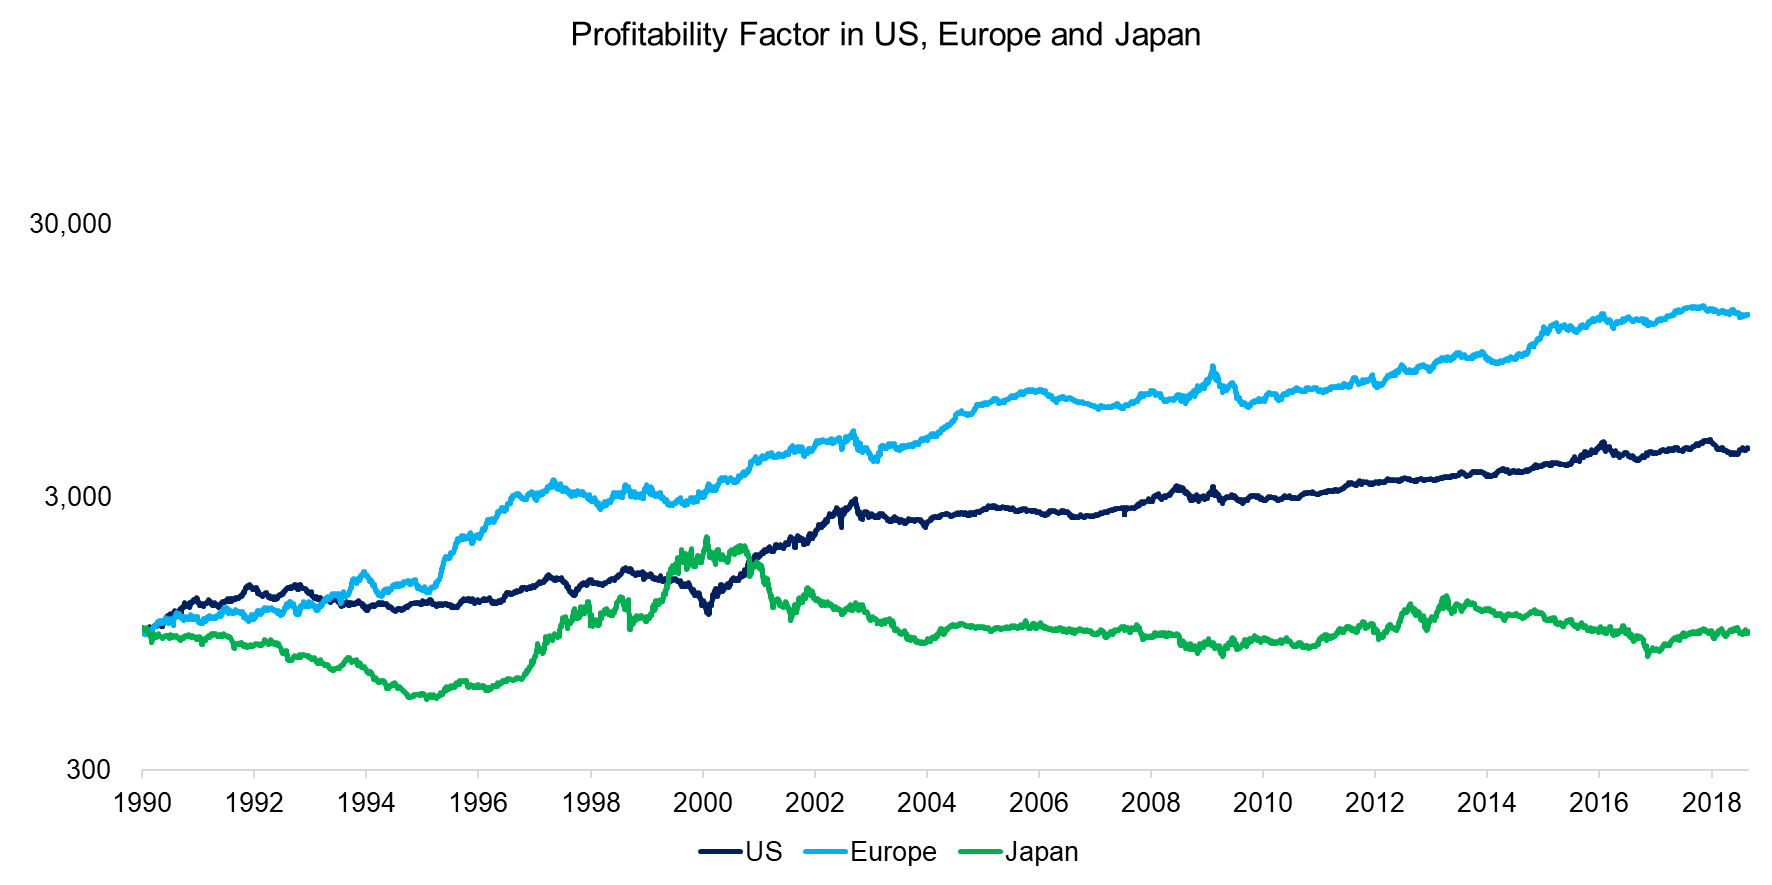
However, in contrast to our expectations, the long-short Profitability factor generated consistently positive returns in the US and Europe since 1990. The performance in Japan is flat, but not negative.
Source: FactorResearch
THE INVESTMENT FACTOR ACROSS MARKETS
Although it is theoretically challenging to argue why the Profitability factor should generate positive returns, the metric is widely accepted by financial analysts for evaluating stocks. Conversely, the Investment factor, which is defined as the annual asset growth, can be considered much more unusual when analyzing companies.
Assets might increase because of organic growth or acquisitions. They might decrease due to divestments of non-core assets or write-downs of goodwill. However, the fundamental link to the valuation of a company is much more opaque than with other financial metrics such as sales, profits, cashflow, margins or leverage. Although the factor might be interesting from an academic perspective for explaining returns, we see a limited relevance for financial analysts.
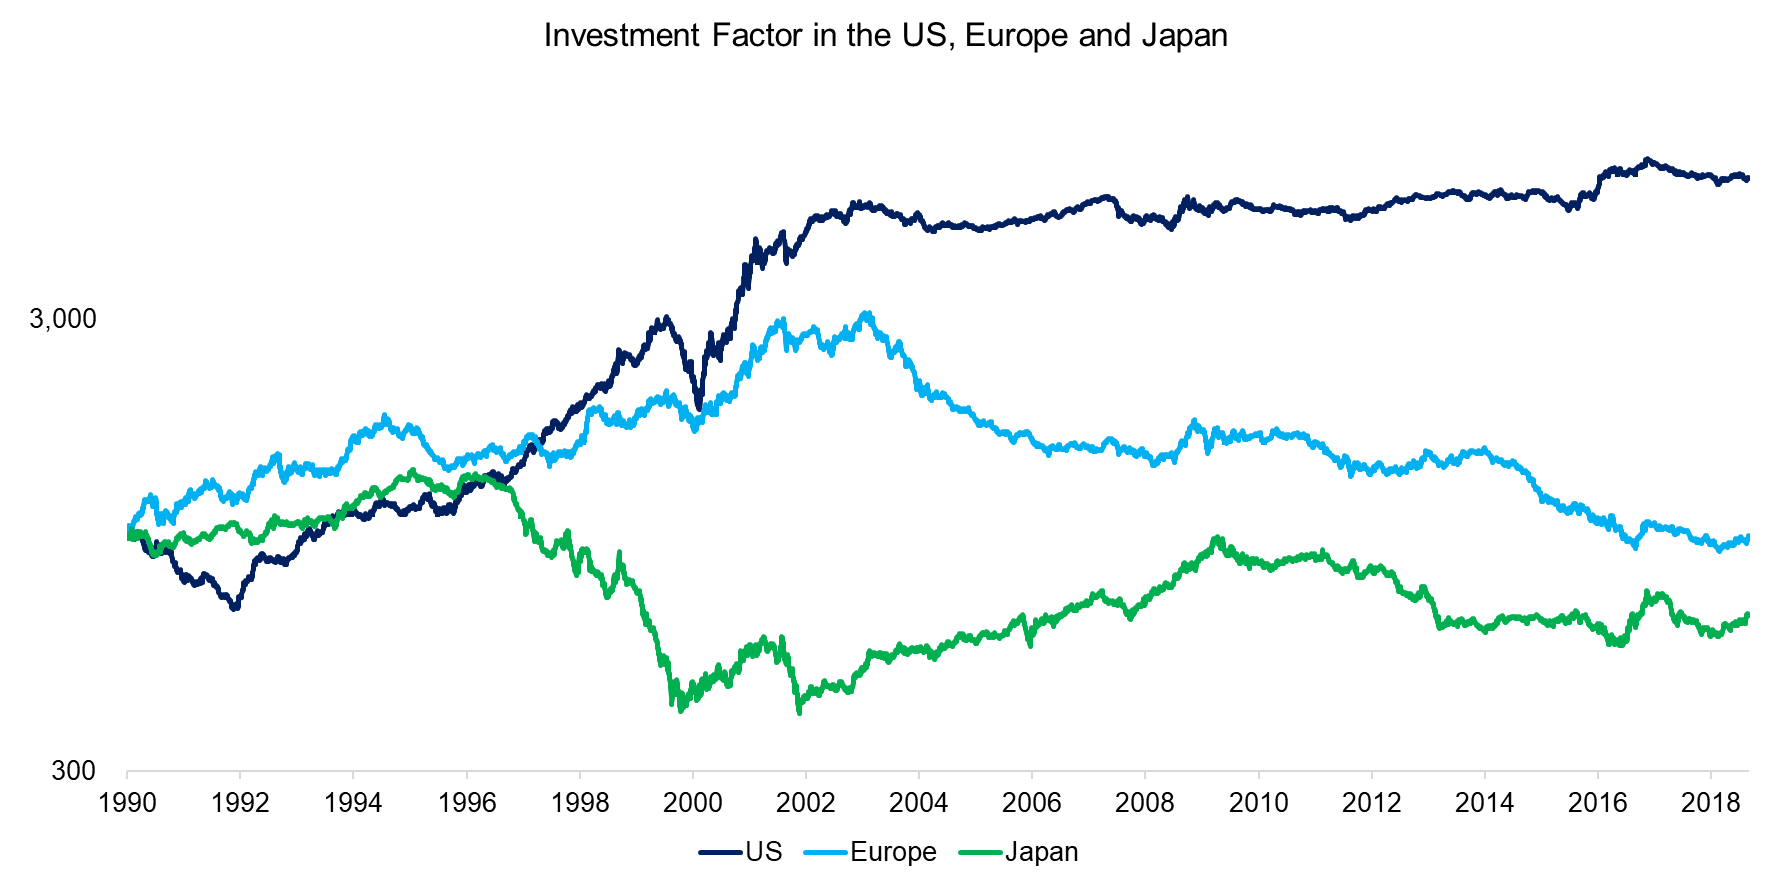
Analyzing the long-short performance of the Investment factor highlights divergent returns across regions. The performance in the US and Europe was attractive from 1990 to 2000, but flat in the US and declining in Europe thereafter. The factor in Japan occasionally exhibited similar trends as the other markets, but traded differently more often than not.
Source: FactorResearch
ANALYSING THE PROFITABILITY FACTOR
Given that we are challenged by the relevance of the Investment factor for practical purposes, we focus on analyzing the Profitability factor. The results highlighted attractive returns in the US and Europe since 1990, which can be considered unusual.
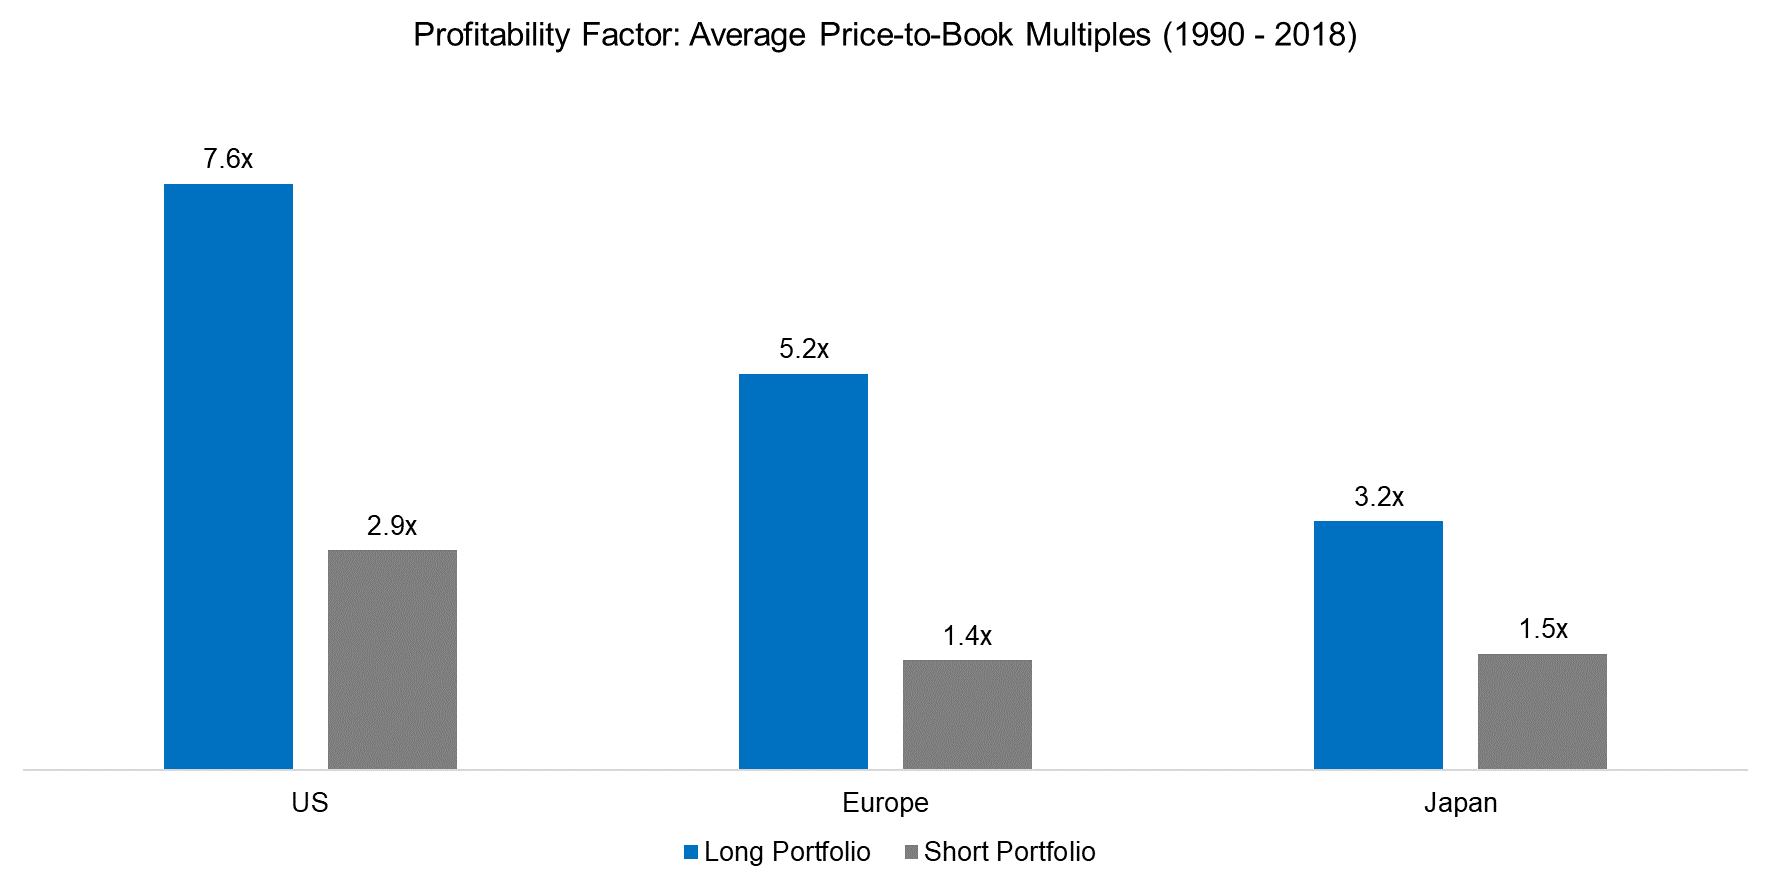
Companies that are more profitable than others should be trading at higher valuations. The analysis below displays the price-to-book multiples for the long and short portfolios of the Profitability factor, which confirms the expectation. The Profitability factor could therefore be regarded as the opposite of the Value factor.
The Value factor generated negative returns since 2010 while the Profitability factor showed a strong performance, indeed indicating an inverse relationship. However, both factors generated significantly positive returns between 2000 and 2006, therefore the inverse relationship was not consistent across time.
Source: FactorResearch
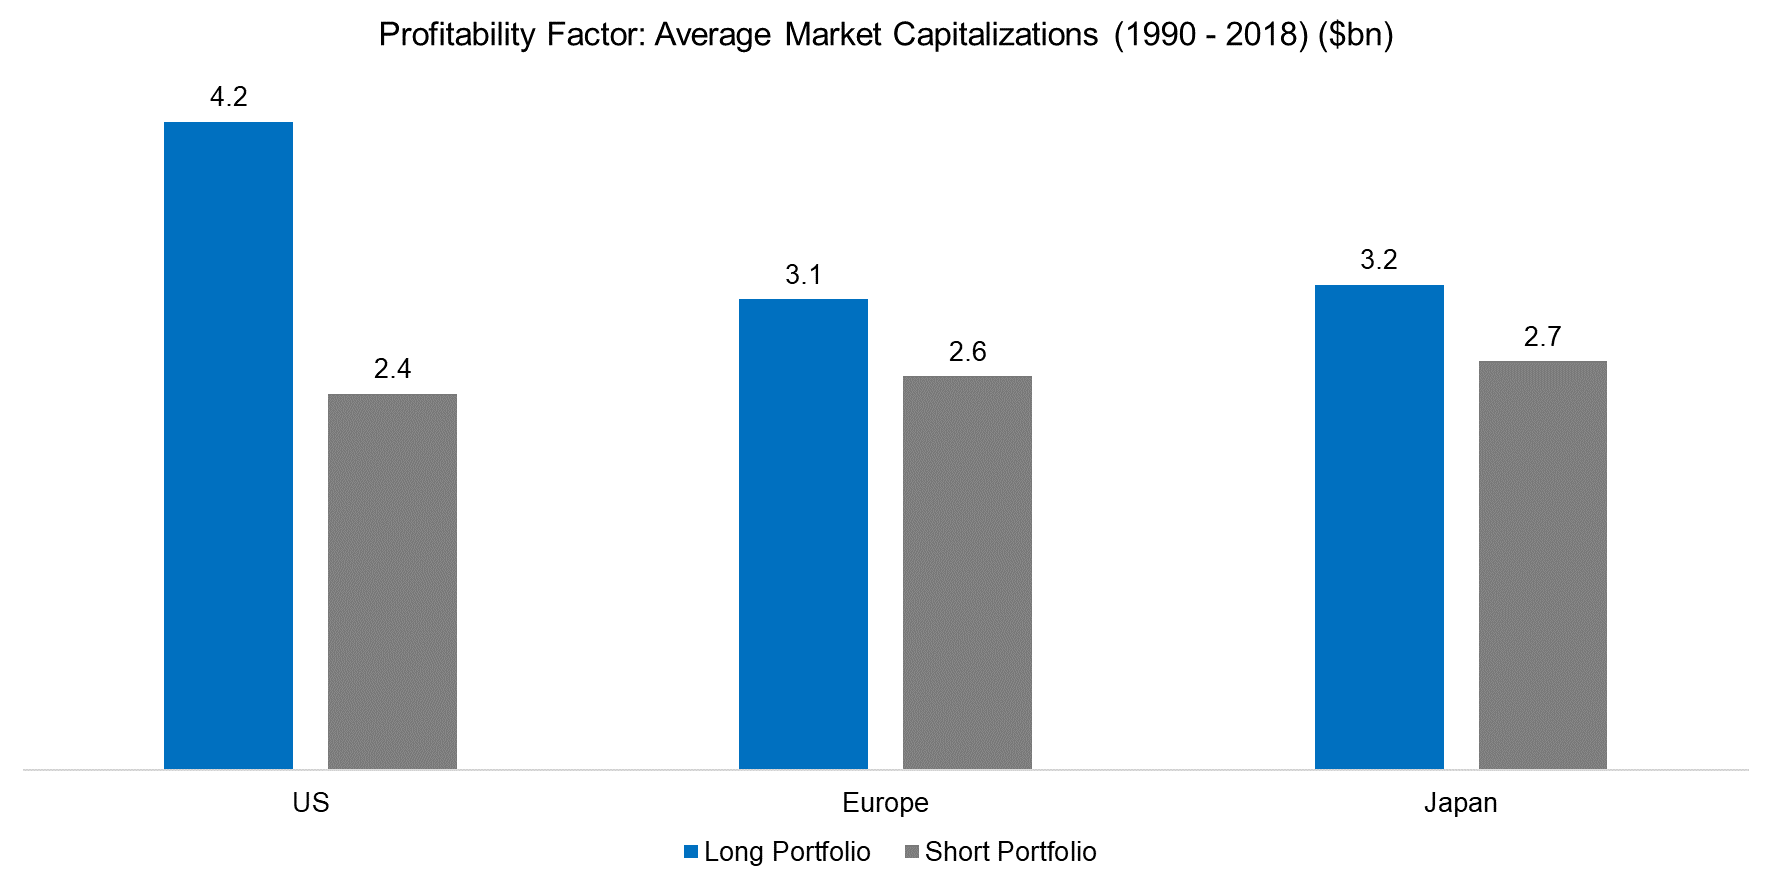
Next, we analyze the market capitalizations of the long and short portfolios of the Profitability factor, which indicate that highly profitable companies in the US featured almost twice the market capitalization of companies with low levels of profitability. There is less differentiation in European and Japanese stock markets.
Source: FactorResearch
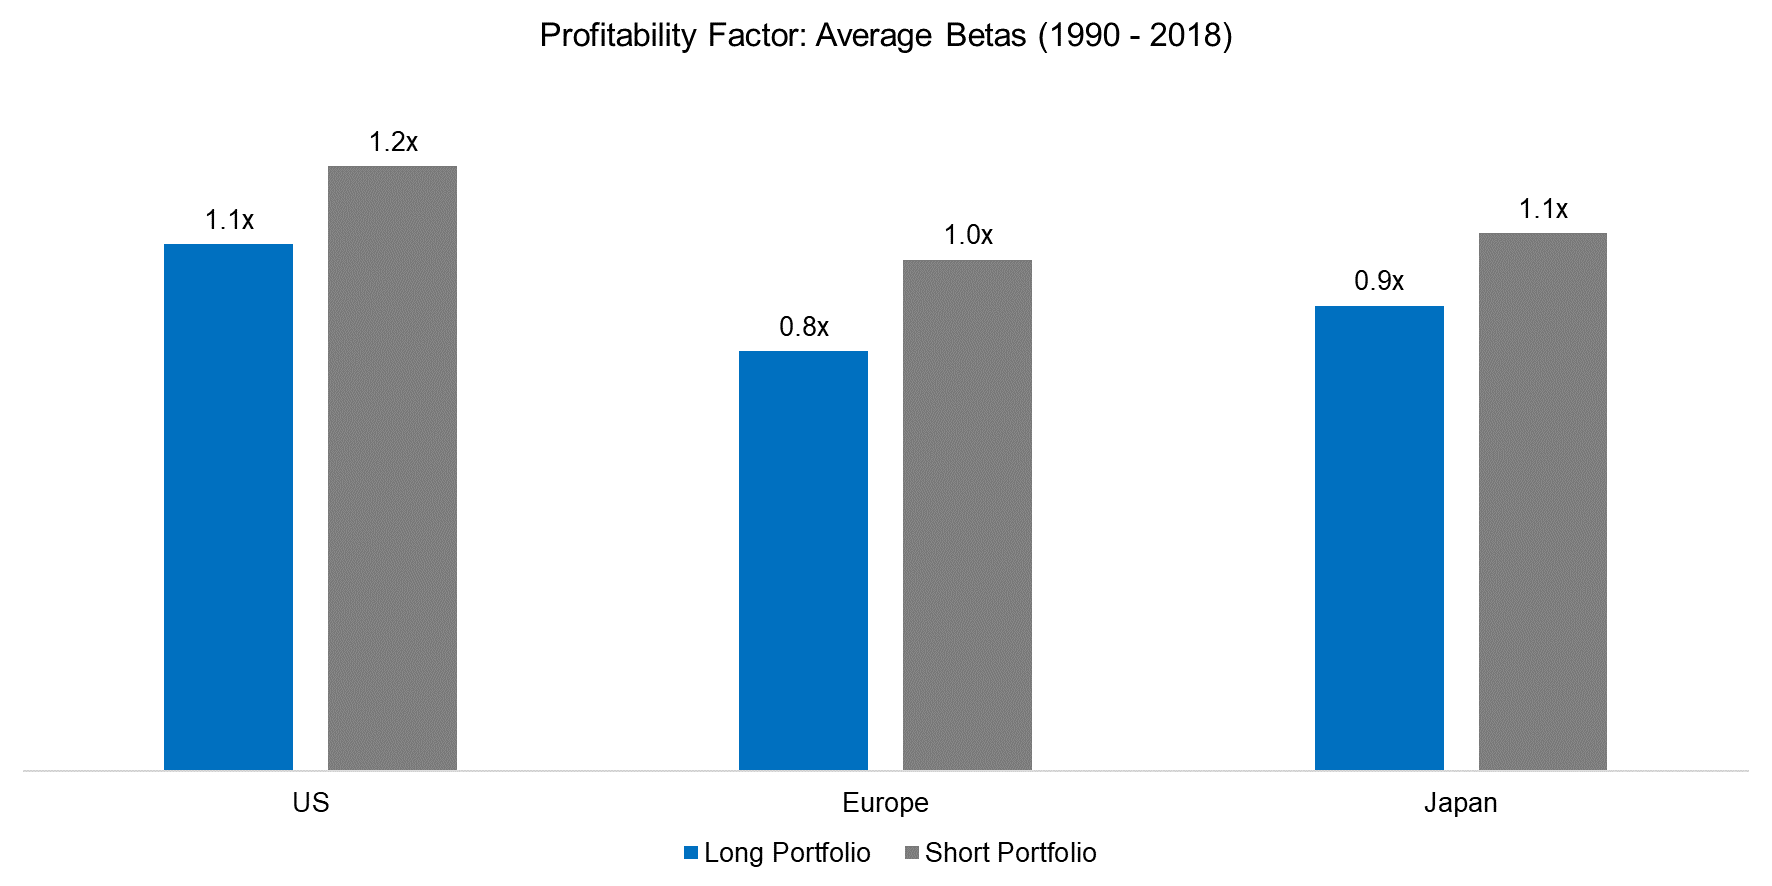
Some academic research indicates a relationship between the Profitability and Low Volatility factors. The analysis below shows that highly profitable companies feature lower betas than stocks with low profitability. However, the net betas, i.e. the difference between the betas of the long and short portfolios, average 0.2 for Profitability compared to more than 1 for the Low Volatility factor, implying different underlying portfolios (read Factors: Correlation Check).
Source: FactorResearch
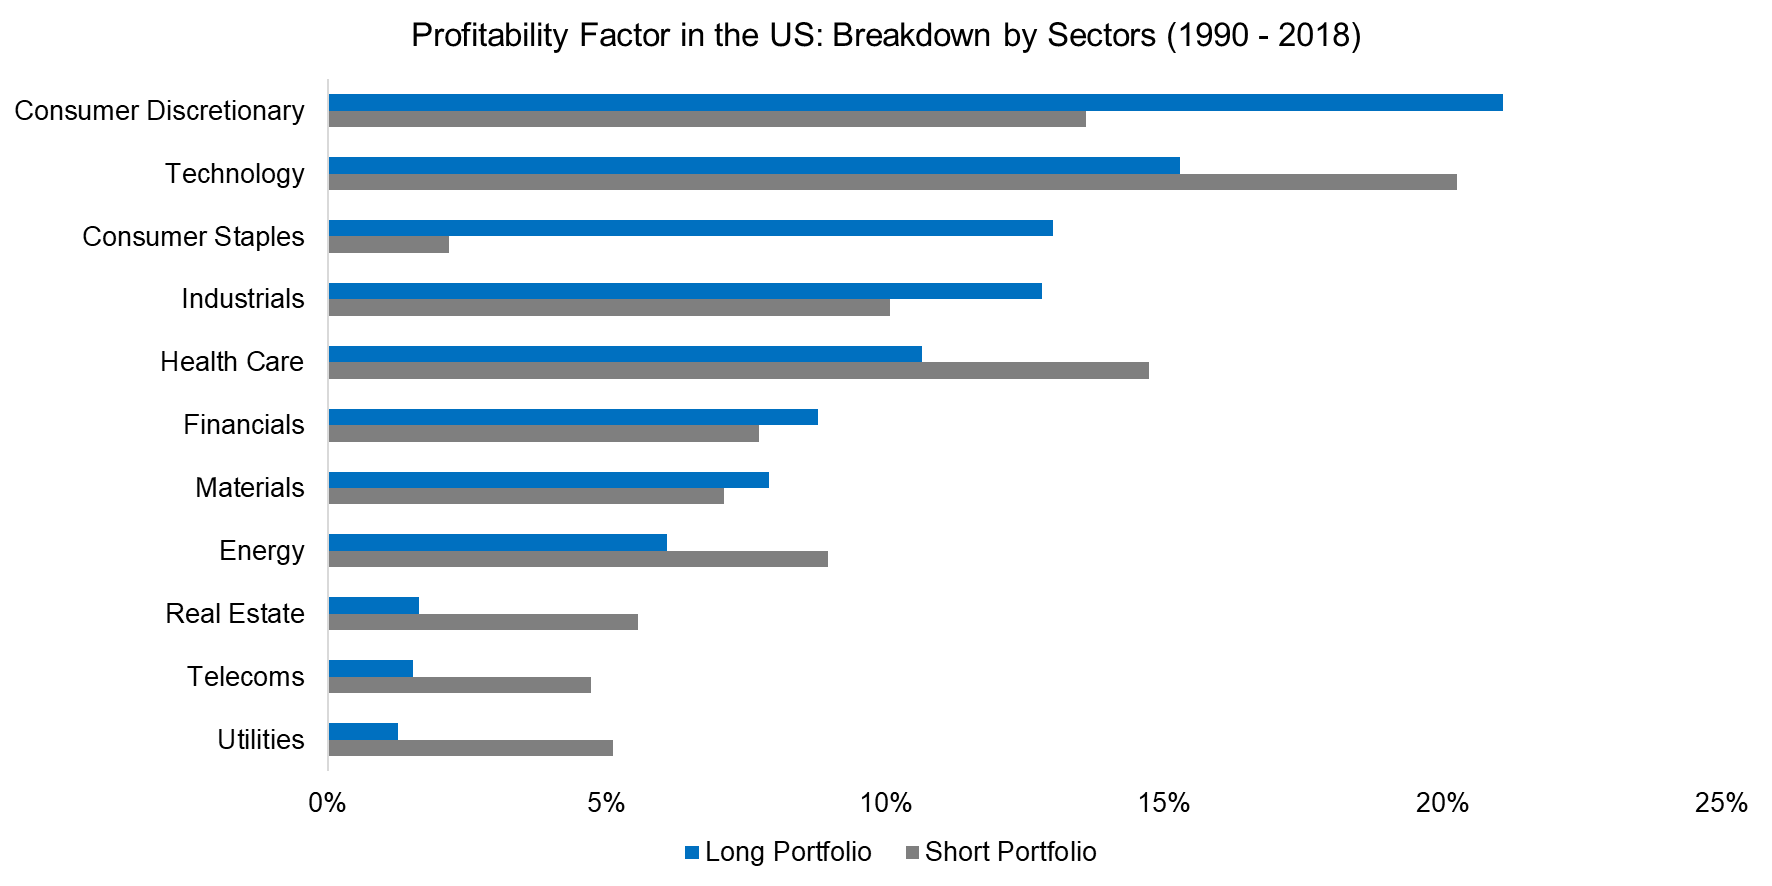
Finally, we analyze the sectoral composition of the Profitability factor from 1990 to 2018. It is worth noting that the sector exposures are structural and do not change significantly across time. We observe overweights in the consumer discretionary and staples sectors and underweights in the technology, healthcare, energy, and asset-heavy sectors. The net short exposure to the real estate, telecoms, and utilities further highlights that the Profitability and Low Volatility factors are different, as the later has net long exposure in these.
Source: FactorResearch
FURTHER THOUGHTS
This short research note investigates the Profitability and Investment factors across markets. The Investment factor is unusual from a financial analyst’s perspective, which likely explains why there are almost no investment products like smart beta ETFs that offer exposure to the factor.
In contrast, profitability is a common metric in financial analysis and features prominently in most quality-focused portfolios. The analysis highlights that highly profitable companies feature expensive valuations, large market capitalizations, and low betas. However, these stock characteristics are more likely to result in negative than positive excess returns, therefore we continue to be mystified by the impressive performance of the Profitability factor.
ABOUT THE AUTHOR
Nicolas Rabener is the CEO & Founder of Finominal, which empowers professional investors with data, technology, and research insights to improve their investment outcomes. Previously he created Jackdaw Capital, an award-winning quantitative hedge fund. Before that Nicolas worked at GIC and Citigroup in London and New York. Nicolas holds a Master of Finance from HHL Leipzig Graduate School of Management, is a CAIA charter holder, and enjoys endurance sports (Ironman & 100km Ultramarathon).
Connect with me on LinkedIn or X.

