The Pitfalls of Portfolio Optimization
Beware of the man selling high Sharpe portfolios
June 2024. Reading Time: 10 Minutes. Author: Nicolas Rabener.
SUMMARY
- Sharpe ratio-optimized multi-asset portfolios deteriorate significantly out-of-sample
- Targeting volatility only does marginally better
- Simple equal-weighting across asset classes holds up surprisingly well
INTRODUCTION
In his book “Expert Political Judgment”, Philip Tetlock presents the results of a landmark study spanning two decades, analyzing 82,361 forecasts made by 284 experts in political and economic fields. The findings were sobering: experts performed only slightly better than random chance.
Yet despite being published in 2005, the book does not appear to have dented society’s faith in experts. The asset management industry is a case in point. The S&P SPIVA Scorecards consistently show that more than 90% of active fund managers – experts in stock picking – fail to outperform their benchmarks, regardless of time frame or market. Still, trillions of dollars remain invested with active managers, despite their terrible odds.
Portfolio optimization represents another area of investing where expert-driven approaches are widely overvalued. In this research article, we explore why – and how – that trust may be misplaced.
SHARPE RATIO OPTIMIZATION
While some investors aim to optimize a portfolio by maximizing total return, this approach is fundamentally flawed, as it ignores the level of risk required to achieve those returns. In fact, given the availability of leveraged S&P 500 ETFs, it’s relatively easy to “beat” the market, albeit at the cost of significantly higher risk.
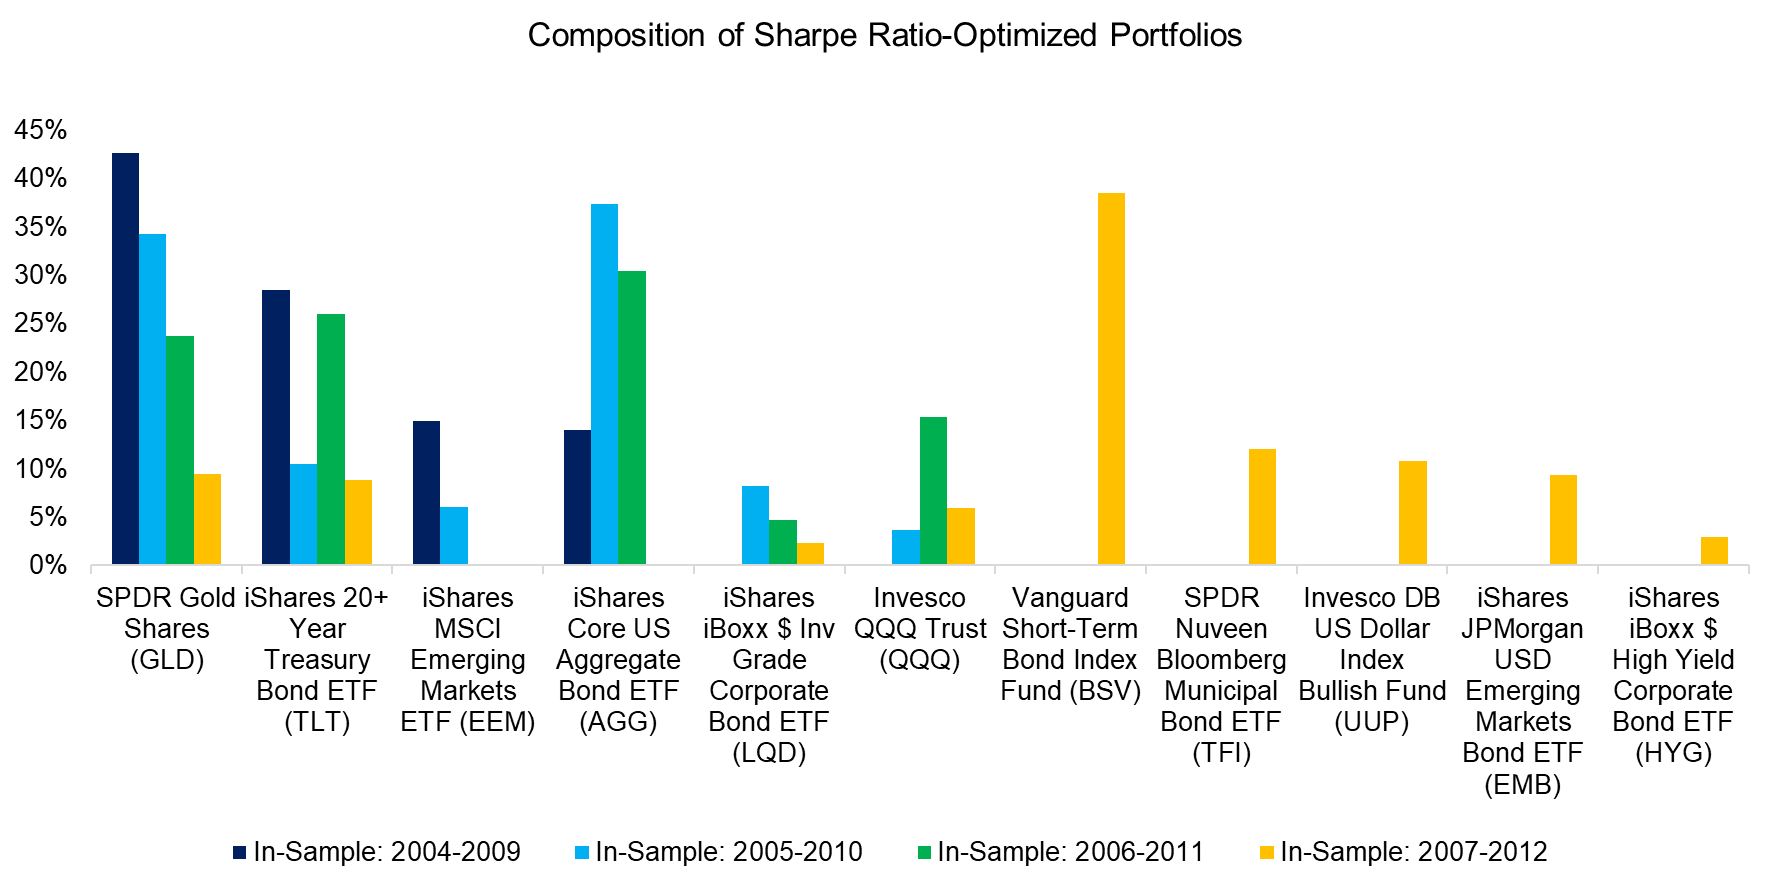
A more sensible objective is to maximize the Sharpe ratio, which accounts for both return and risk. To explore this, we construct a universe of diverse ETFs offering exposure to various asset classes, sectors, and strategies, all of which have been available since 2004. Using this universe, we create in-sample (IS) portfolios based on maximizing the Sharpe ratios during a five-year lookback period, which are then held for the subsequent five years.
Starting in 2004, we observe that the composition of the Sharpe-optimal portfolios changes meaningfully from one period to the next. For instance, the portfolio optimized for the 2004 – 2009 period had no allocation to U.S. equities – likely reflecting their weak performance during the global financial crisis. In contrast, the portfolio for the following five-year period introduced a modest allocation to U.S. technology stocks via QQQ.

Source: Finominal
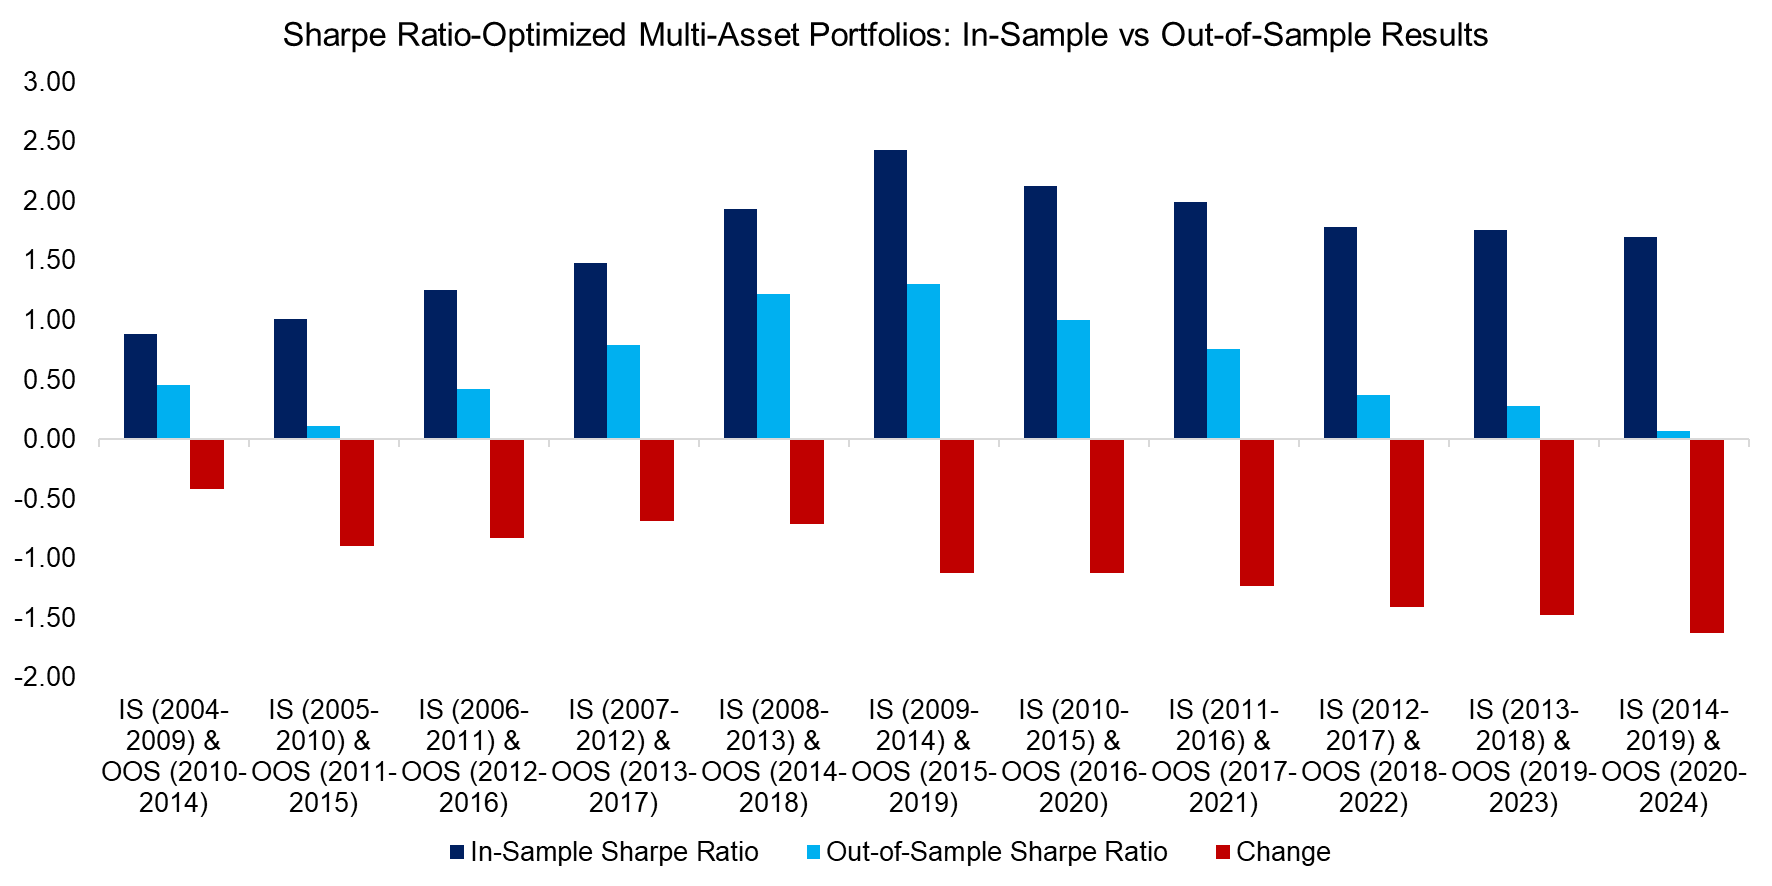
Next, we compare the in-sample (IS) and out-of-sample (OOS) Sharpe ratios for 11 portfolios constructed annually from 2004 to 2014. In every case, the out-of-sample performance deteriorated relative to the in-sample results. The decline in Sharpe ratios ranged from -37% to -89%.
While the chart may suggest that Sharpe ratio degradation worsened over time, this pattern is primarily driven by increases in the absolute values. Specifically, Sharpe ratios improved in later periods simply because the global financial crisis was no longer part of the in-sample windows and asset class returns were higher on average.

Source: Finominal
TARGET VOLATILITY OPTIMIZATION
Given the poor out-of-sample performance of the Sharpe ratio-optimized portfolios, what alternatives can investors consider?
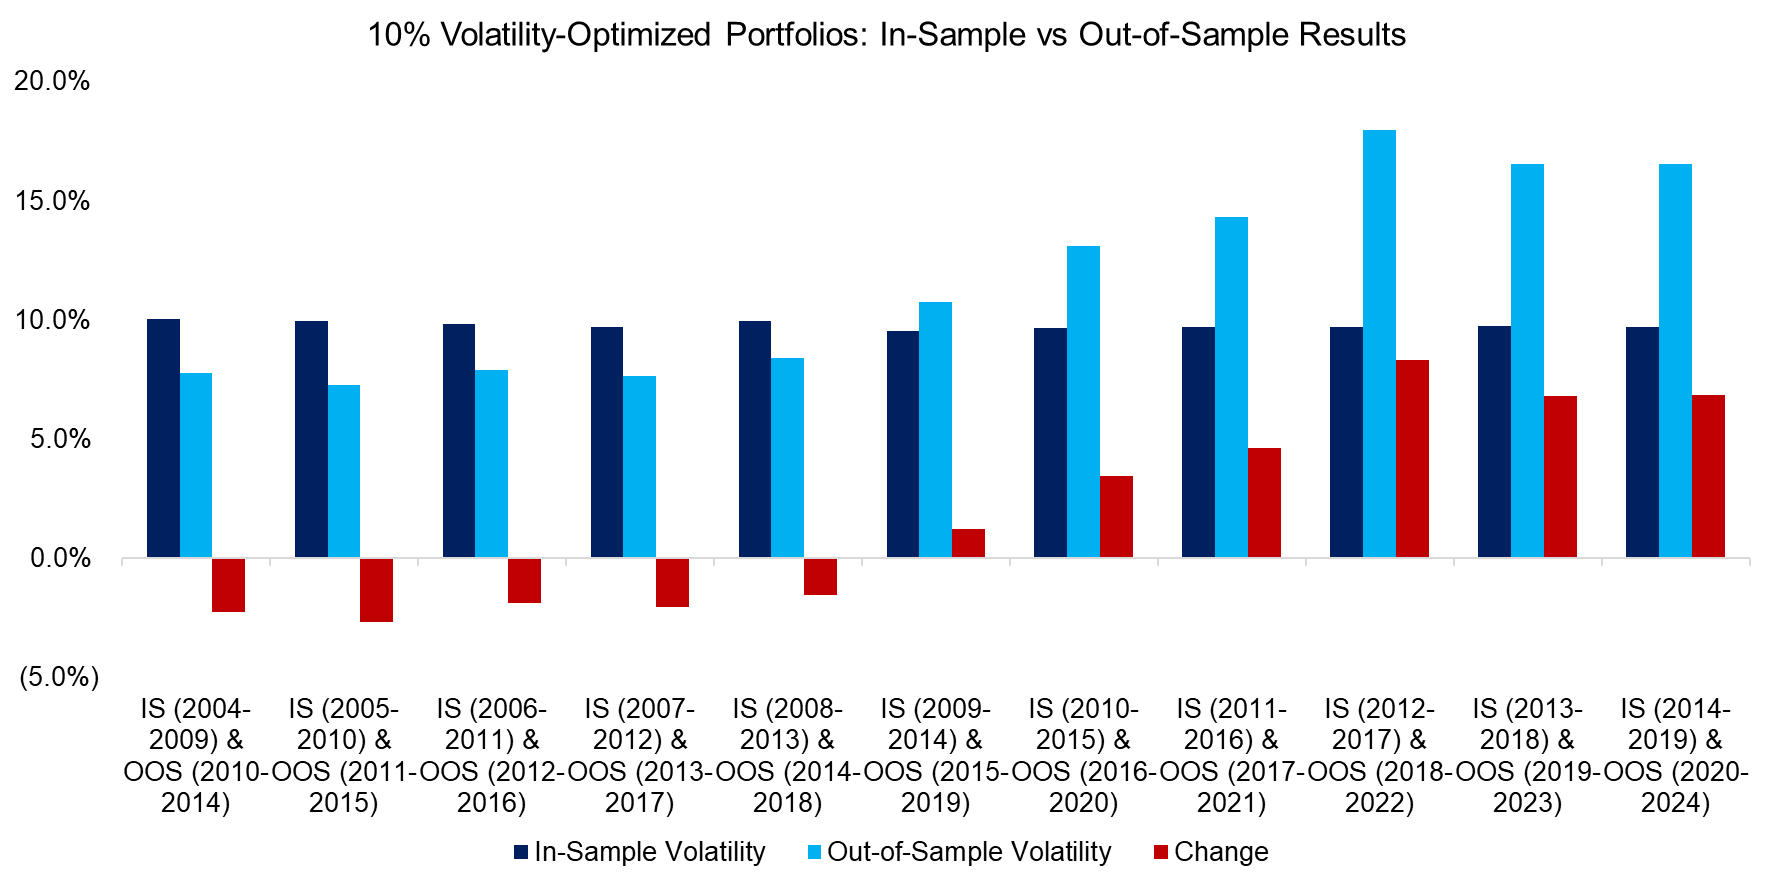
One approach is to target portfolio volatility, leveraging the fact that volatility tends to cluster over time – unlike returns, volatility exhibits relatively high autocorrelation. We re-optimize the same 11 portfolios, this time aiming for a target volatility of 10%. Out-of-sample results show realized volatilities ranging from 7.3% to 18.0%.
In older portfolios, out-of-sample volatility typically came in below the 10% target. However, once the COVID-19 crisis in 2020 entered the out-of-sample periods, realized volatility began to exceed the target, reflecting the heightened and less predictable market environment during that time.

Source: Finominal
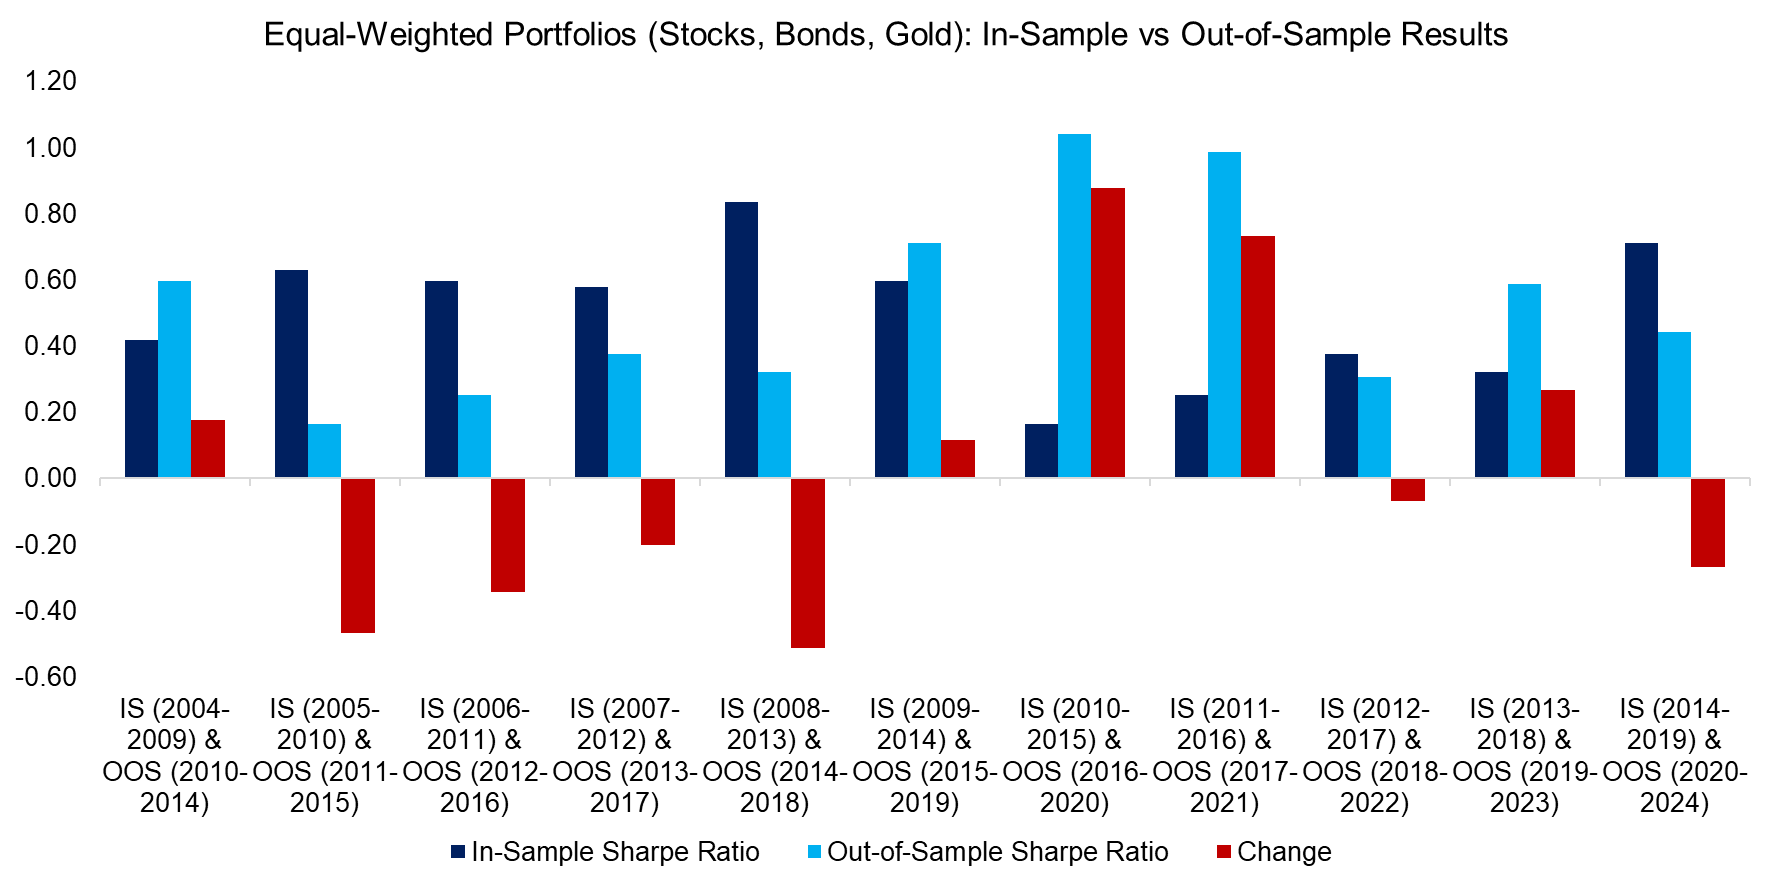
A second option is to simply equal-weight the asset classes. While this may appear too simplistic to be effective, the results suggest otherwise. Repeating the test with an equal-weighted portfolio consisting of U.S. equities, U.S. investment-grade bonds, and gold yielded out-of-sample Sharpe ratios that exceeded the in-sample values in five out of the eleven years.
More notably, the median out-of-sample Sharpe ratio for the equal-weighted portfolio was 0.44, nearly identical to the 0.46 achieved by the Sharpe ratio-optimized portfolios – despite the much lower complexity and no reliance on historical optimization.

Source: Finominal
FURTHER THOUGHTS
While this analysis exposes the poor out-of-sample performance of several widely used optimization approaches, it’s important to note that these results are based on historical data – a backward-looking perspective. For example, in 2020, an optimizer relying purely on past returns might have assigned a large weight to German government bonds due to their strong historical performance. Yet, any rational investor would recognize that bonds trading at negative yields offered an unattractive risk-reward profile.
A more effective alternative may lie in forward-looking optimization based on capital market assumptions. While this approach introduces its own risk, so does every aspect of investing.
RELATED RESEARCH
What´s Better than the S&P 500?
Outperformance via Leverage
Complexity is the Enemy of Investing
Stock Selection versus Asset Allocation
Smart Beta Asset Allocation Models
Absolute versus Relative Momentum Across Asset Classes
ABOUT THE AUTHOR
Nicolas Rabener is the CEO & Founder of Finominal, which empowers professional investors with data, technology, and research insights to improve their investment outcomes. Previously he created Jackdaw Capital, an award-winning quantitative hedge fund. Before that Nicolas worked at GIC and Citigroup in London and New York. Nicolas holds a Master of Finance from HHL Leipzig Graduate School of Management, is a CAIA charter holder, and enjoys endurance sports (Ironman & 100km Ultramarathon).
Connect with me on LinkedIn or X.

