The Value Factor’s Pain: Are Intangibles to Blame?
What is driving the value factor?
December 2020. Reading Time: 10 Minutes. Author: Nicolas Rabener.
SUMMARY
- The rise of intangibles has been increasingly used as an argument for the poor performance of the value factor
- However, this idea is not supported by data
- The type of market environment is marginally more useful for explaining the value factor performance
INTRODUCTION
Great storytelling may be the most powerful human skill. Empires have been built by lone individuals whose enthralling narratives convinced their compatriots to join the cause. In the right hands, these narratives can rally hearts and minds to achieve a common purpose that serves the greater good, as when John F. Kennedy challenged his fellow Americans to go to the moon.
In the wrong hands, however, great storytelling can lead to untold destruction. And that’s especially true in finance.
Investors waste billions each year in the pursuit of false and misleading narratives. Maybe a charismatic founder — WeWork’s Adam Neumann, for example — convinces them that a traditional real estate company should be valued at technology stock multiples. Or an asset manager persuades them to buy thematic securities when they’re trading at their peaks, say cryptocurrencies in 2017 or cannabis stocks in late 2018 and early 2019. Or in the midst of a real estate bubble, an eminent economist points out that US housing prices have never declined on a national level, convincing many that they can’t fall. The appeal to authority, or the ad verecundiam fallacy, thus gives investors false comfort in flawed investment propositions.
Take the recent performance of the value factor, which is defined as buying companies with low price-to-book multiples and shorting those with high price-to-book multiples. The strategy has disappointed for years. “It has become a bad environment for value and this time is different,” some say. Why? Because intangibles have increased as a percentage of the valuations of fast-growing tech companies and thus rendered value obsolete.
We are suckers for stories and this one has a simple and intuitive appeal that is hard to resist. Valuing tech firms on traditional price-to-book multiples does feel like an outdated approach. We’ve all seen how tech companies have transformed modern life, from how we meet with colleagues (virtually via Zoom) to how we order groceries (from the couch). All this combines to create a compelling narrative that’s easy to accept: Traditional value investing has been so challenging over the last decade because the market caps of tech companies are based almost entirely on intangibles.
But is this narrative correct? Are intangibles responsible for the poor performance of the value factor?
THE RISE OF INTANGIBLES
From an accounting perspective, intangibles are assets that are not substantial or material, that we cannot touch. They are a hodgepodge of brand value, client loyalty, goodwill, innovation, and corporate culture, among others. All intangibles are distinct and not directly comparable between firms.
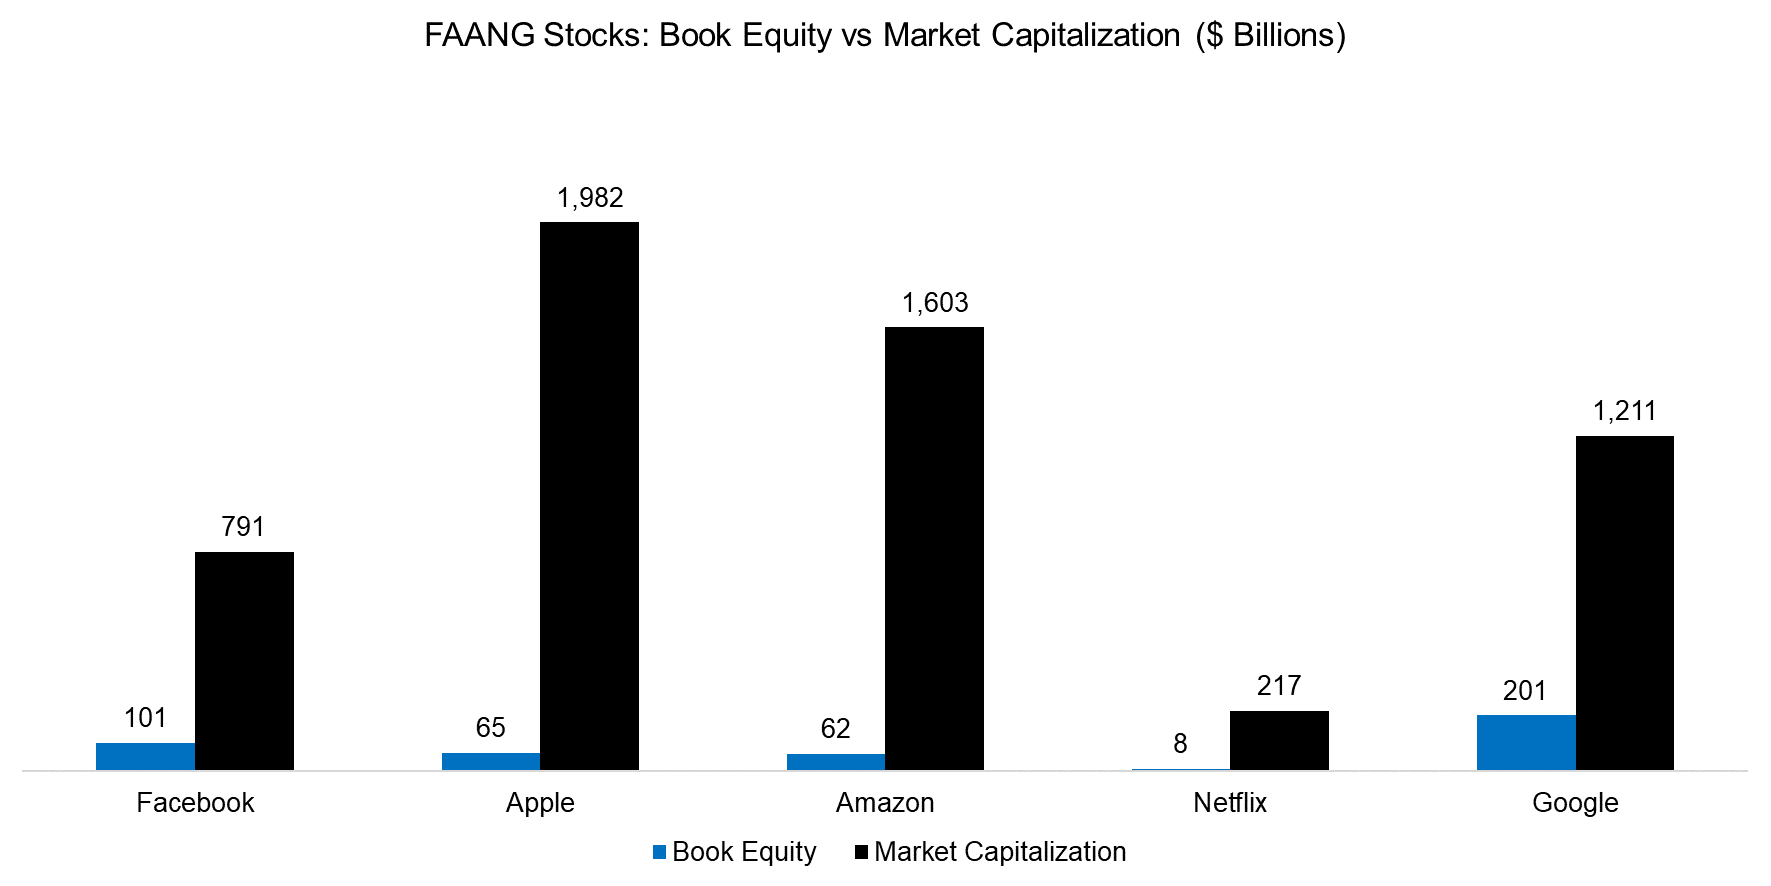
AOL included $127 billion in goodwill when it bought Time Warner in 2000, for example, and so paid a substantial premium relative to Time Warner’s book equity. Today, that transaction is widely seen as a failure because the combined company wrote down $99 billion of goodwill during a 2002 impairment test. That may sound like a lot of money, but it is a fraction of the intangible value implied in the FAANG stocks’ current market capitalizations. Among these five companies, the average ratio of book equity to market capitalization is 8% so they have few tangible assets. Netflix, for example, has a market capitalization of more than $200 billion, but only $8 billion in book equity.
Source: FactorResearch
For traditional value investors, the high price-to-book multiples of the FAANG quintet and many other tech stocks have made them prime candidates for shorts. Yet these companies have generated outsized returns, so shorting them has contributed to poor value factor performance.
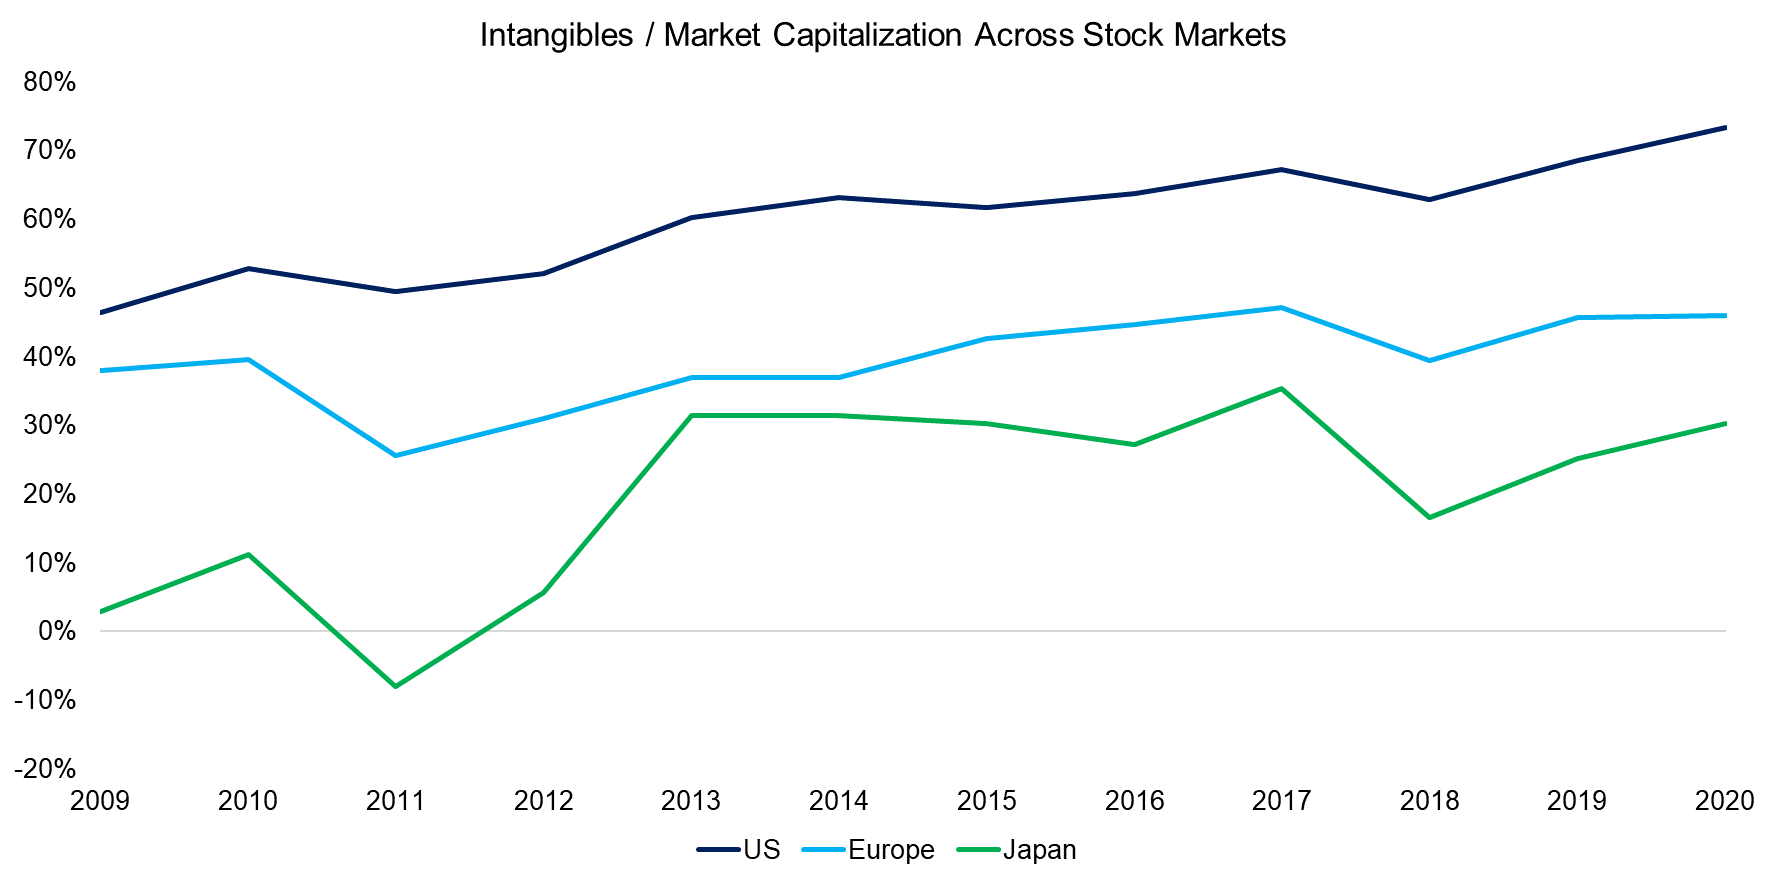
But the technology sector is much more influential in the US stock market than it is in Europe or Japan. Intangibles as a percentage of market capitalization in the US markets increased between 2009 and 2020, reflecting the emergence of the FAANG tech giants. But Europe hasn’t seen similar growth over the last decade and the ratio in Japan is where it was in 2013.
Source: FactorResearch
INTANGIBLES VERSUS VALUE FACTOR PERFORMANCE
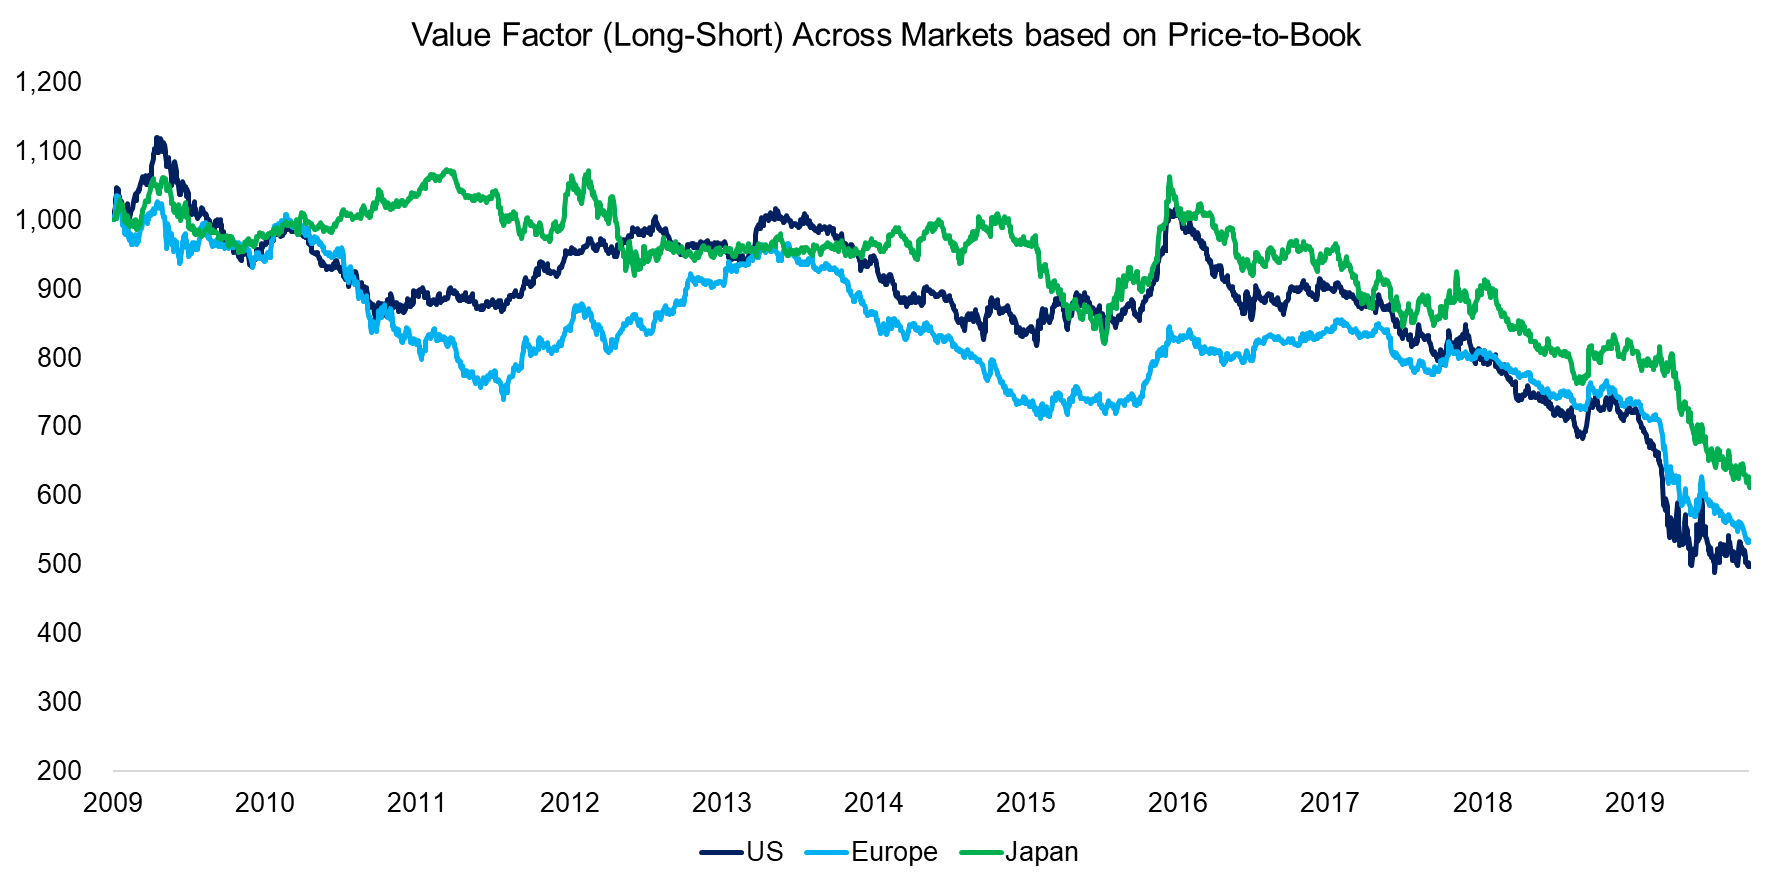
To compare the increase in intangibles against value factor performance, we constructed a long-short portfolio composed of cheap and expensive US stocks using data from the Kenneth R. French data library.
We found the higher the proportion of intangibles, the worse the value factor performance. Since the rise in intangibles as a percentage of market capitalization is due to strongly performing technology stocks, this is not unexpected.
But the intangibles percentage has not increased as significantly in Europe or Japan where the value factor has performed just as terribly. If intangibles were really the culprit, the value factor should not have performed so poorly in these markets.
Source: Kenneth R. French Data Library, FactorResearch
Thus far the analysis has focused on the original value factor defined by price-to-book multiples. But book value is not particularly informative and is currently among the worst ways to value a company. It may be relevant in the real estate or financials sector, but it is not especially applicable to most other industries.
Earnings and cash flow-based multiples are more sensible approaches to stock selection. No matter how fast a company grows, if it can’t generate profits or at least positive cash flow in the medium- to long-term, it is likely doomed. For example, with the exception of the loss-making Netflix, FAANG stocks have grown rapidly and produced attractive profit margins.
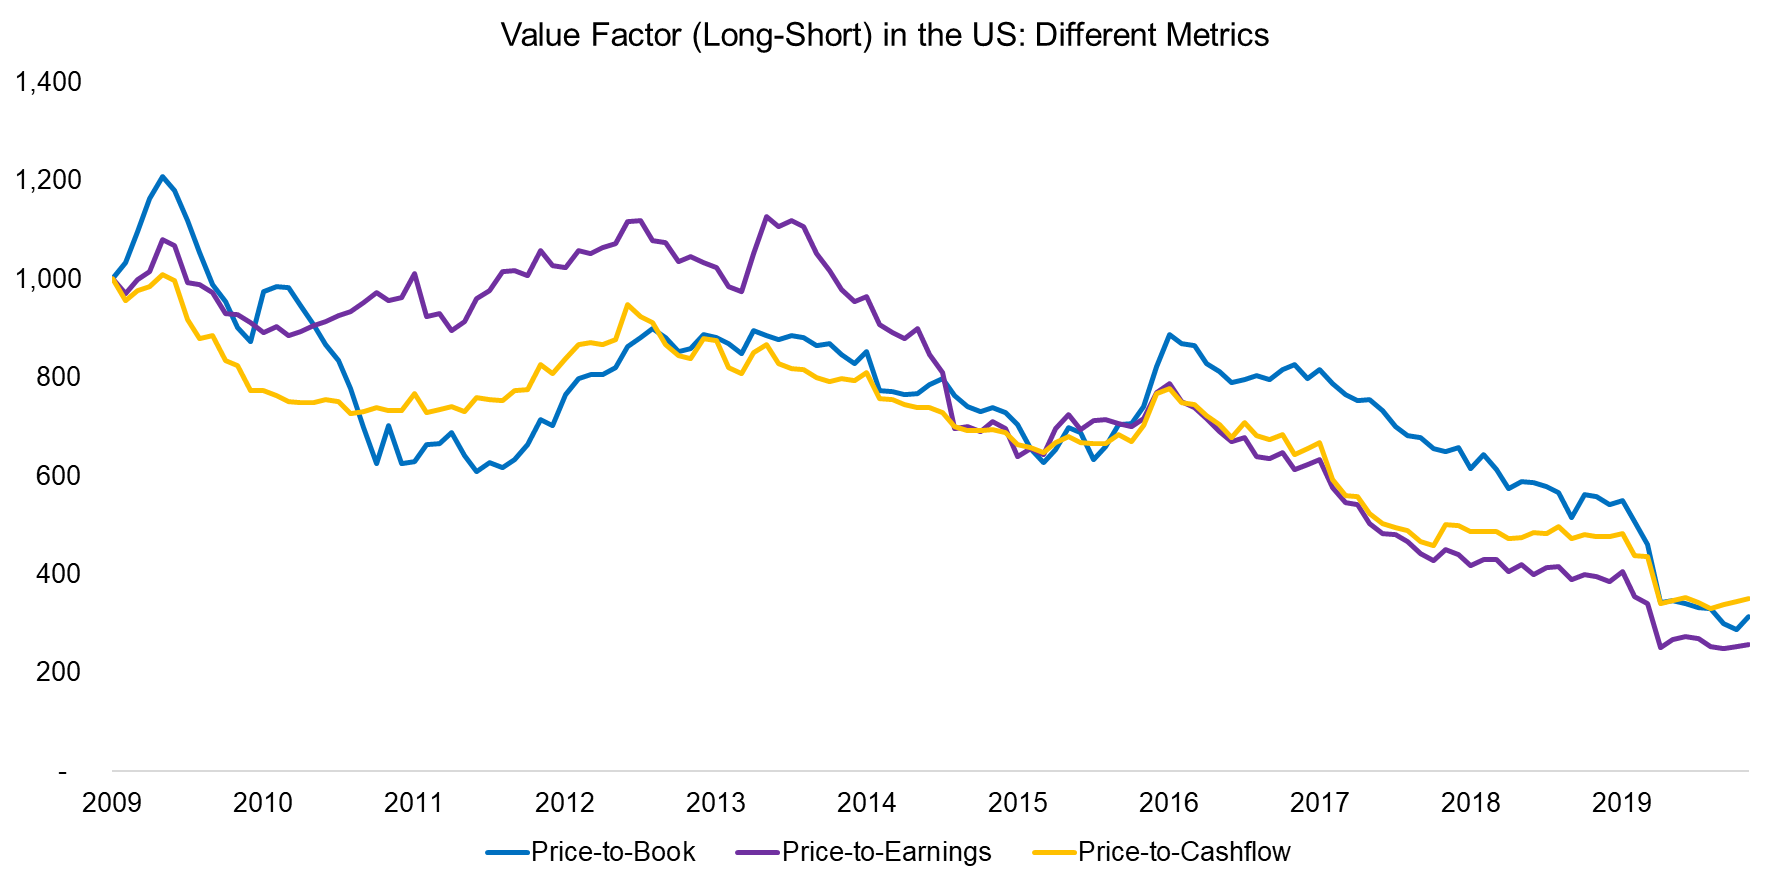
So what if we measure the performance of the long-short value factor in the United States based on price-to-book, price-to-earnings, and price-to-cash flow multiples? The trends across all three metrics are largely identical from 2009 to 2020. Intangibles may impact the price-to-book ratio, but they have less of an influence on the other two metrics. This is further evidence that the increase in intangibles does not explain the poor performance of the value factor (read CROIC, CFROI, CROCI & CROCS).
Source: Kenneth R. French Data Library, FactorResearch
WHAT IS DRIVING THE VALUE FACTOR?
If intangibles don’t explain value’s poor performance, what does?
Various theories have been proposed, but no consensus has emerged. Our research indicates investors will buy cheap stocks when they’re comfortable with the market environment. That’s a simple theory based on behavioral biases. Companies trading at low valuations tend to be companies in trouble, and investors are more likely to bet on them when the outlook is benign rather than risky (read How Risky Are Value Stocks?).
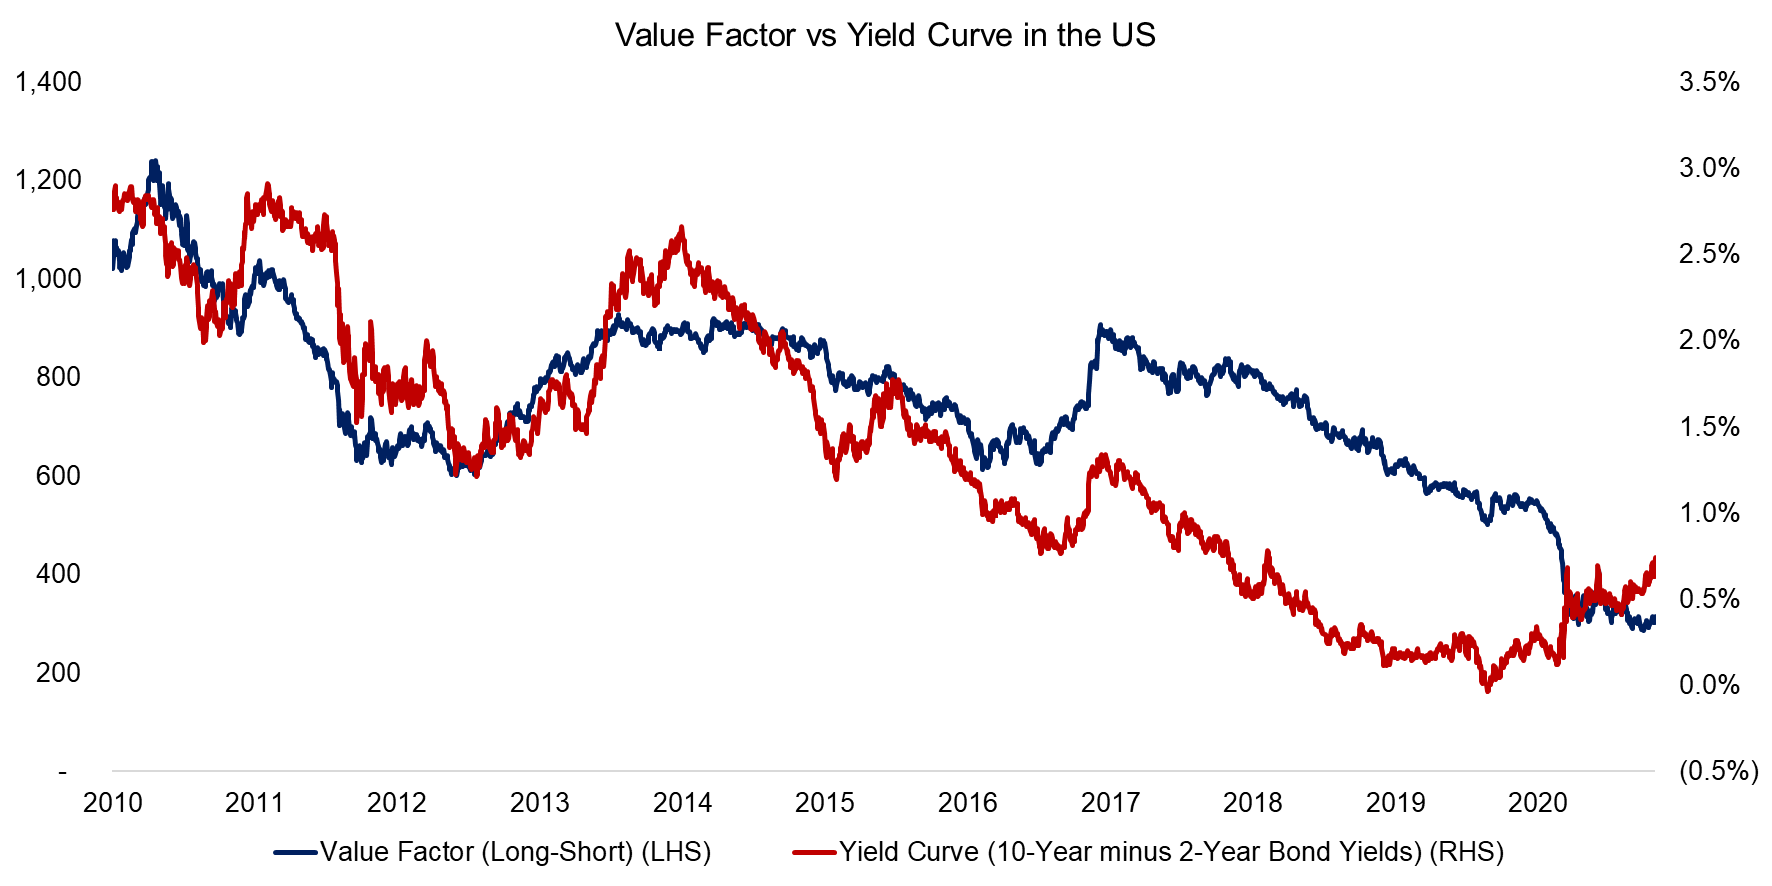
There are many ways to measure market structure using market skewness, implied volatility, or similar metrics. For example, the value factor’s and yield curve’s performance trends were very similar over the last decade.
Lower expected economic growth is one interpretation of a declining yield curve. That would not bode well for struggling companies. In such environments, it would seem intuitive to pursue firms with better growth prospects and ignore cheap ones until the outlook improves.
Source: Kenneth R. French Data Library, FRED, FactorResearch
FURTHER THOUGHTS
Is the rise in intangibles as a percentage of market capitalization unrelated to value factor performance? Clearly not. But it is a symptom rather than the disease. Put another way, correlation does not equal causation.
Yet the same can be said about the yield curve and other metrics that measure risk sentiment. In order for cheap stocks to have mass appeal again, animal spirits need to be revived.
But a structural transition from growth to value requires more than a simple narrative. Ultimately, it is about economic growth.
And while we can expect that to increase in 2021 thanks to COVID-19 vaccinations, prospects beyond next year are decidedly more bearish. Grim demographic profiles across most developed and many emerging markets will pose challenging headwinds for years to come. And it will take more than a good story to surmount them.
RELATED RESEARCH
Don’t Get Carried Away by Carry
ABOUT THE AUTHOR
Nicolas Rabener is the CEO & Founder of Finominal, which empowers professional investors with data, technology, and research insights to improve their investment outcomes. Previously he created Jackdaw Capital, an award-winning quantitative hedge fund. Before that Nicolas worked at GIC and Citigroup in London and New York. Nicolas holds a Master of Finance from HHL Leipzig Graduate School of Management, is a CAIA charter holder, and enjoys endurance sports (Ironman & 100km Ultramarathon).
Connect with me on LinkedIn or X.

