This Time It’s Different!?
Have retail investors changed markets?
September 2021. Reading Time: 10 Minutes. Author: Nicolas Rabener.
SUMMARY
- Options trading has increased to record highs
- Some data points indicate changes in the market structure
- However, these changes are likely temporary rather than structural
INTRODUCTION
During the 1954 recession in the U.S., Sir John Templeton wrote to his clients that “this time it’s different” are the four most dangerous words in investing. A pedantic reader might comment that it’s actually five words, but that’s beside the point.
The current investing world is odd indeed and perhaps this time it’s different: interest rates are zero, central banks manage stock markets, start-ups with unrealistic plans to make money are valued at billions, the market cap of cryptocurrencies has breached a trillion dollars, zombie companies like GameStop have been rejuvenated, and so on.
Some of these themes are attributed to an increased participation of retail investors. Overall, their market share of trading stocks and bonds has steadily declined over the last decades as professional money managers have taken over. However, occasionally they strike back.
In 2000, the lure of making easy money with technology stocks created an entire generation of day trading retail investors. In 2020, the combination of being confined to their homes, free government money, and free trading apps, has brought retail investors back to the game table.
Some market participants argue that retail investors have changed markets. Have they?
OPTIONS TRADING
There are many ways to show the interest and increased participation of retail investors in capital markets. Modern measures are analyzing certain search terms like “crypto trading” on Google Trends, compared to traditional ones like investor surveys. In this analysis, we will focus exclusively on market-derived data and start with options trading (read Option-Based Strategies: Opt In or Opt Out?).
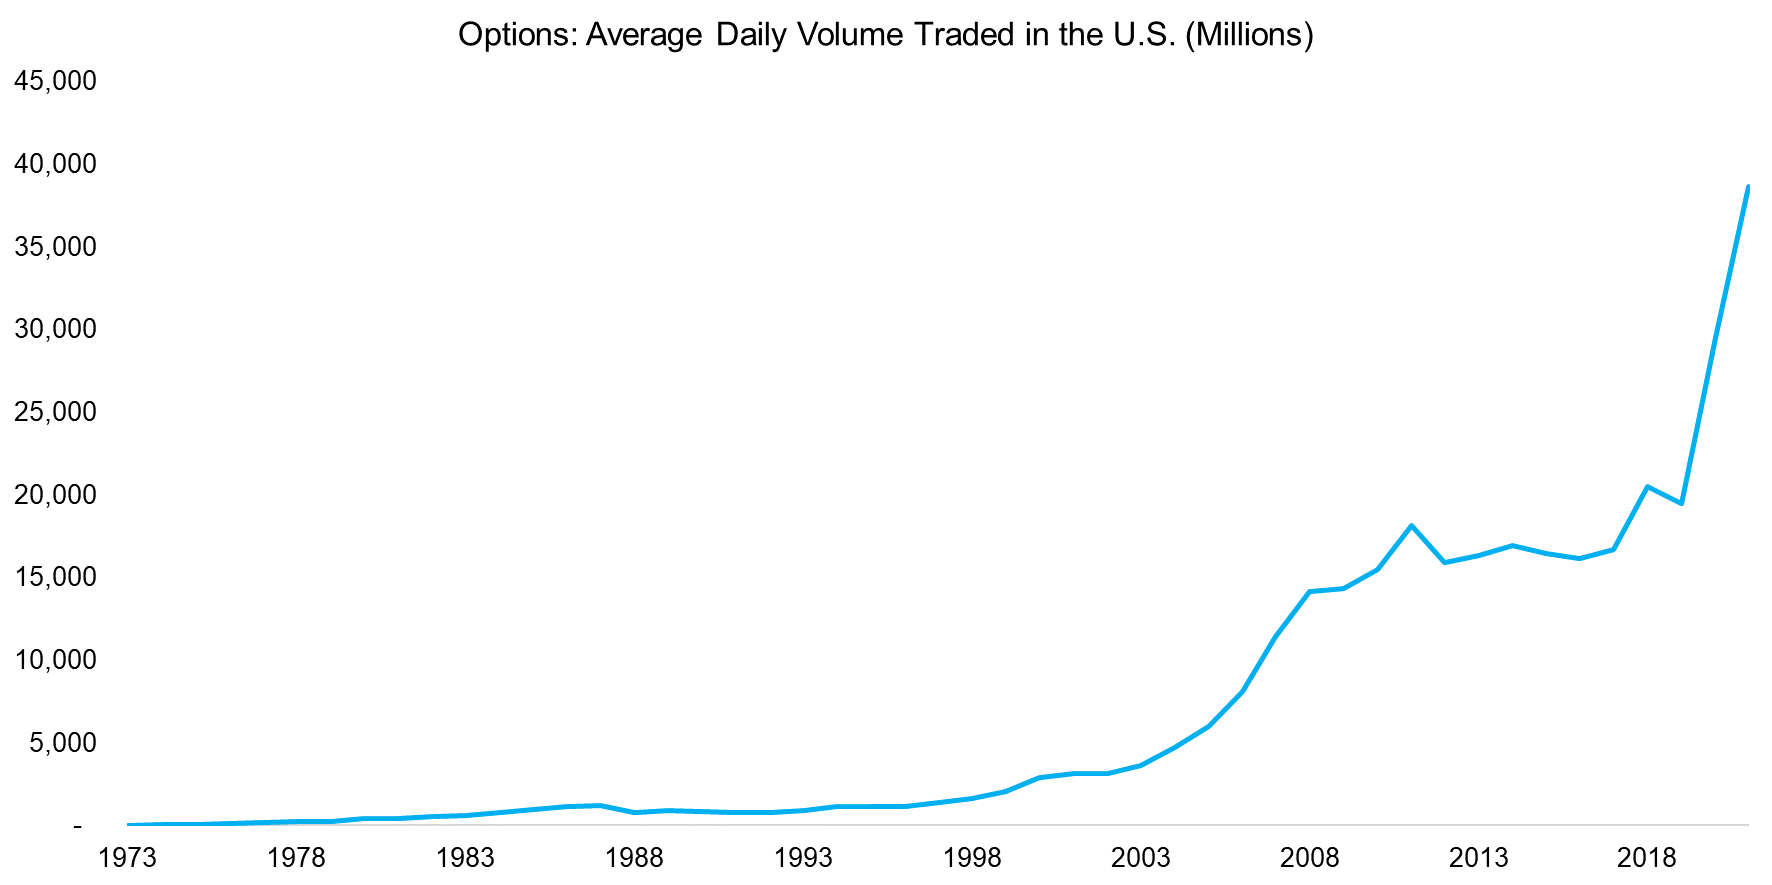
Retail investors like options given the potentially outsized returns while trading apps like Robinhood market options aggressively as it is financially more lucrative than stock trading. We observe that the average volume of traded options in the U.S. has been increasing consistently since data became available in 1973, but doubled in 2020. Partially this can be contributed to the COVID-19 crisis that led to a significant increase in demand for puts to hedge portfolios.
Source: OCC, FactorResearch
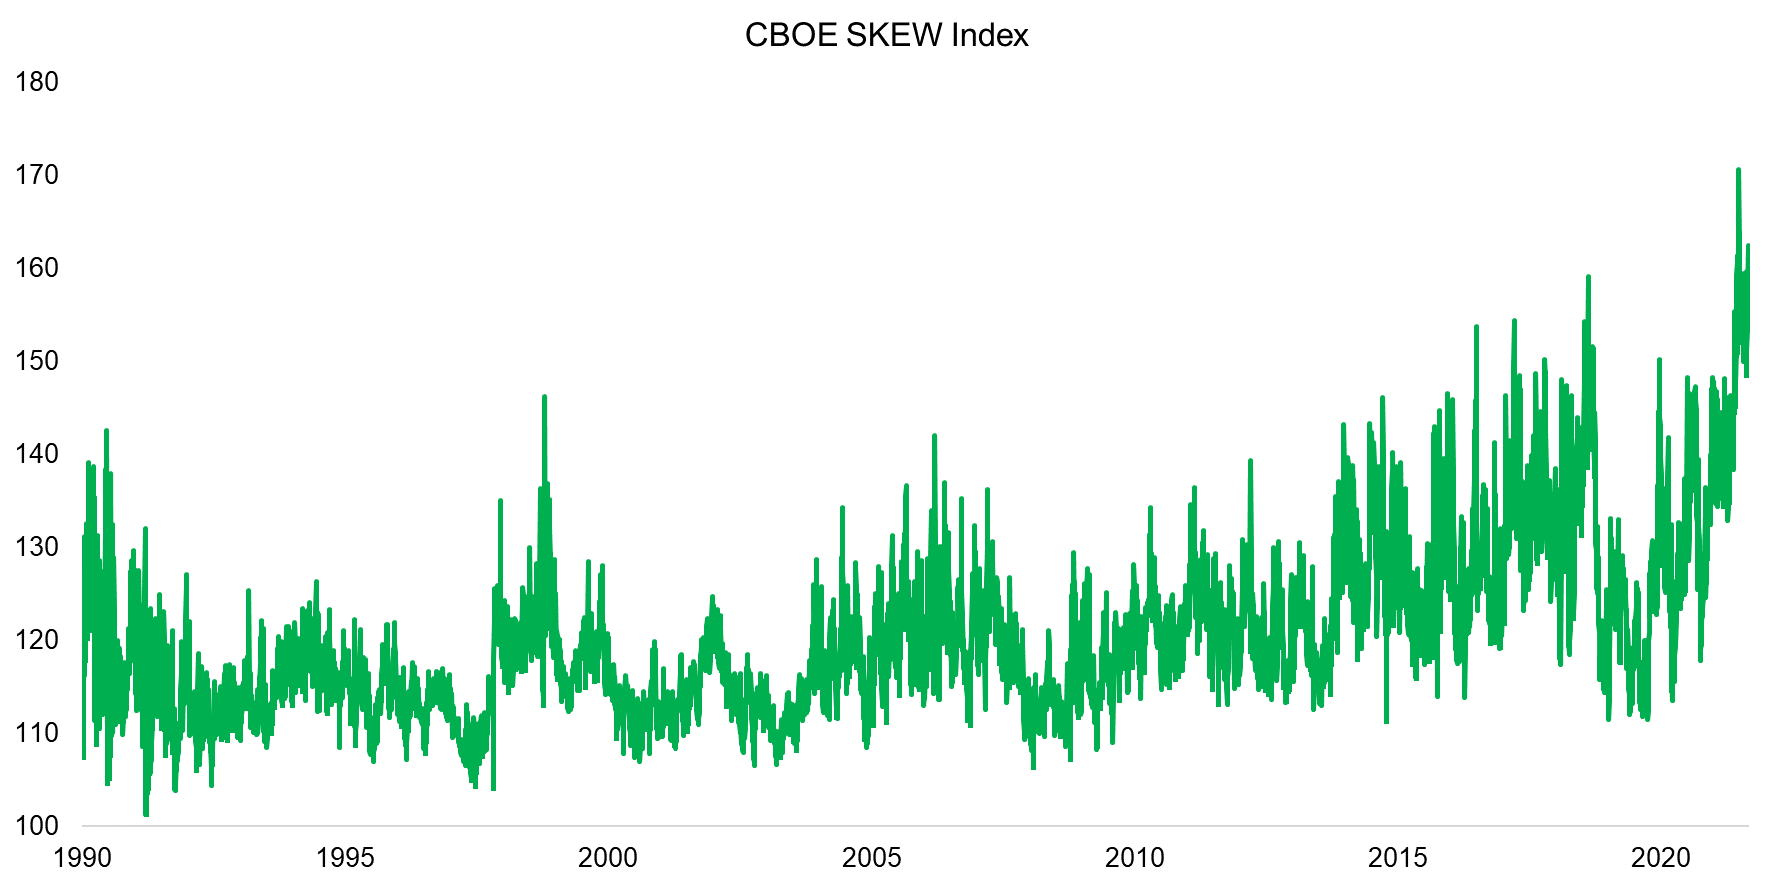
The impact of the higher volume in options trading can be observed in the market structure. CBOE publishes a SKEW index that is a measure of the slope of the implied volatility curve (the former volatility smile) that increases as the curve tends to steepen. The index is calculated off a portfolio of out-of-the-money S&P 500 options and indicates how the market prices tail risk as it provides exposure to the skewness of S&P 500 returns.
At an index level of 100, SKEW would indicate that the stock market’s log-returns are normally distributed, which they rarely are. SKEW is currently trading at an all-time high, which means the probability of a tail event has increased.
Source: CBOE, FactorResearch
IMPLIED AND REALIZED VOLATILITY
It is worth noting that high SKEW index values have historically been associated with high and low VIX values.
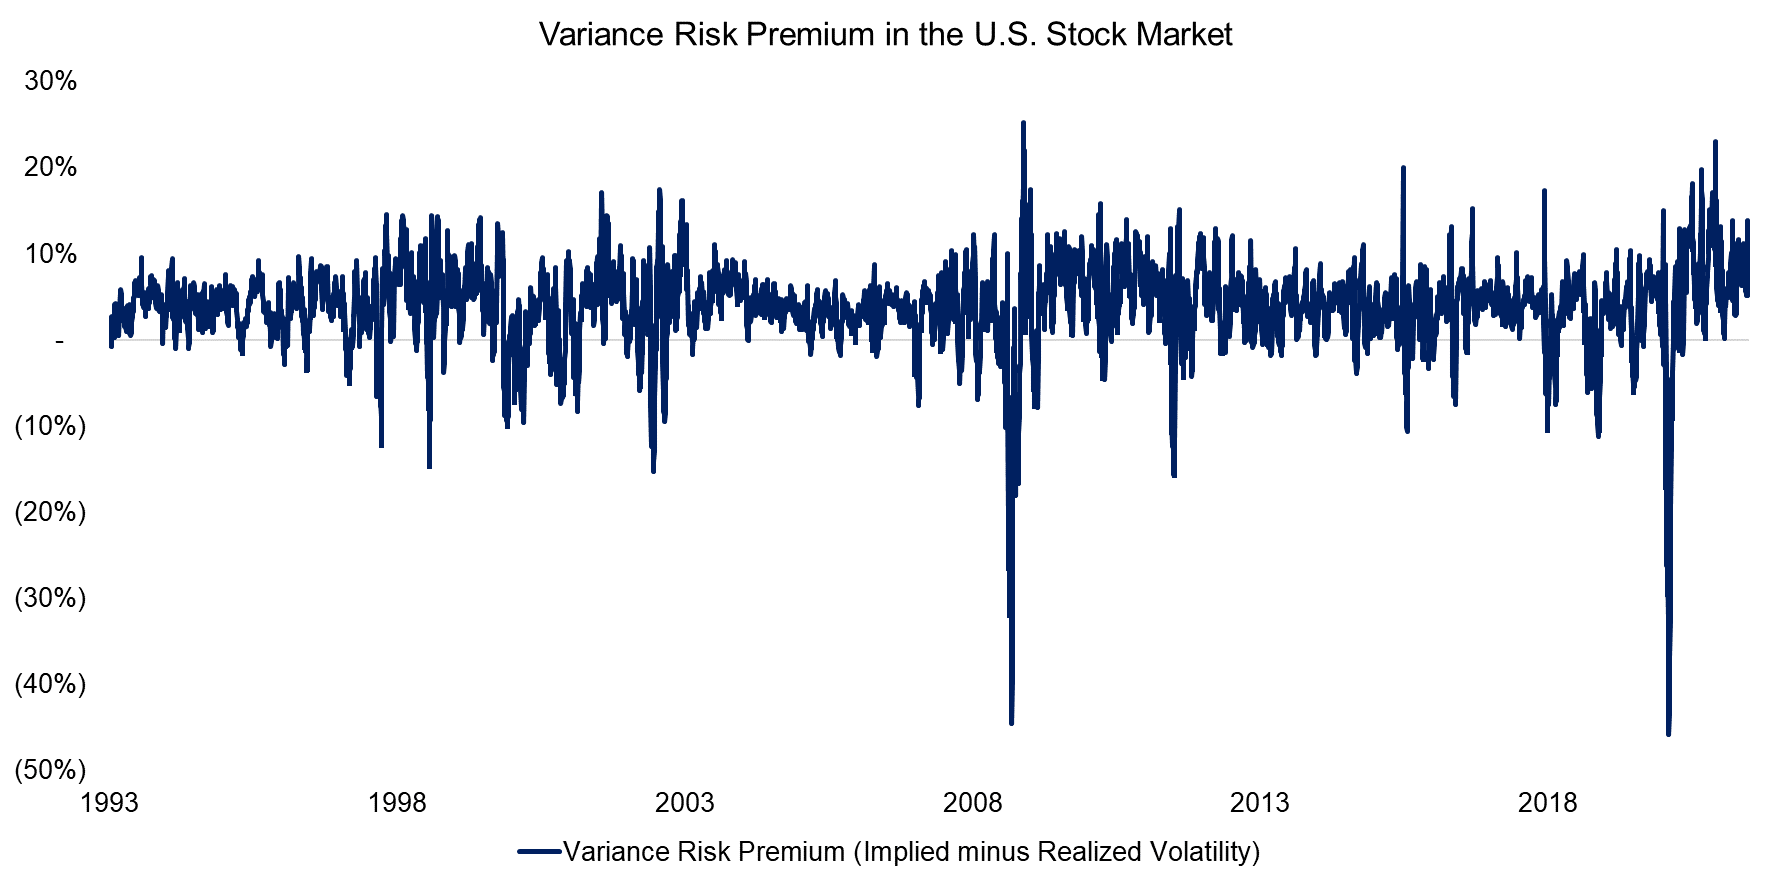
The VIX itself does currently not indicate anything unusual as it is trading at approximately 17, which is close to its long-term average of 19 since 1990. The realized volatility of the S&P 500 is below its long-term average and the variance risk premium (VRP), i.e. the difference between implied and realized volatility, is trading at above-average levels (read The Variance Risk Premium: What Premium?).
However, the VRP is not trading at record highs and is well within the historical ranges. It seems that whatever is going on in options markets has not affected the implied or realized volatility of the stock market, at least not in an extreme fashion.
Source: FactorResearch
SKEWNESS OF THE S&P 500
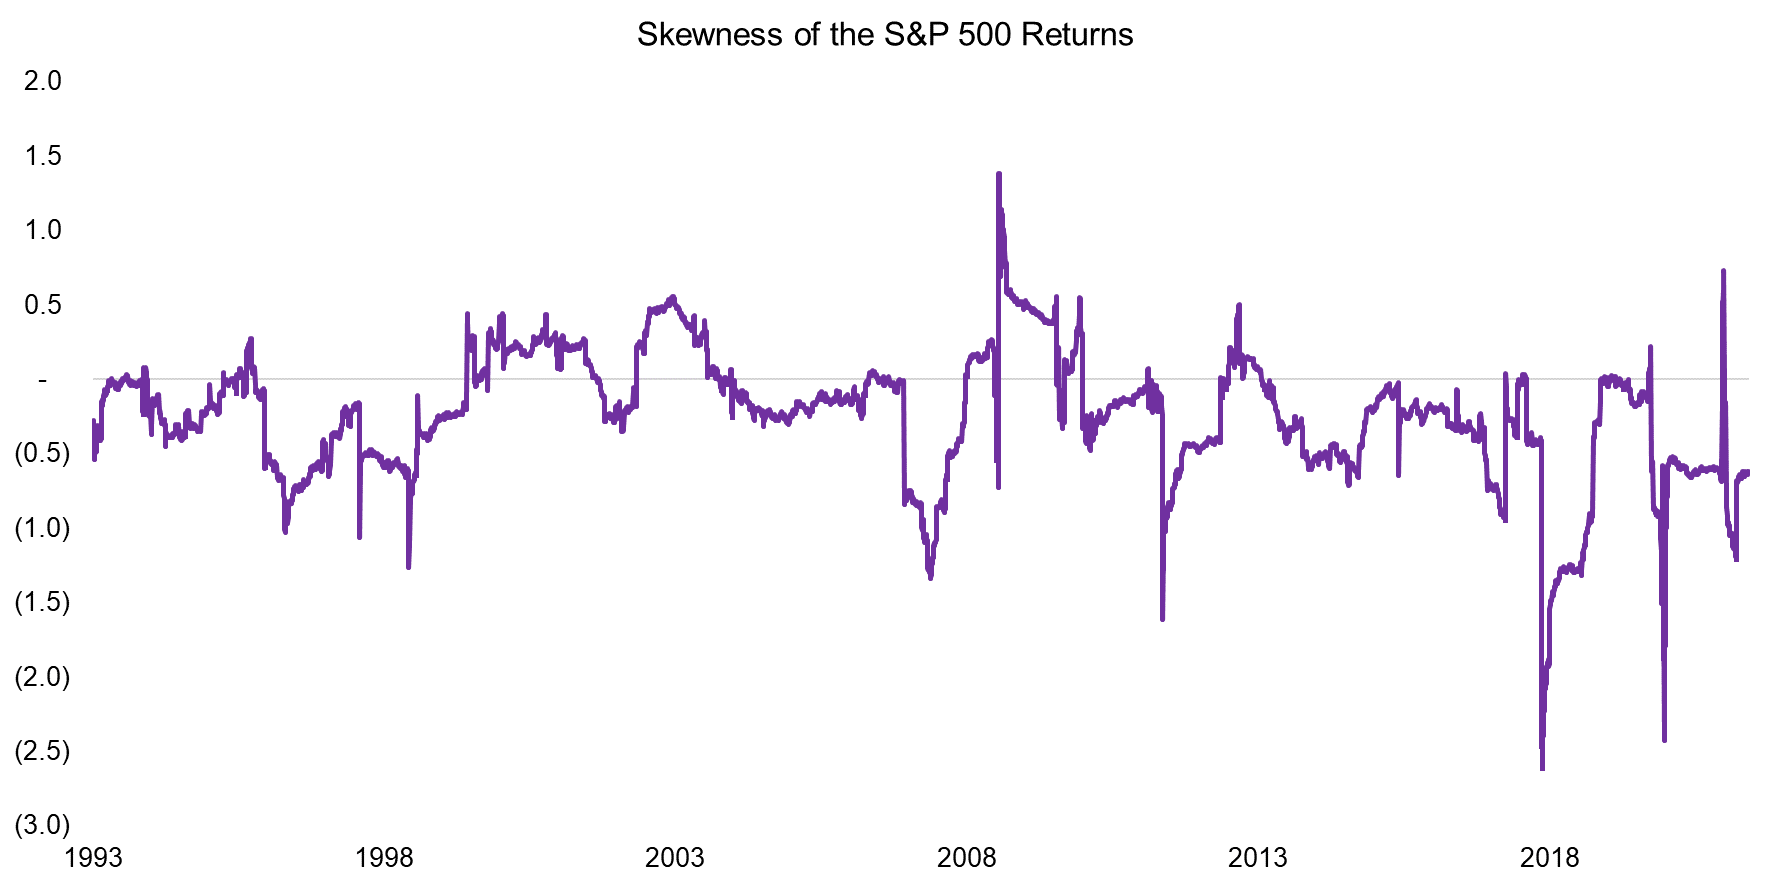
Instead of looking at the skewness of returns from the S&P 500 via the prism of options, we can also calculate this directly. We observe that the skewness of the S&P 500 returns has become more negative since the global financial crisis. Specifically, the average was -0.1 between 1993 and 2009, and -0.4 since then.
However, this is unlikely to be related to retail investors and more likely explained by the stock market performing strongly with below-average volatility and only a few steep crashes since 2009. These were corrected swiftly by the worlds’ central banks.
Source: FactorResearch
INVESTOR BEHAVIOUR
Finally, we analyze if the fundamental investor behavior has changed recently. Investors can essentially only make two types of bets: a trend will continue, or a trend will break. The former is classic momentum trading or trend following, while the latter is mean-reversion, which includes value investing.
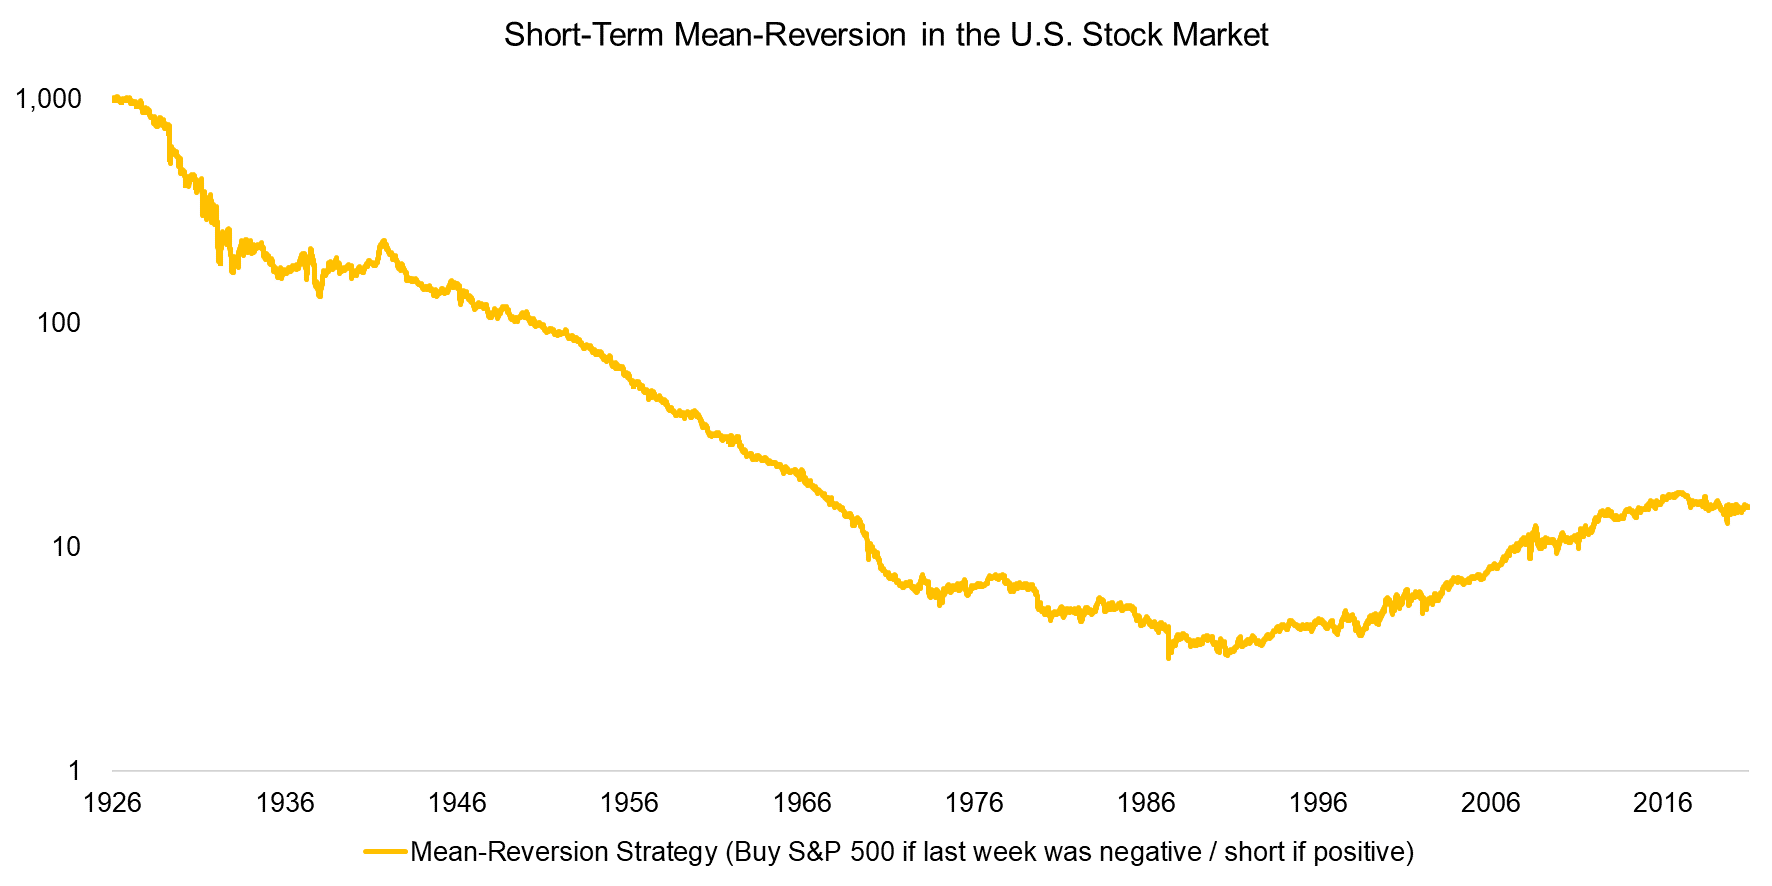
Momentum dominated the U.S. stock market between 1926 and the 1980s. A simple mean-reversion strategy of buying the S&P 500 when it was negative last week, or shorting it when it was positive, would have led to consistent losses. Stated differently, short-term momentum worked.
However, something changed in the 1980s and momentum stopped while mean-reversion started working. We believe this structural change (this time it was indeed different) is explained by the shift from retail to professional money management. Fund managers tend to have financial models that led to more or less rational buy and sell decisions based on market prices, while retail investors are primarily driven by greed and fear.
Has the resurgence of retail investors changed the market structure again? Mean-reversion on index level indeed has worked less effectively since 2016, which would tie in with higher participation of retail investors that are momentum-driven.
Source: FactorResearch
FURTHER THOUGHTS
Has the market structure changed in recent years?
Some indicators seem to suggest yes, others no, although we only looked at a few and there are many more out there.
However, it seems unlikely that the decade-long shift of capital from retail to professional investors has turned. The majority of the financial industry has little interest in empowering retail investors as its existence is based on managing other people’s money. The entrenched interests are strong.
Furthermore, retail investors are primarily tourists that only show up when the party is close to its peak. The current environment is reminiscent of the tech bubble in 2000 and the implosion of that shattered the dreams of millions of retail day traders. Markets evolve in cycles and the next bear market in traditional or crypto markets will likely lead to another exodus.
As per Robert Jordan: “The wheel of time turns, and ages come and pass….”.
RELATED RESEARCH
Mean-Reversion on Equity Index Level
Volatility, Dispersion & Correlation – Friends or Foes?
Are Stock Markets becoming more Correlated?
ABOUT THE AUTHOR
Nicolas Rabener is the CEO & Founder of Finominal, which empowers professional investors with data, technology, and research insights to improve their investment outcomes. Previously he created Jackdaw Capital, an award-winning quantitative hedge fund. Before that Nicolas worked at GIC and Citigroup in London and New York. Nicolas holds a Master of Finance from HHL Leipzig Graduate School of Management, is a CAIA charter holder, and enjoys endurance sports (Ironman & 100km Ultramarathon).
Connect with me on LinkedIn or X.

