Top vs Bottom-Ranked Factor Portfolios
Do you need to own the highest-ranked stocks?
- Intuitively, factor exposures should be maximized when seeking outperformance
- While this is true for momentum, it does not apply to the value or size factors
- Investors do not constantly need to rebalance and seek the stocks with the highest factor exposures
INTRODUCTION
Factor investing remains one of the few reliable strategies for generating outperformance over the medium to long term. Yet, constructing a factor-driven portfolio is far from straightforward. Investors must navigate a series of complex decisions, including factor selection, combination methodology, stock weighting, tradable universe definition, rebalancing frequency, and portfolio concentration.
Conceptually, greater portfolio concentration should amplify factor exposures and, in turn, enhance outperformance. However, as we discussed in a previous article, this relationship is not always linear, particularly for the size factor, where returns did not consistently increase when moving from the largest to the smallest market-cap portfolios (read The Illusion of the Small-Cap Premium).
In this research article, we will explore the relationship between factor returns and factor exposures.
FACTOR RETURNS BY PORTFOLIO DECILES
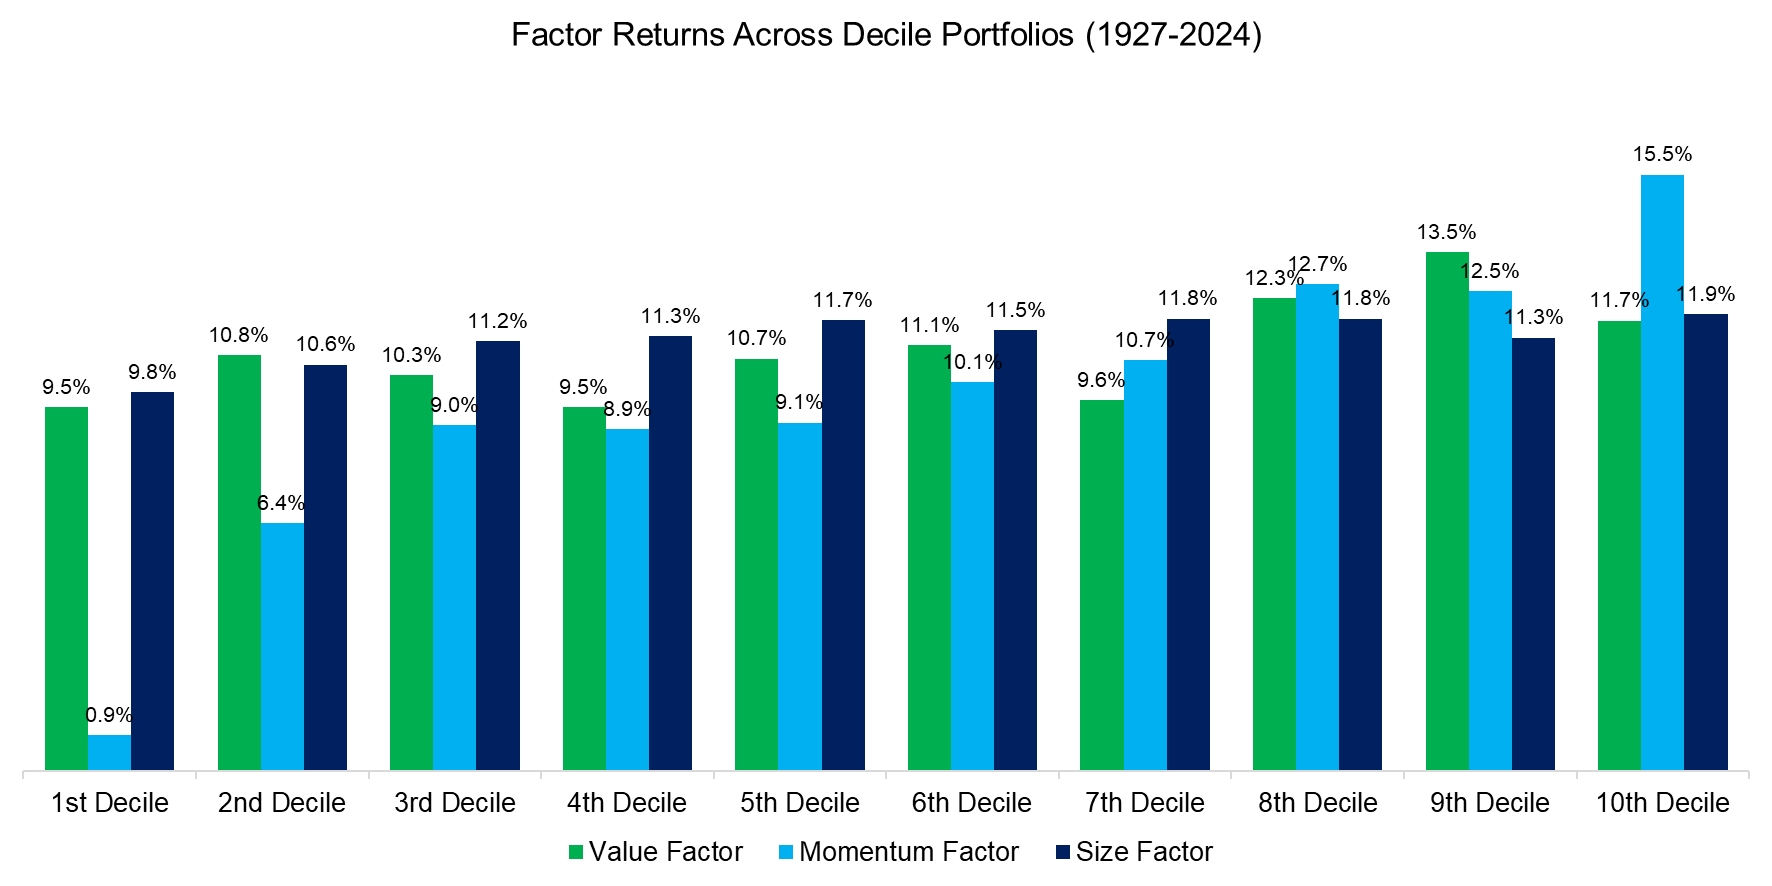
In this analysis, we examine the long-only, market capitalization-weighted returns of the value, size, and momentum factors, using data from the Kenneth R. French Data Library. For each factor, we calculate the compound annual growth rates (CAGRs) across deciles for the period from 1927 to 2024. The top decile (10th) represents cheap, high-performing small-cap stocks, while the bottom decile (1st) reflects expensive, underperforming large-cap stocks.
In theory, we would expect a linear decline in returns from the 10th to the 1st decile. However, this pattern is most clearly observed in the momentum factor, while the value and size factors show more variation across deciles.

Source: Kenneth R. French Data Library, Finominal
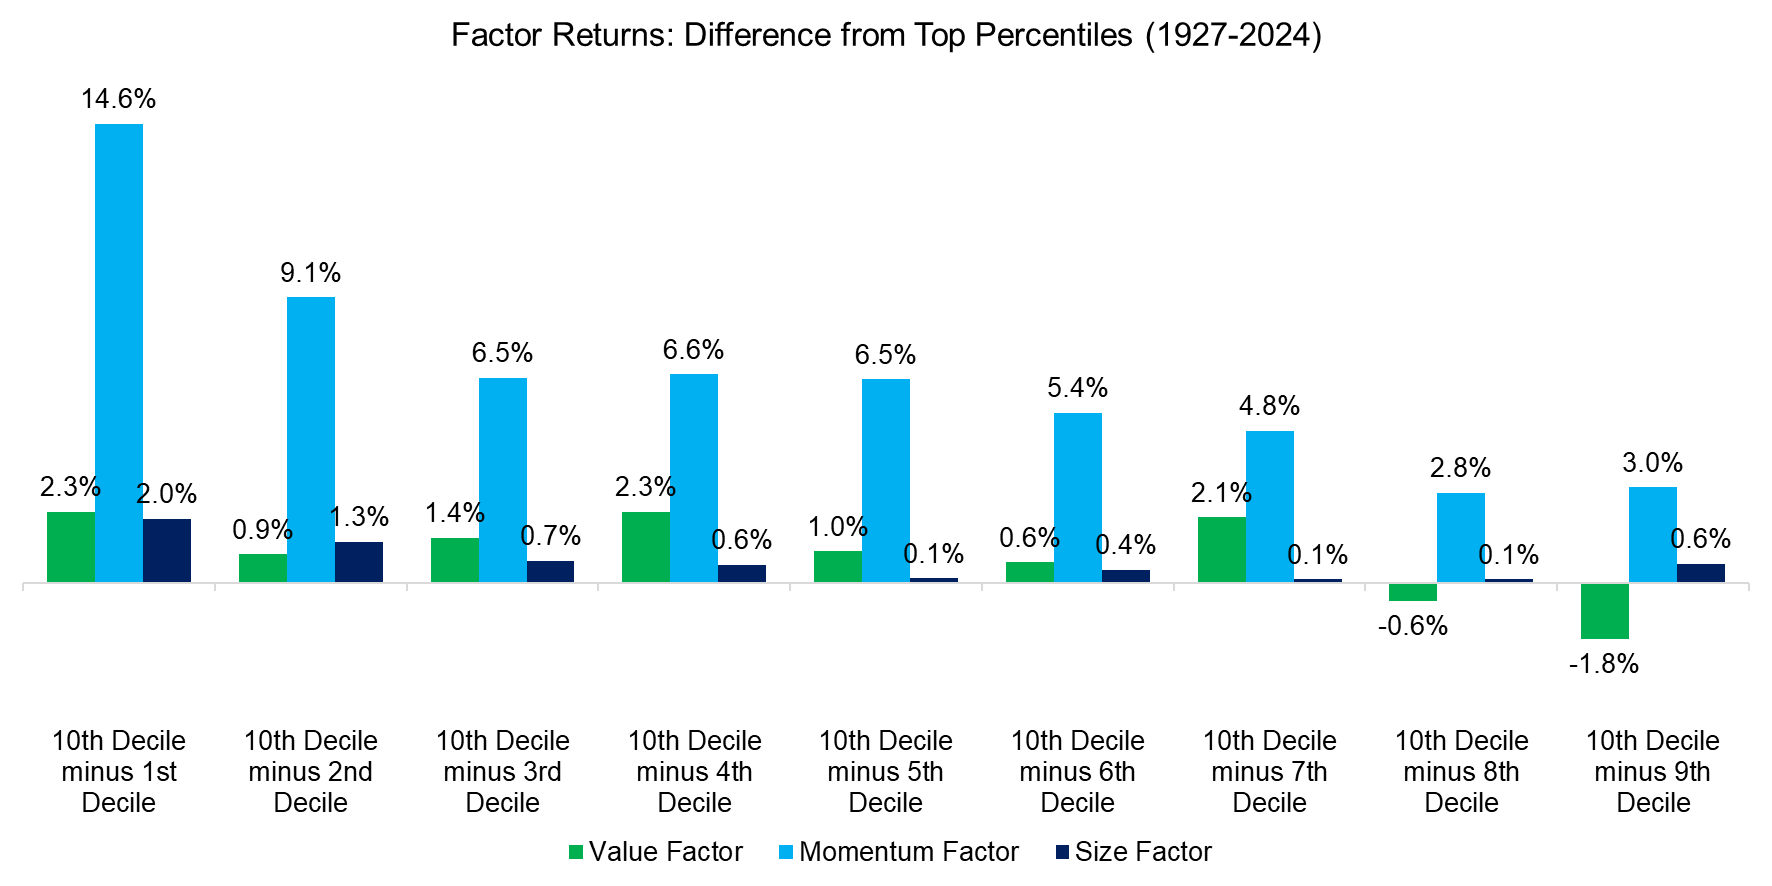
To refine the analysis, we calculate return differentials between the top decile and the other nine deciles. While we would expect the largest spread between the 10th and 1st deciles, this holds true only for the momentum and size factors. In the case of value, the 4th decile, which represents fairly valued stocks, delivered returns comparable to those of the cheapest decile. For the size factor, the return profile resembles a “smile,” where mid-cap stocks underperformed both large- and small-caps.
The key takeaway: for momentum, performance hinges on owning the best-performing stocks and avoiding the worst. For value, it’s more about steering clear of the most expensive stocks than targeting the cheapest.

Source: Kenneth R. French Data Library, Finominal
VOLATILITY OF FACTOR PORTFOLIOS
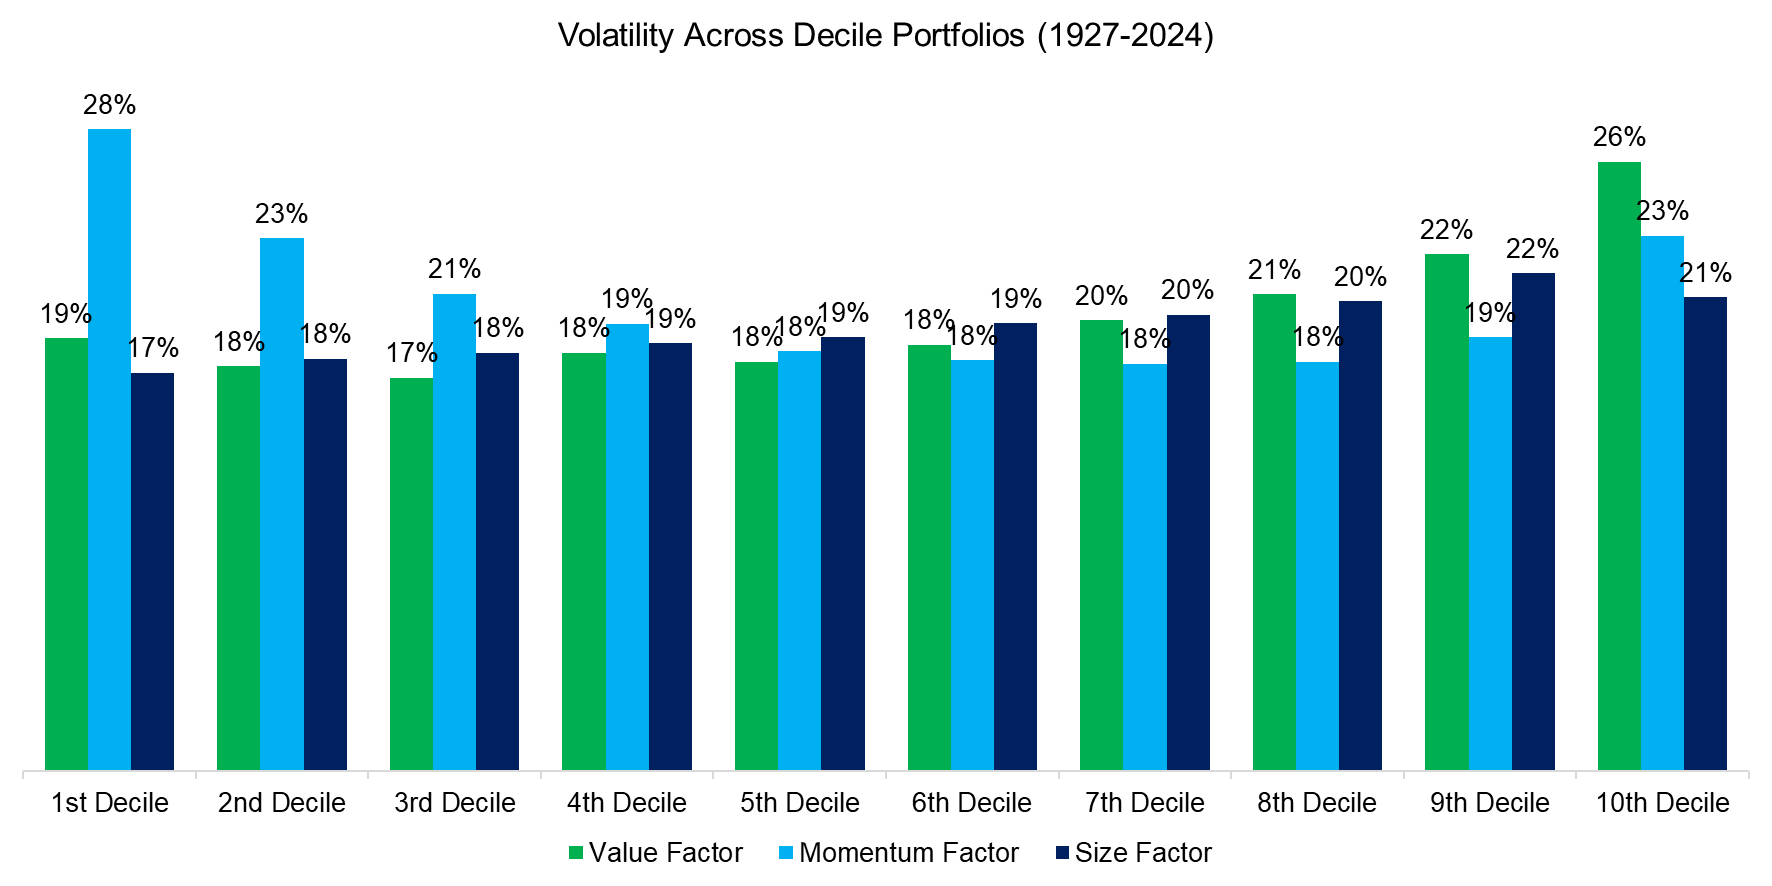
Next, we calculate the volatility of the decile portfolios, revealing a clear pattern: volatility tends to be higher at the extremes. The most volatile portfolio consists of the worst-performing stocks, while the least volatile includes the largest and most expensive stocks. Notably, the cheapest stocks also exhibit relatively high volatility, underscoring the risk associated with what are commonly called value traps, ie, stocks that are cheap perpetually for structural reasons.

Source: Kenneth R. French Data Library, Finominal
SHARPE RATIOS OF FACTOR PORTFOLIOS
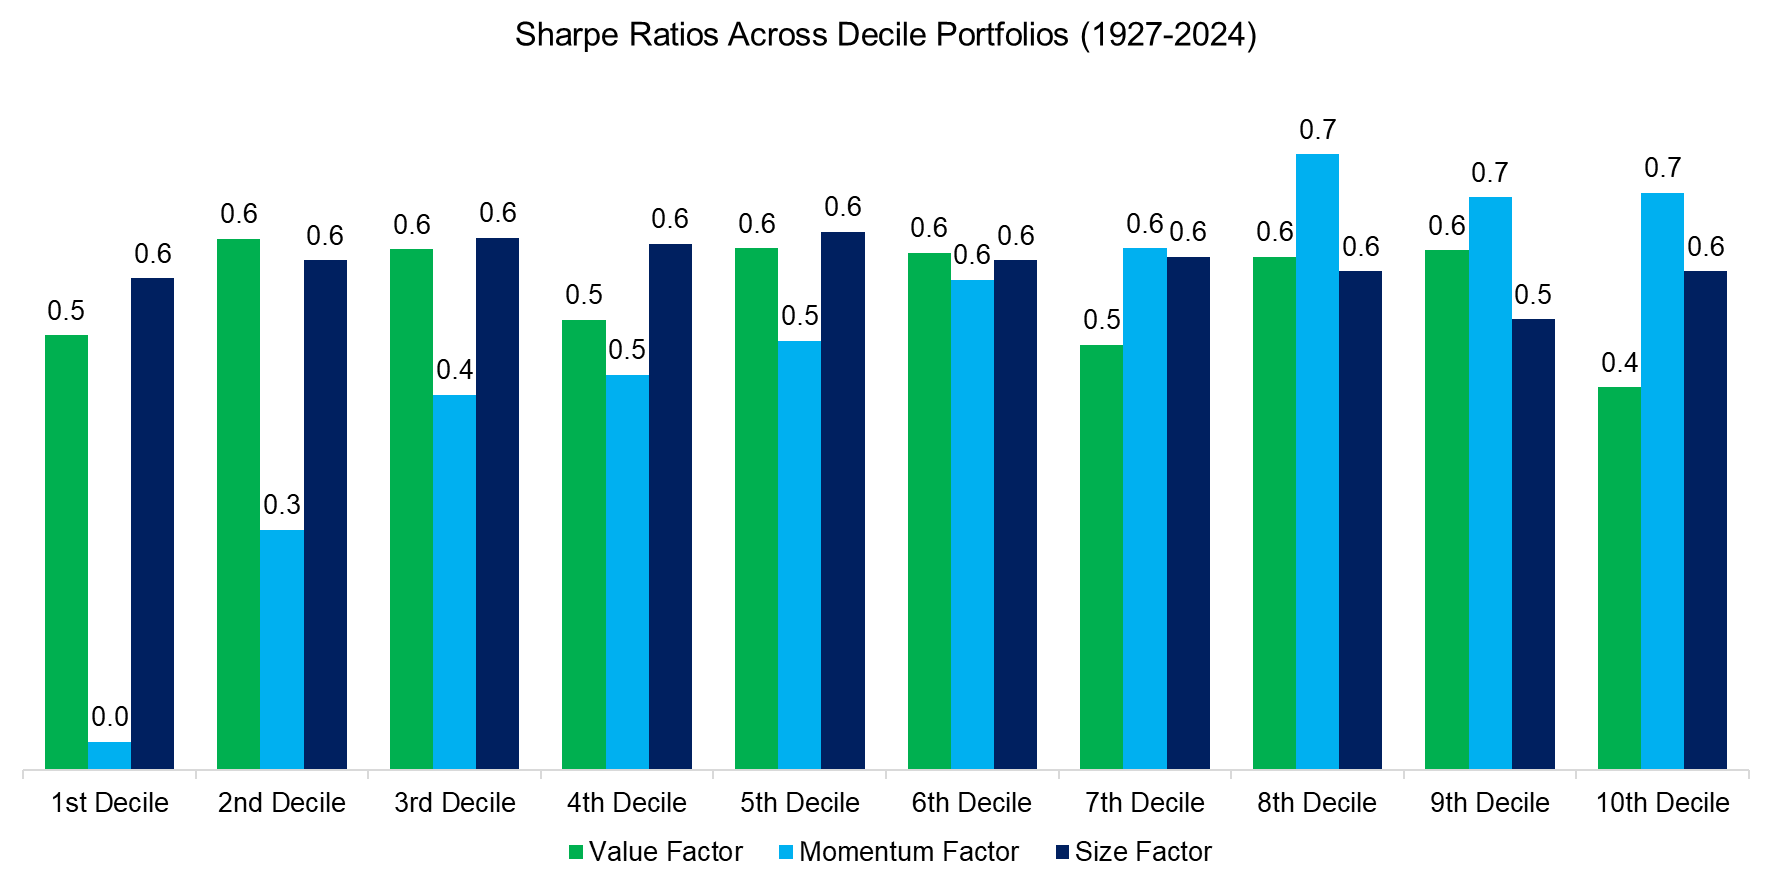
Finally, we calculate the Sharpe ratios for the factor-based decile portfolios. As anticipated, the Sharpe ratios for the momentum-sorted portfolios exhibit a near-linear decline across deciles going from the outperforming to underperforming stocks.
In contrast, no clear pattern emerges for portfolios sorted by value or size. Notably, the portfolio comprising the cheapest stocks records the lowest Sharpe ratio, underscoring that low valuations alone are not a compelling indicator of attractive stock performance.

Source: Kenneth R. French Data Library, Finominal
FURTHER THOUGHTS
Holding only the highest-ranked stocks may seem intuitive when constructing a factor-based investment strategy, but this leads to higher transaction costs and portfolio maintenance. This analysis, however, reveals that while precise factor rankings are critical for momentum, their significance is less pronounced for value and size, where performance appears more broadly distributed across ranks. Keep calm and carry on.
RELATED RESEARCH
Market-Neutral versus Smart Beta Factor Investing
Multi-Factor Smart Beta ETFs
Factors: Shorting Stocks vs the Index
Factor Investing Is Dead, Long Live Factor Investing!
The Case Against Factor Investing
Smart Beta ETF Construction: High versus Low Factor Exposures
Smart Beta ETF vs Customized Factor Portfolios
Multi-Factor Models 101
Factor Exposure Analysis 114: Factor Offsetting
ABOUT THE AUTHOR
Nicolas Rabener is the CEO & Founder of Finominal, which empowers professional investors with data, technology, and research insights to improve their investment outcomes. Previously he created Jackdaw Capital, an award-winning quantitative hedge fund. Before that Nicolas worked at GIC and Citigroup in London and New York. Nicolas holds a Master of Finance from HHL Leipzig Graduate School of Management, is a CAIA charter holder, and enjoys endurance sports (Ironman & 100km Ultramarathon).
Connect with me on LinkedIn or X.

