Value Factor: Improving the Tax Efficiency
Do Value Stocks Need to be Dividend-Yielding?
April 2018. Reading Time: 10 Minutes. Author: Nicolas Rabener.
SUMMARY
- The tax efficiency of the Value factor can be improved by reducing exposure to dividend-yielding stocks
- Improving the tax efficiency reduces the performance in Europe and Japan, but not in the US
- Reducing turnover can be considered for minimising capital gains and stamp duty taxes
INTRODUCTION
Tax is not a particular exciting dinner party topic, but is highly relevant for net investor returns. A UK-based investor buying Swiss quality stocks like the food company Nestle or the pharmaceutical company Novartis has to pay a 35% tax on dividends, which reduces the post-tax return significantly. Then there are also capital gains taxes and special taxes like stamp duty in countries like Hong Kong and Singapore, which incentivize investors to minimise portfolio turnover.
In factor investing, some strategies are more affected by taxes than others. Value stocks are often also high-yielding stocks, which makes them unattractive from a dividend tax perspective. In this short research note we aim to improve the tax-efficiency of the Value factor by decreasing the exposure to dividend-yielding stocks (read Resist the Siren Call of High Dividend Yields).
METHODOLOGY
We focus on the Value factor, which selects stocks based on a combination of price-to-book and price-to-earnings ratios, and the Dividend Yield factor, which ranks stocks by the current dividend yield. The factors are created via long-short beta-neutral portfolios based on the top and bottom 10% stocks in the US, Europe and Japan. Only stocks with a market capitalisation of larger than $1 billion are included. Portfolios are rebalanced monthly and each transaction incurs costs of 10 basis points.
Although this research note focuses on improving the tax efficiency of the Value factor, all returns are shown pre-tax as taxes tend to be different for institutional and retail investors, dependent where the dividend was incurred and where the investor is domiciled.
VALUE VERSUS DIVIDEND YIELD FACTOR
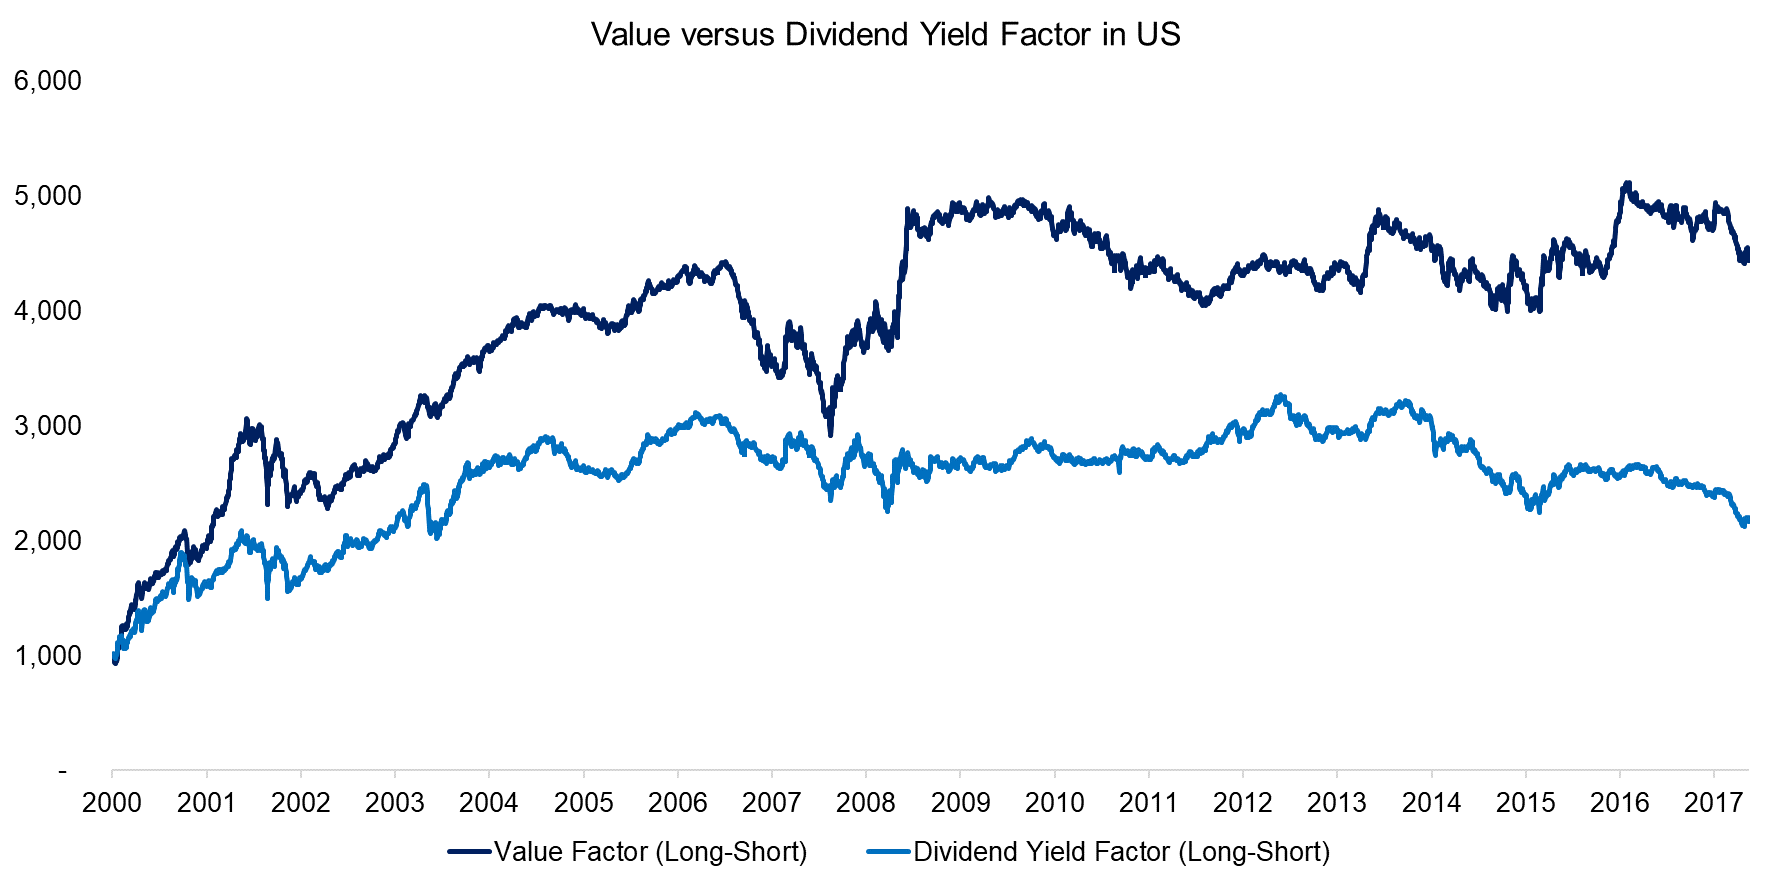
There are various ways of defining Value stocks and the most common metrics are likely price-to-book, price-to-earnings, price-to-cashflow and enterprise value-to-EBITDA. Dividend Yield is an alternative method for sorting cheap and expensive stocks, although it can be challenged as it is not a particularly precise reflection of a company’s cashflow generation. The dividend depends on a company’s payout ratio, which is typically below 100% of earnings. However, there is still a strong relationship between the Value and Dividend Yield factors, which is highlighted in the chart below.
Source: FactorResearch
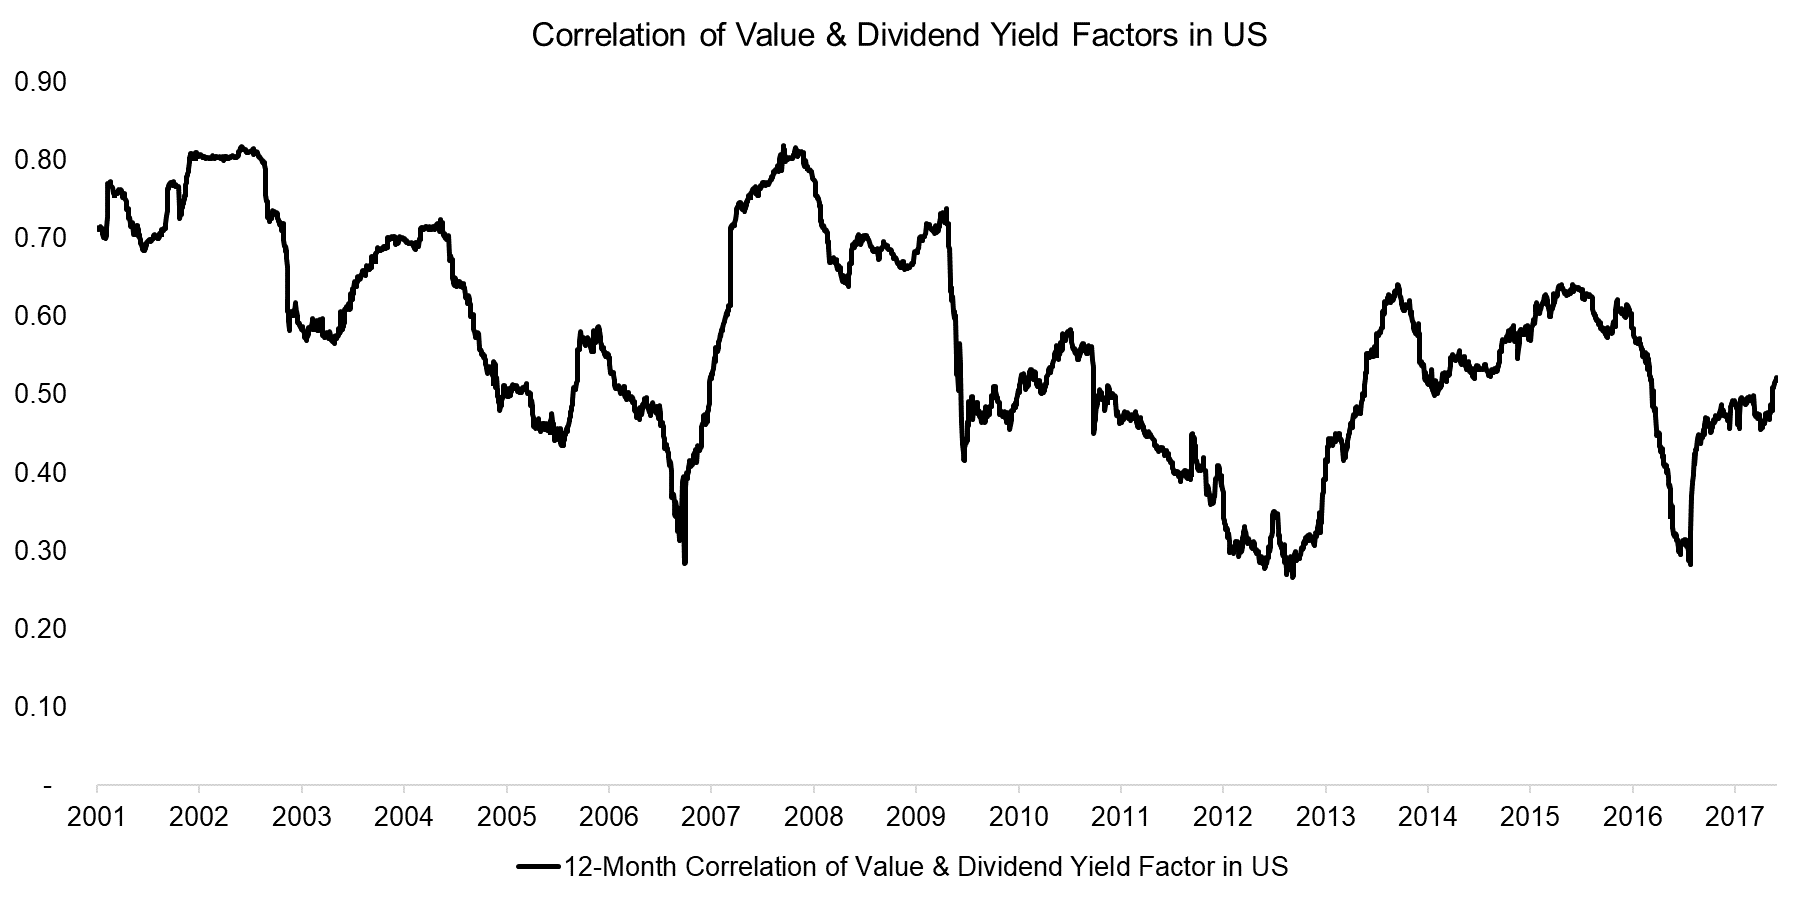
The chart below shows the correlation of the Value and Dividend Yield factors in the US, which highlights that the correlation is high on average, but has been decreasing since the turn of the century. Dividend Yield has likely become a less effective valuation metric in recent years as companies have increasingly used stock buybacks to return profits to shareholders.
Source: FactorResearch
VALUE FACTOR AND DIVIDEND YIELDS
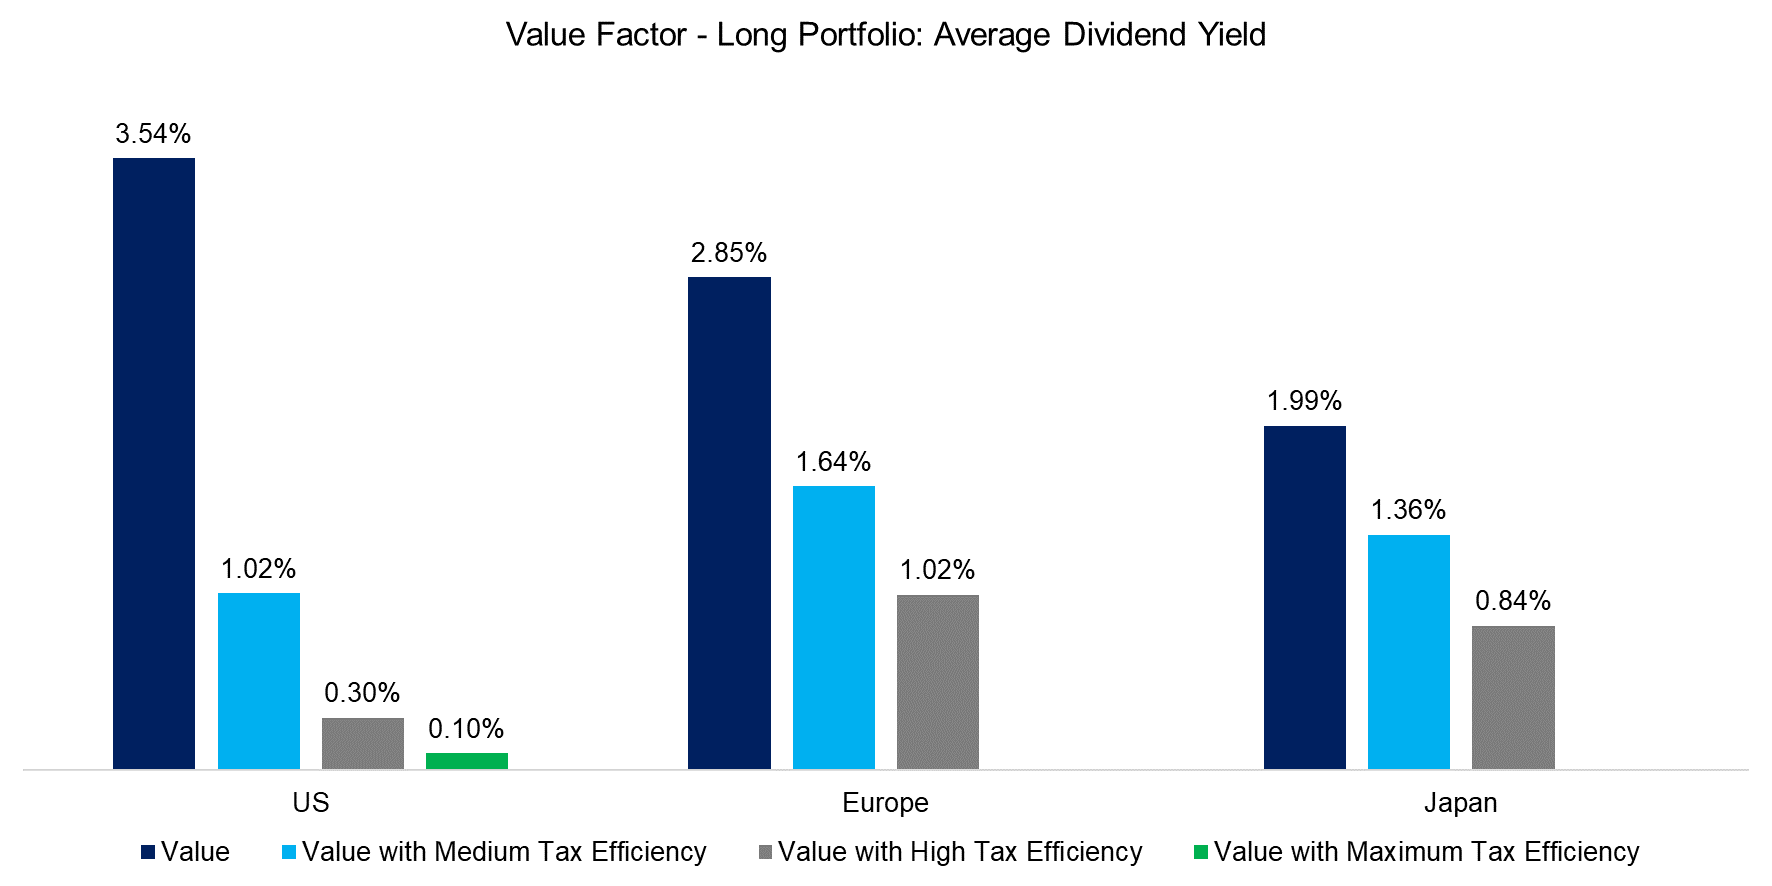
In order to improve the tax efficiency of the Value factor the exposure to dividend yielding-stocks is reduced. The chart below shows the average dividend yield of the long portfolio of the Value factor and scenarios with higher tax efficiency, i.e. lower dividend yields, which results in higher post-tax returns. The scenario referenced as medium tax efficiency excludes the top 25% of highest yielding stocks, high tax efficiency the top 50% and maximum tax efficiency the top 75%. It is worth highlighting that excluding all stocks that pay dividends is challenging as there are few stocks that are cheap and pay no dividend, especially in Europe and Japan, which is why there is no maximum tax efficiency scenario for these two regions. There is no taxation of dividends derived from the short portfolio of the factor, which need to be paid to the lender of shares.
Source: FactorResearch
VALUE FACTOR IN US: IMPROVING THE TAX EFFICIENCY
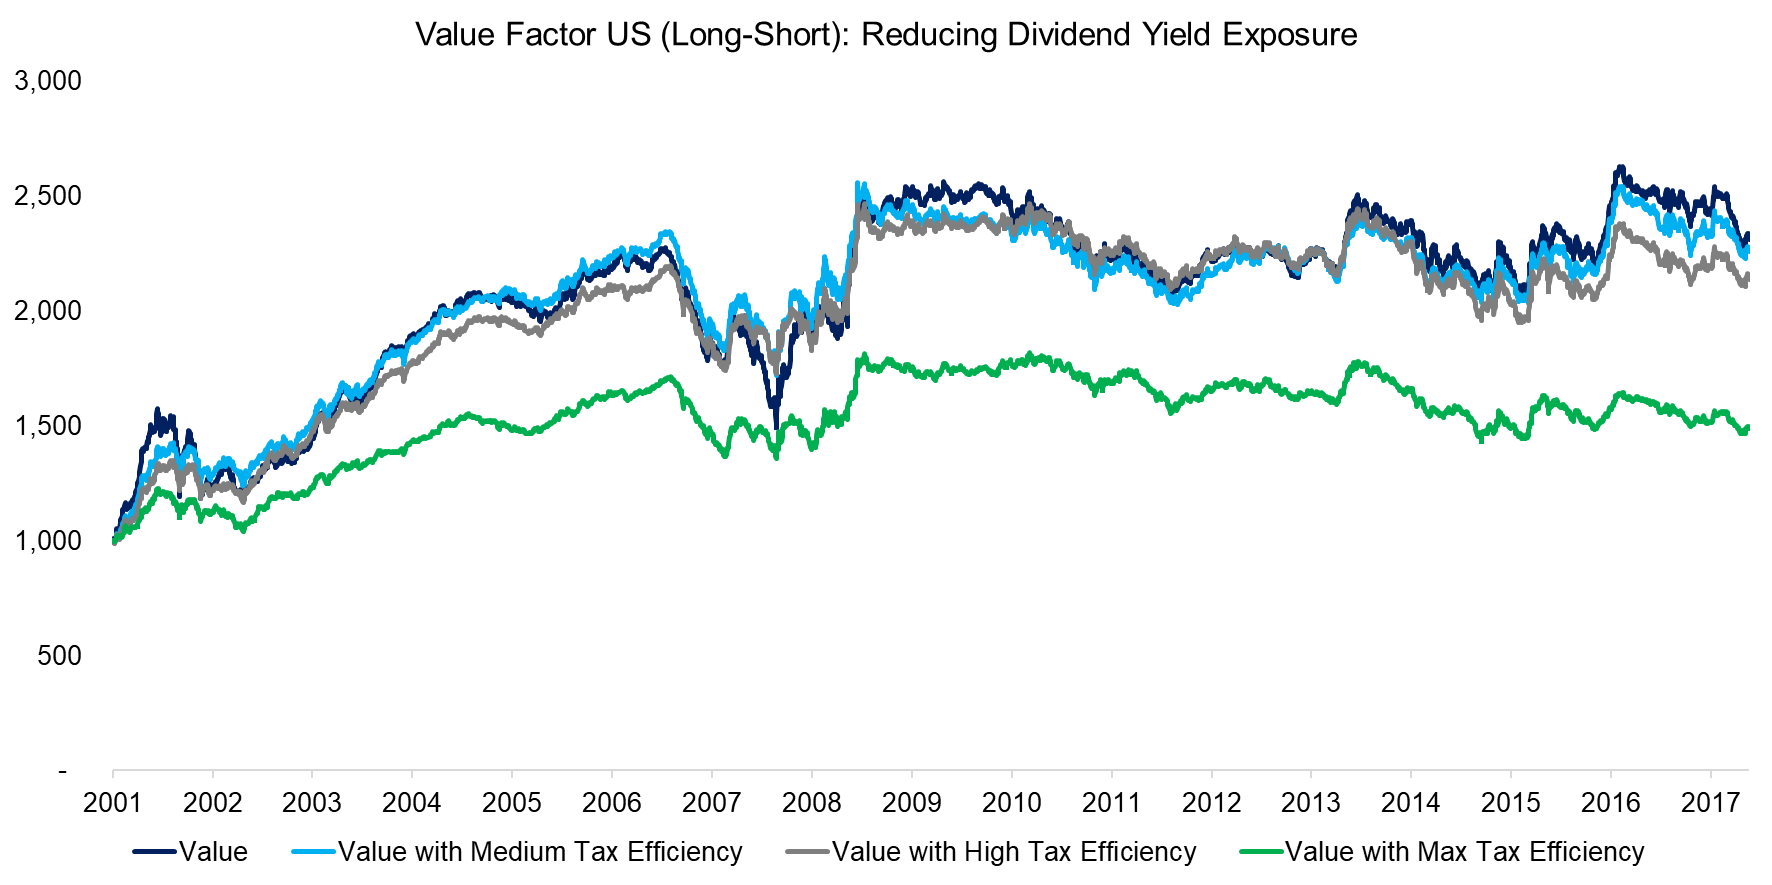
The chart below shows the performance of the Value factor and scenarios with improved tax efficiency. We can observe that the scenarios with medium and high tax efficiency are almost identical to the base case, which implies that there are sufficient stocks that are cheap and feature a low or zero dividend yield. However, the maximum tax efficiency scenario, which features mostly stocks with no dividends, e.g. Berkshire Hathaway, is significantly lower. It is worth highlighting that the performance of the scenarios with improved tax efficiency is understated as they are shown pre-tax, i.e. the performance post-tax would be higher. Naturally this depends on the taxation of the investor.
Source: FactorResearch
VALUE FACTOR IN EUROPE: IMPROVING THE TAX EFFICIENCY
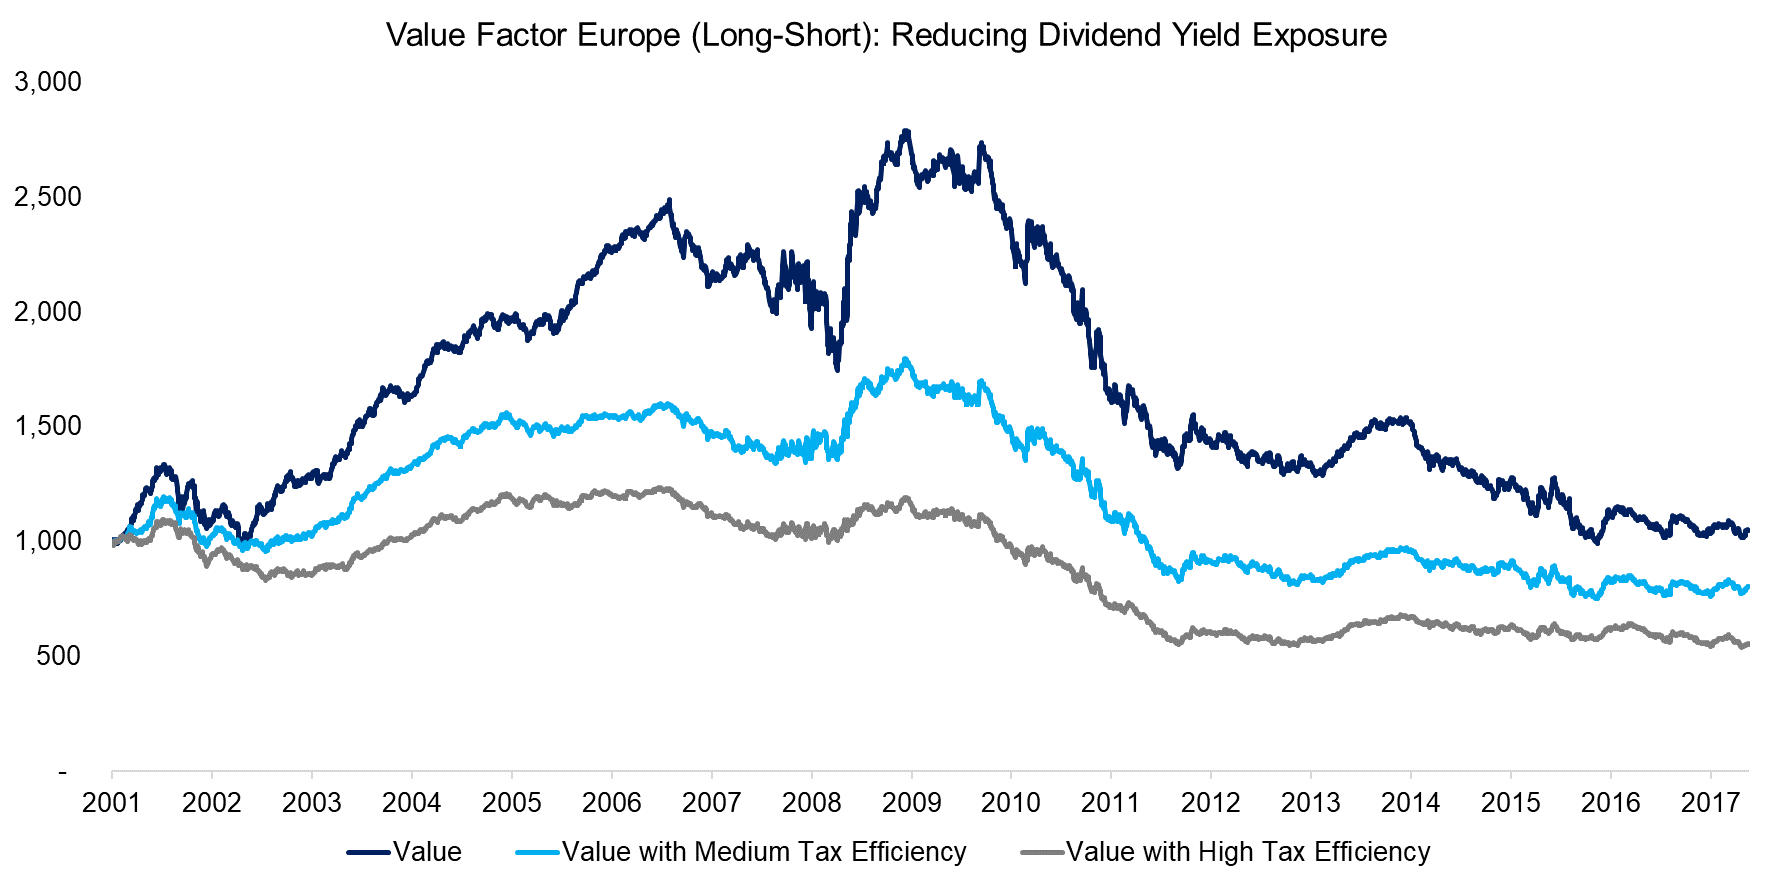
The performance of the Value factor scenarios in Europe are more heterogeneous compared to the US. The results highlight that reducing the exposure to dividend-yielding stocks in Europe has a negative impact on performance, which implies that cheap stocks tend to feature high dividend yields. The universe of stocks in Europe is approximately 30% of the US, therefore there is less choice in stock selection.
Source: FactorResearch
VALUE FACTOR JAPAN: IMPROVING TAX EFFICIENCY
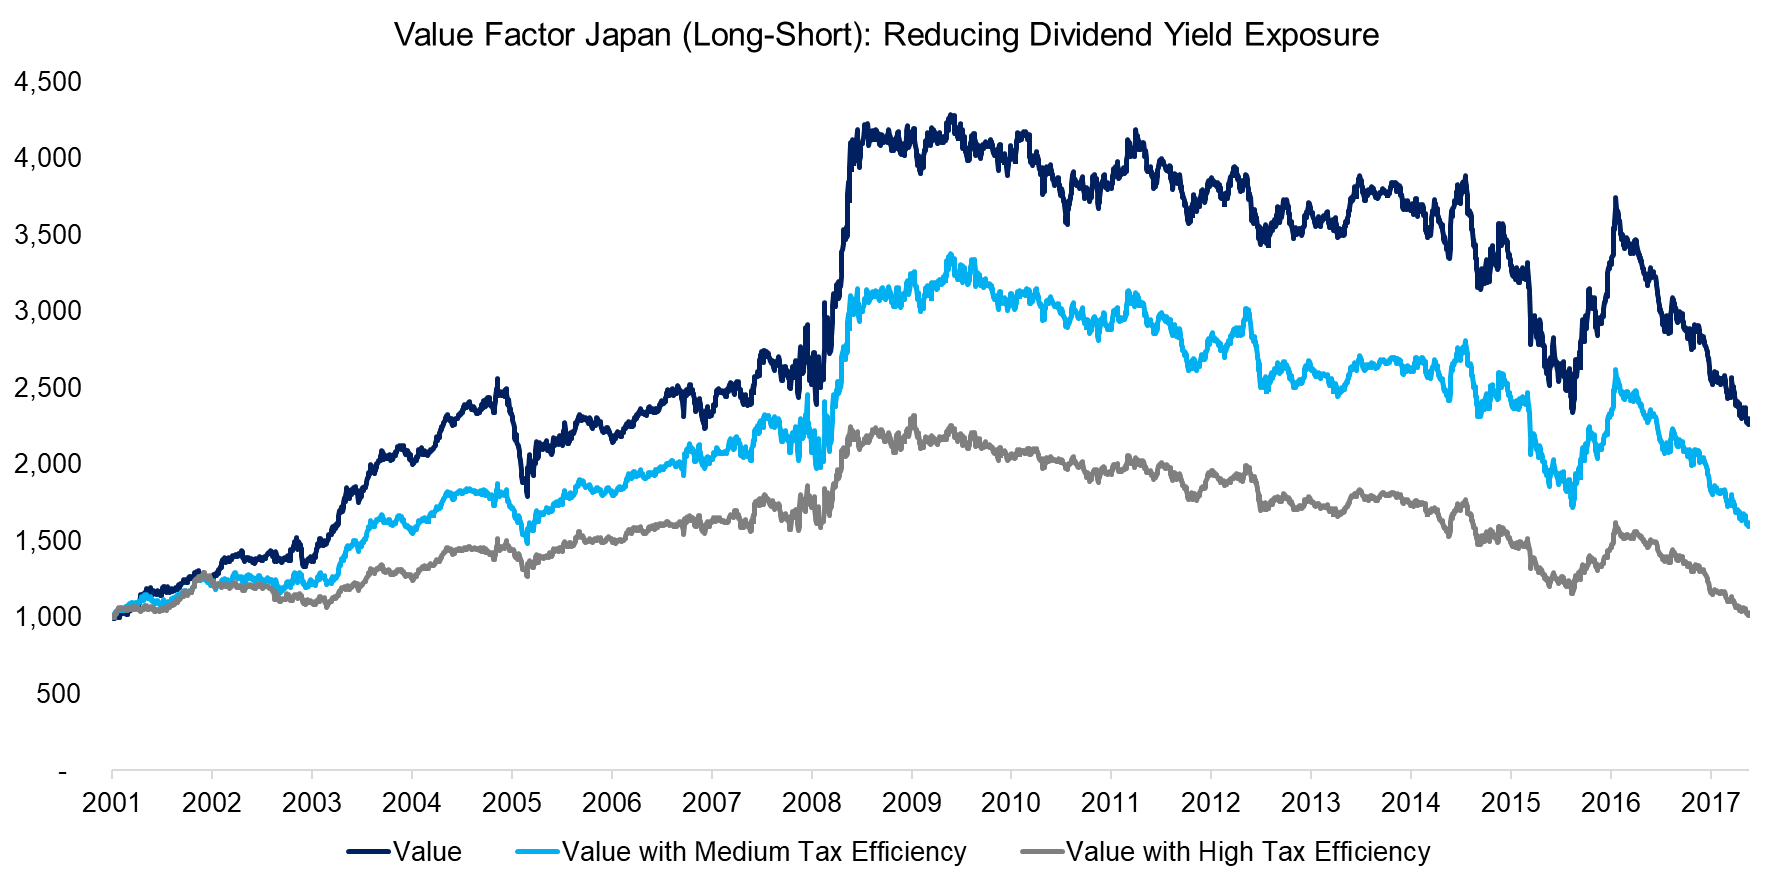
The results in Japan are comparable to Europe, i.e. reducing the exposure to dividend-yielding stocks decreases the performance of the Value factor significantly. It is worth highlighting that most companies in Japan and Europe pay dividends while in the US a significant portion of the stock universe does not, which can be partially explained by the large amount of Technology stocks in the US.
Source: FactorResearch
RISK-RETURN RATIOS
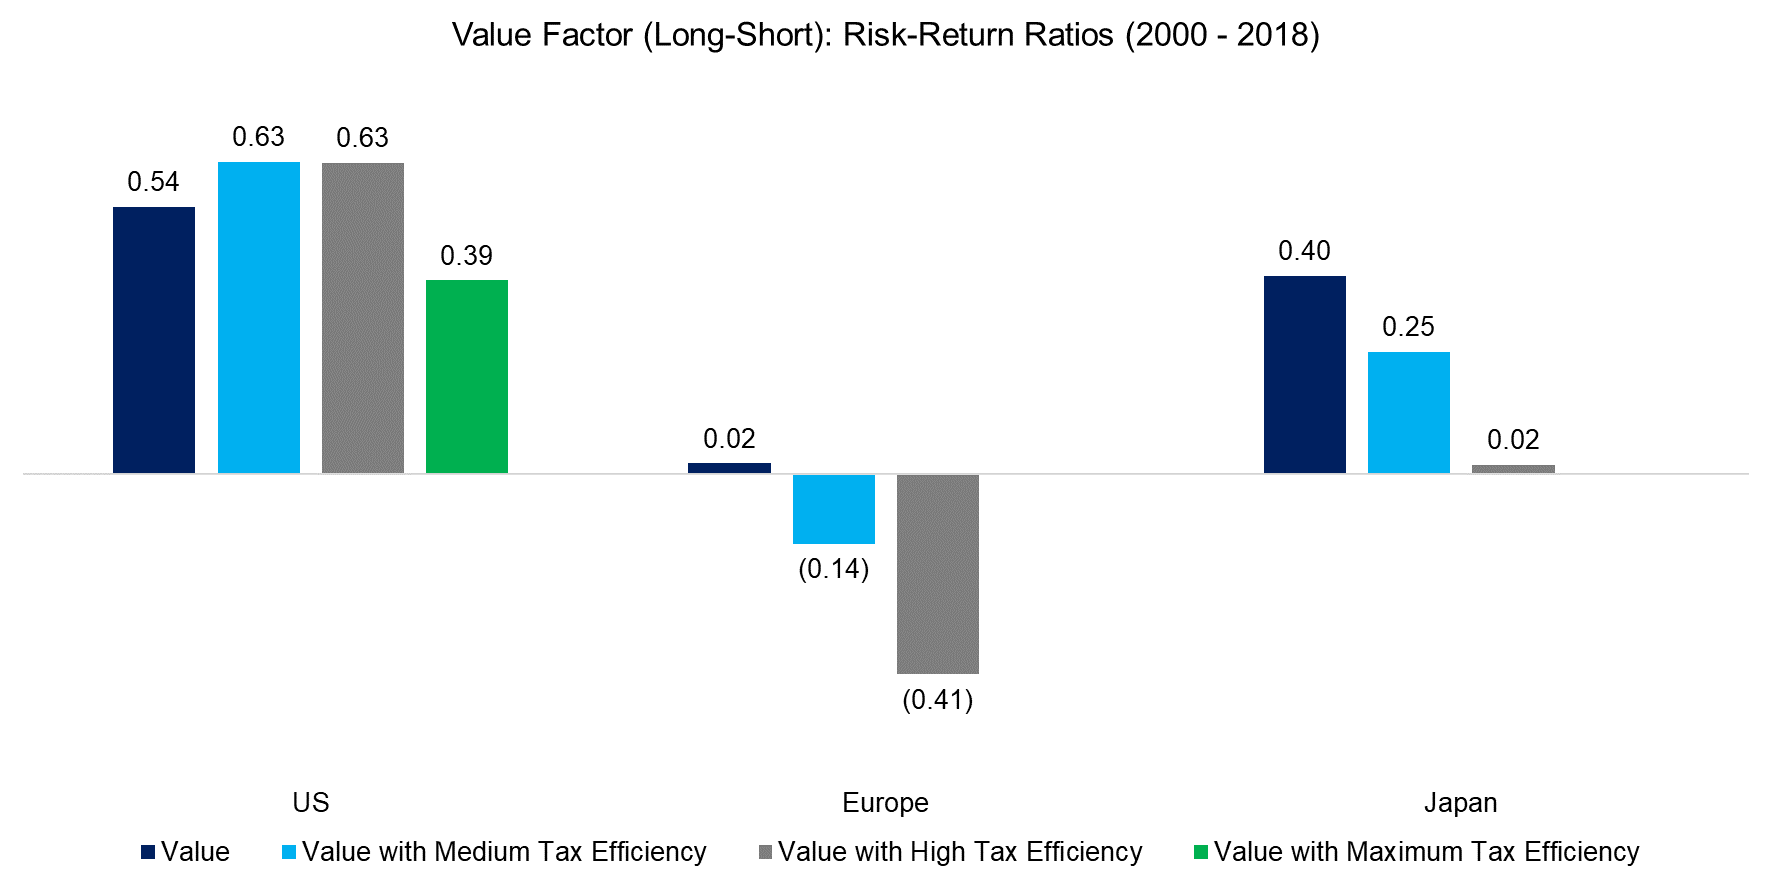
In addition to analysing the performance of the Value factor scenarios we can show the risk-return ratios, which improve with higher tax efficiency in the US and decrease in Europe and Japan. On a post-tax basis the ratios of the scenarios with improved tax efficiency would be higher, but unlikely more attractive than the base case in Europe or Japan.
Source: FactorResearch
FURTHER THOUGHTS
This short research note highlights that the Value factor can be improved by reducing the exposure to dividend-yielding stocks, albeit not in every region. Investors can also contemplate reducing capital gains or stamp duty taxes by decreasing the portfolio turnover, which may be achieved by rebalancing less frequently (please see our report Factor Portfolios: Turnover Analysis) or changing factor definitions. Tax-optimisation is a complex subject, but worth pursuing as the gains can be substantial.
ABOUT THE AUTHOR
Nicolas Rabener is the CEO & Founder of Finominal, which empowers professional investors with data, technology, and research insights to improve their investment outcomes. Previously he created Jackdaw Capital, an award-winning quantitative hedge fund. Before that Nicolas worked at GIC and Citigroup in London and New York. Nicolas holds a Master of Finance from HHL Leipzig Graduate School of Management, is a CAIA charter holder, and enjoys endurance sports (Ironman & 100km Ultramarathon).
Connect with me on LinkedIn or X.

