Value & Quality Factor Valuations
Where is the Value?
June 2017. Reading Time: 10 Minutes. Author: Nicolas Rabener.
SUMMARY
- Value and Quality stocks are typically polar opposites from a valuation perspective
- The Value factor can be considered cheap across developed markets
- The Quality factor is cheap in some and expensive in other markets
INTRODUCTION
The day after the US election in November 2016 there was a massive shift in sentiment from risk-off to risk-on as investors changed their perception from seeing Trump as a political risk to a political asset. The Value factor generated strong positive performance while Quality decreased significantly. In the months following the election the sentiment changed again and in the first quarter of 2017 Quality outperformed Value. In this short research note we’re going to analyse the current factor valuations of Value and Quality using valuation spreads.
METHODOLOGY
The Value portfolios are calculated by using a combination of price-to-earnings and price-to-book ratios while return-on-equity and debt-to-equity are used for the Quality portfolios. Both factors can be defined in many ways, however, by using these ratios we keep the investible universe quite large. It’s worth highlighting that the factor trends look much more similar when using different Value metrics than with different Quality metrics as these tend to be more heterogenous. We take the bottom and top 10% for the US, Europe, and Japan and 20% for UK and Australia as they have smaller stock universes.
Stocks can be valued by applying different valuation methodologies and the same applies to factors, which are much more abstract than single stocks. We are going to analyse factors by looking the difference between the long and short portfolios in terms of price-to-book (PB) multiples, which we call valuation spreads (read Value US: Sectoral Analysis).
VALUE VS QUALITY
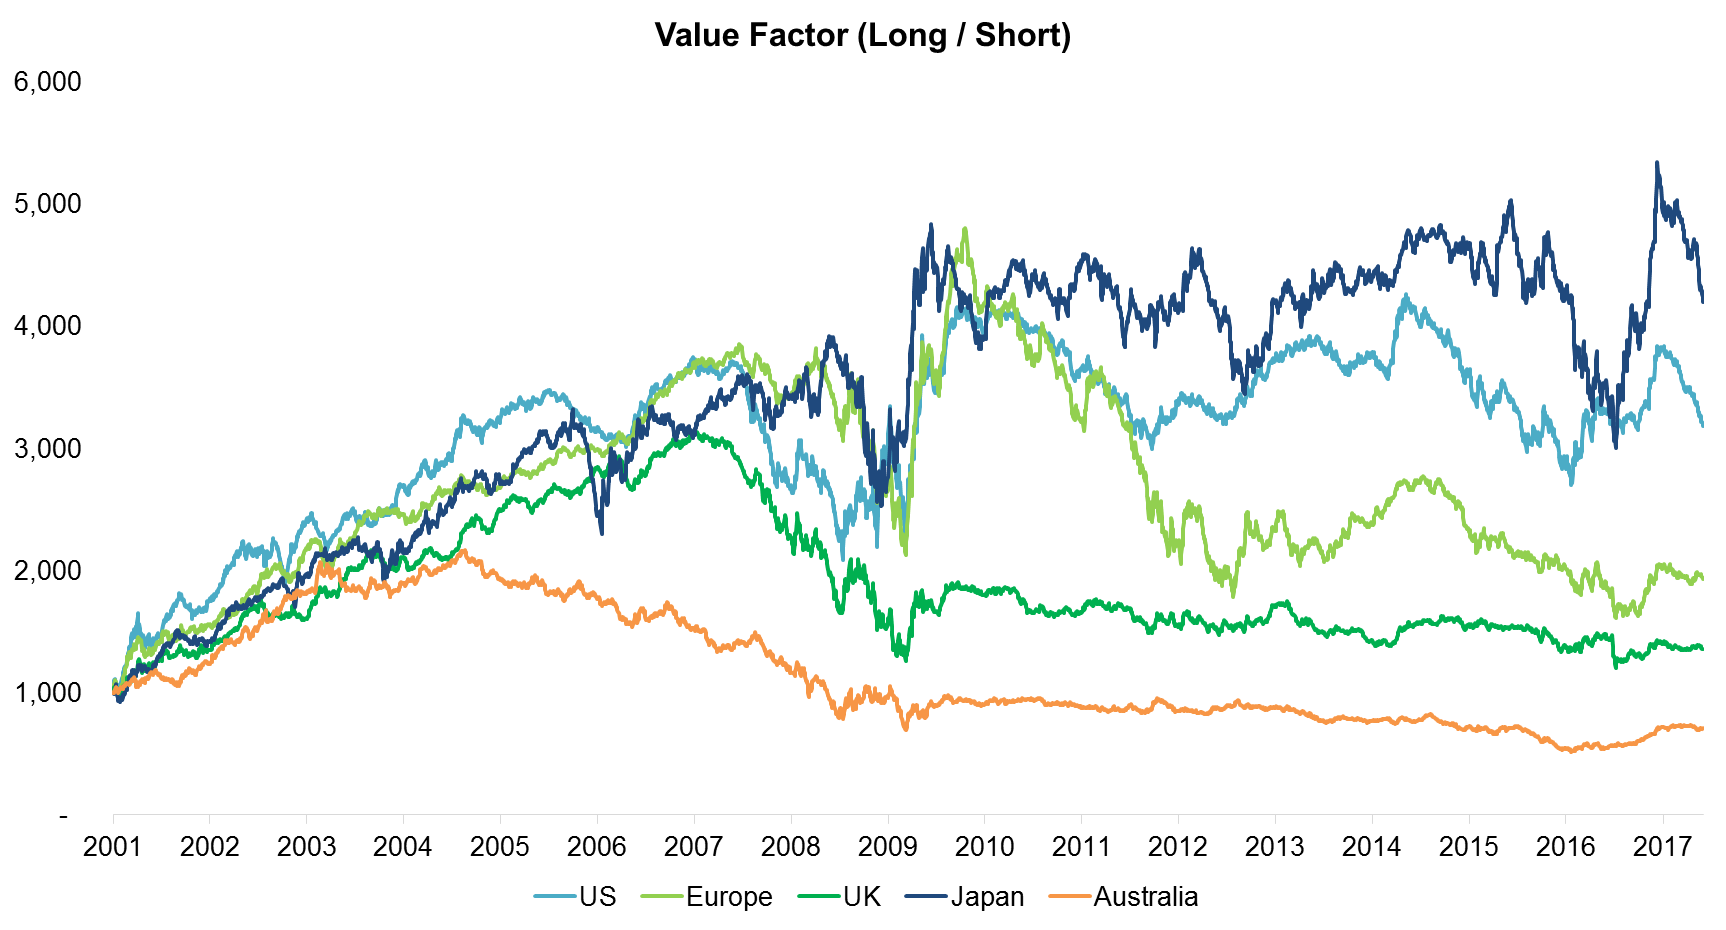
Before we start looking at valuation spreads it makes sense to review the factor performance. The chart below shows the performance of the Value factor for the major developed markets from 2001 to 2017. We can observe a strong performance of Value from 2001 to 2006, however, that is somewhat misleading as Value had a strong negative performance during the Tech bubble around the turn of the century, i.e. we’re only seeing the recovery. From 2007 Value started to deteriorate, reflecting the global financial crisis, and recovered as markets and economies improved thereafter. Since 2010 the performance was flat or declining in most markets.
Source: FactorResearch
Quality can to a degree be regarded as the opposite of Value as investors tend to buy stocks with quality characteristics when fear is high and cheap stocks when greed is high. There is strong academic support that there are structural abnormal returns for Value while there is much less support or empirical evidence for Quality. We do believe that investors should get compensated for holding Value stocks as it’s emotionally quite painful to hold these cheap, but unloved stocks. We struggle to come up with a rationale why investors should get paid for holding high quality stocks as these are companies which tend to have great balance sheets and high profit margins, i.e. everyone wants to own these.
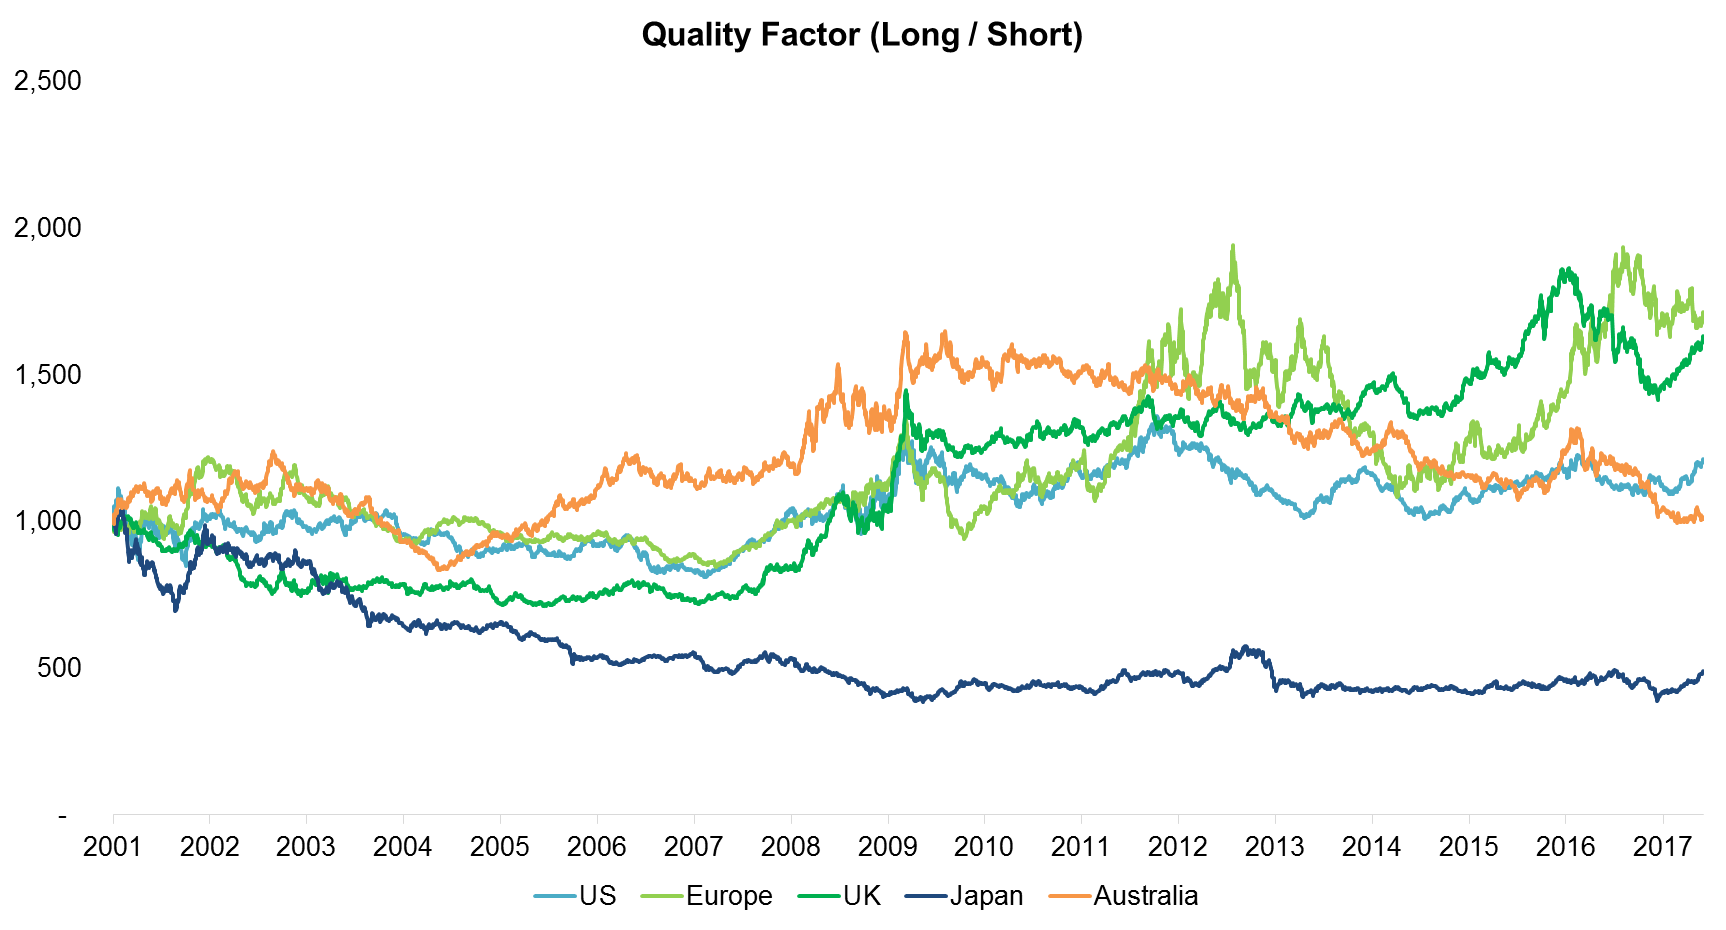
The chart below shows the performance of the Quality factor across developed markets. We can observe negative performance from 2001 to 2006, which might be related the Tech bubble implosion as most Tech companies had little debt, i.e. they would feature high in the long portfolio of the Quality factor. During the global financial crisis Quality did unsurprisingly well in most markets and continued to do well in some markets, e.g. Europe, where the political and economic risks remained high. It’s worth highlighting that Quality did consistently generate negative returns in Japan, perhaps as debt-to-equity metrics become meaningless in a country that has had zero interest rates for decades.
Source: FactorResearch
VALUATION SPREADS
One approach to factor valuation is to calculate the current spread between the long and short portfolios on a multiple basis and then compare that to the spread history. We windsorize multiples at 5% to reduce the impact of outliers.
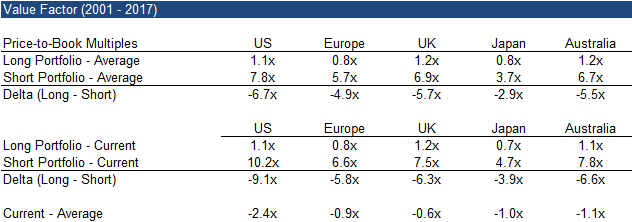
The table below shows the average and current valuation spreads of the Value factor using the price-to-book multiple. We can see that in most markets the current spread between the long and the short portfolios is more extreme than their historical averages, especially in the US, where the current spread is -9.1x compared to -6.7x for the period 2001 to 2017. Investors might argue that the Value factor is currently cheap as expensive stocks in the short portfolio are much more highly valued compared to the cheap stocks in the long portfolio than they used to.
Source: FactorResearch
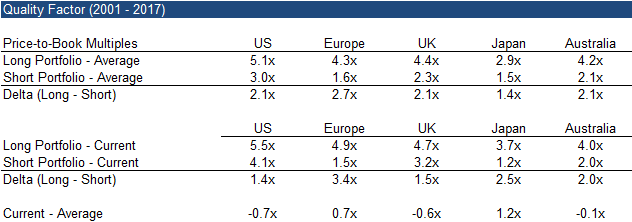
When analysing the current spreads of the Quality factor we can observe that these are more dispersed around the historical averages, indicating that in some markets the factor may be considered cheap while expensive in others. The most extreme case is Japan, where we can observe a significant difference between the current spread (2.5x) and the historical average (1.4x), which implies that stocks with great balance sheets and high profit margins are trading much more expensive compared to lower quality companies than they used to. Oddly, Quality as a factor has generated negative performance in Japan in recent years.
Source: FactorResearch
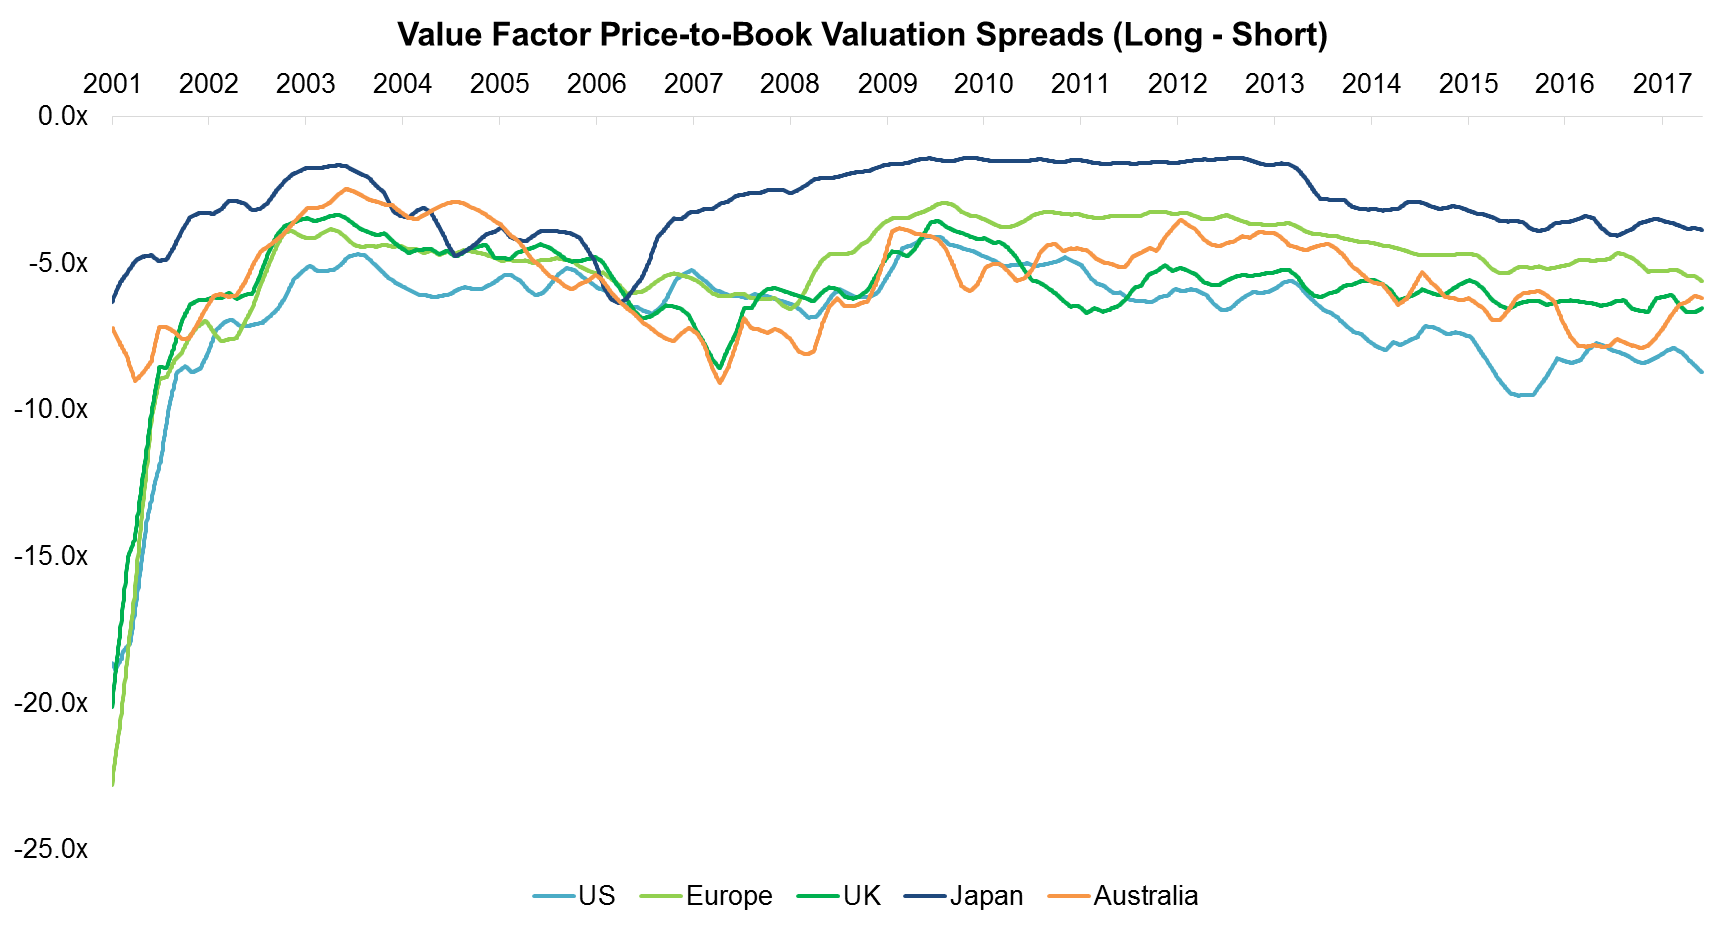
We can also analyse the valuation spreads over time. The chart below shows how the spreads for the Value factor have evolved since 2001. The spreads at the beginning of the analysis were quite extreme, indicating that the factor was cheap, as at that point Tech stocks were trading at obscenely high multiples and therefore made up a significant part of the short portfolio. As the Tech bubble imploded, valuations of Tech stocks decreased, compressing the spread and leading to strong factor performance.
Source: FactorResearch
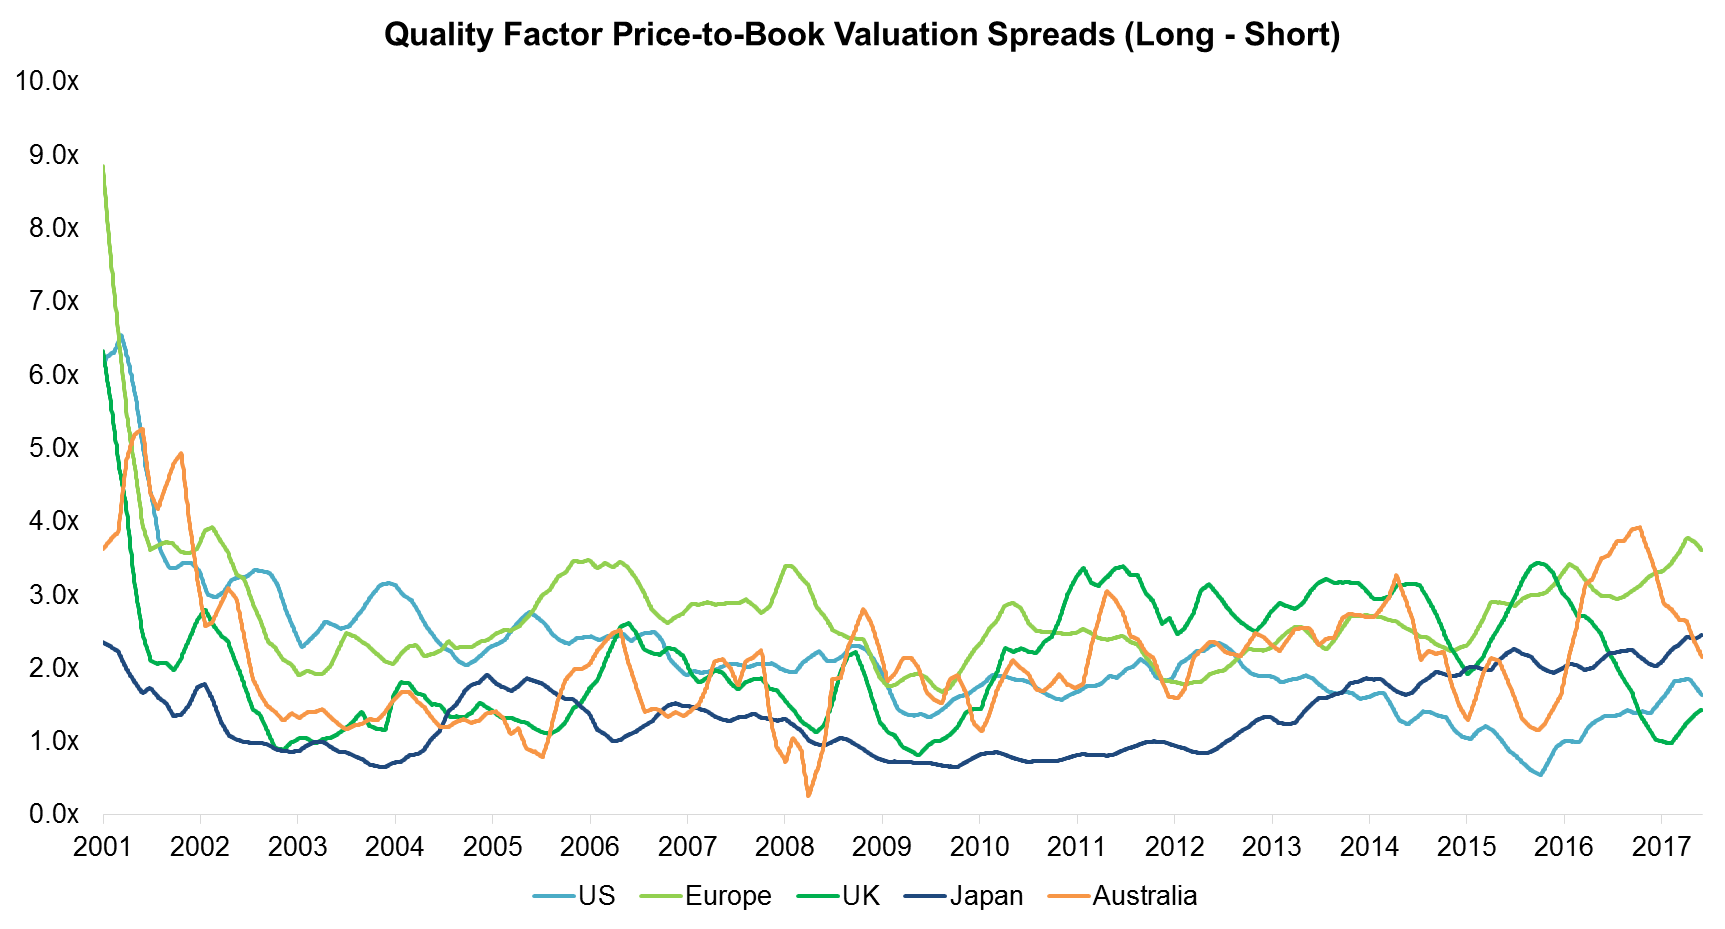
The chart below shows the spreads over time for the Quality factor. The early years look like a mirror image of the Value chart, which can be explained that Tech stocks dominated the long portfolios of Quality due to low debt-to-equity ratios. However, in this case large positive spreads indicate that the factor can be considered expensive as it means the long portfolio is much higher valued on a PB multiple basis than the short portfolio.
Source: FactorResearch
FURTHER THOUGHTS
This short note provides an indication of current factor valuation spreads compared to historical spreads, but the observation period of 15 years is relatively short for the spread history and we should extend this for it to be more meaningful. One limitation is that some stock universes, e.g. Australia, had much fewer stocks before 2001.
As a next step it would be interesting to validate if indeed large negative spreads lead to positive future performance for Value and large positive spreads to negative future performance for Quality.
ABOUT THE AUTHOR
Nicolas Rabener is the CEO & Founder of Finominal, which empowers professional investors with data, technology, and research insights to improve their investment outcomes. Previously he created Jackdaw Capital, an award-winning quantitative hedge fund. Before that Nicolas worked at GIC and Citigroup in London and New York. Nicolas holds a Master of Finance from HHL Leipzig Graduate School of Management, is a CAIA charter holder, and enjoys endurance sports (Ironman & 100km Ultramarathon).
Connect with me on LinkedIn or X.

