Value vs Quality: More Correlated than Ever? II
P/E ratio of 100x vs -100x, which is more expensive?
March 2024. Reading Time: 10 Minutes. Author: Nicolas Rabener.
SUMMARY
- P/E and ROE factors were highly correlated in recent years
- However, this is counterintuitive as cheap stocks should not be highly profitable
- We can explain this perplexity with stocks with negative earnings
INTRODUCTION
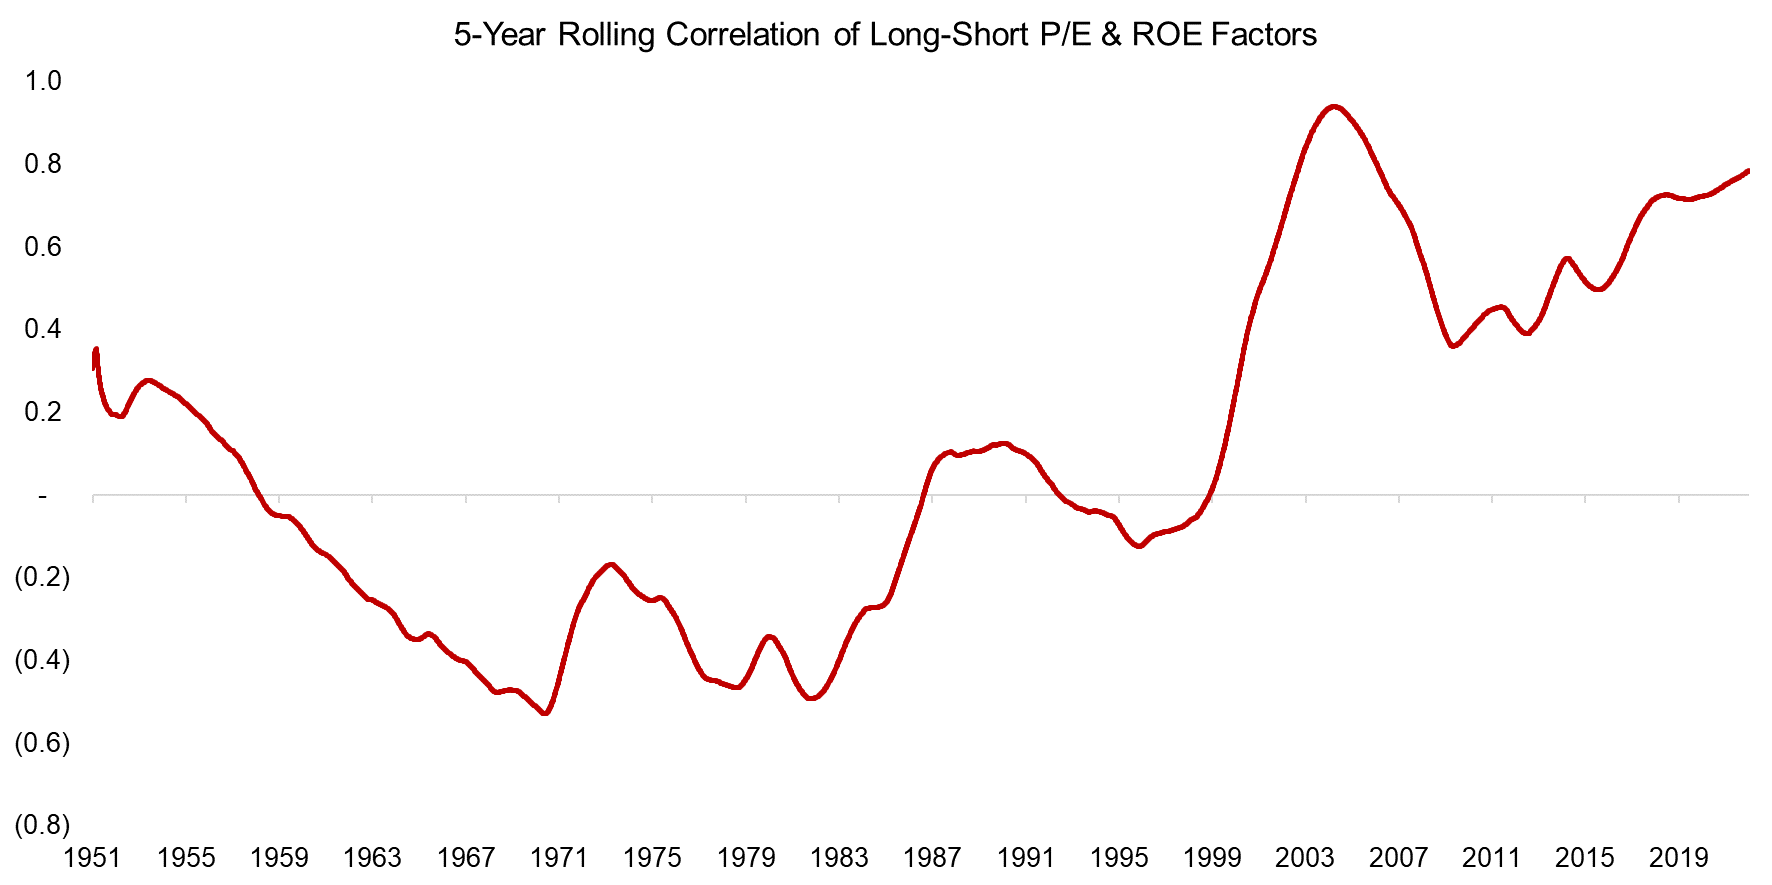
In our recent article “Value vs Quality: More Correlated than Ever?” we highlighted that the correlations of the long-short P/E and return-on-equity (ROE) factors have changed from negative between 1951 and 1991 to positive thereafter. Intuitively, it does not make sense as cheap stocks tend to feature low profitability, and expensive ones usually have high profitability.
We used data from two different providers, namely Jensen, Kelly, and Pedersen and Finominal, so are confident that this change in relationship is valid. The 5-year rolling correlation has been trending upward since the global financial crisis in 2009 and is close to reaching its all-time high of 0.9.
Source: Global Factor Data, Finominal
However, we were not able to explain this change in relationship, which we attempt to do in this article.
STOCK CHARACTERISTICS
Factors represent long-short portfolios of stocks that often make it difficult to explain their risk and return drivers given that these might originate in the long, short, or both sub-portfolios.
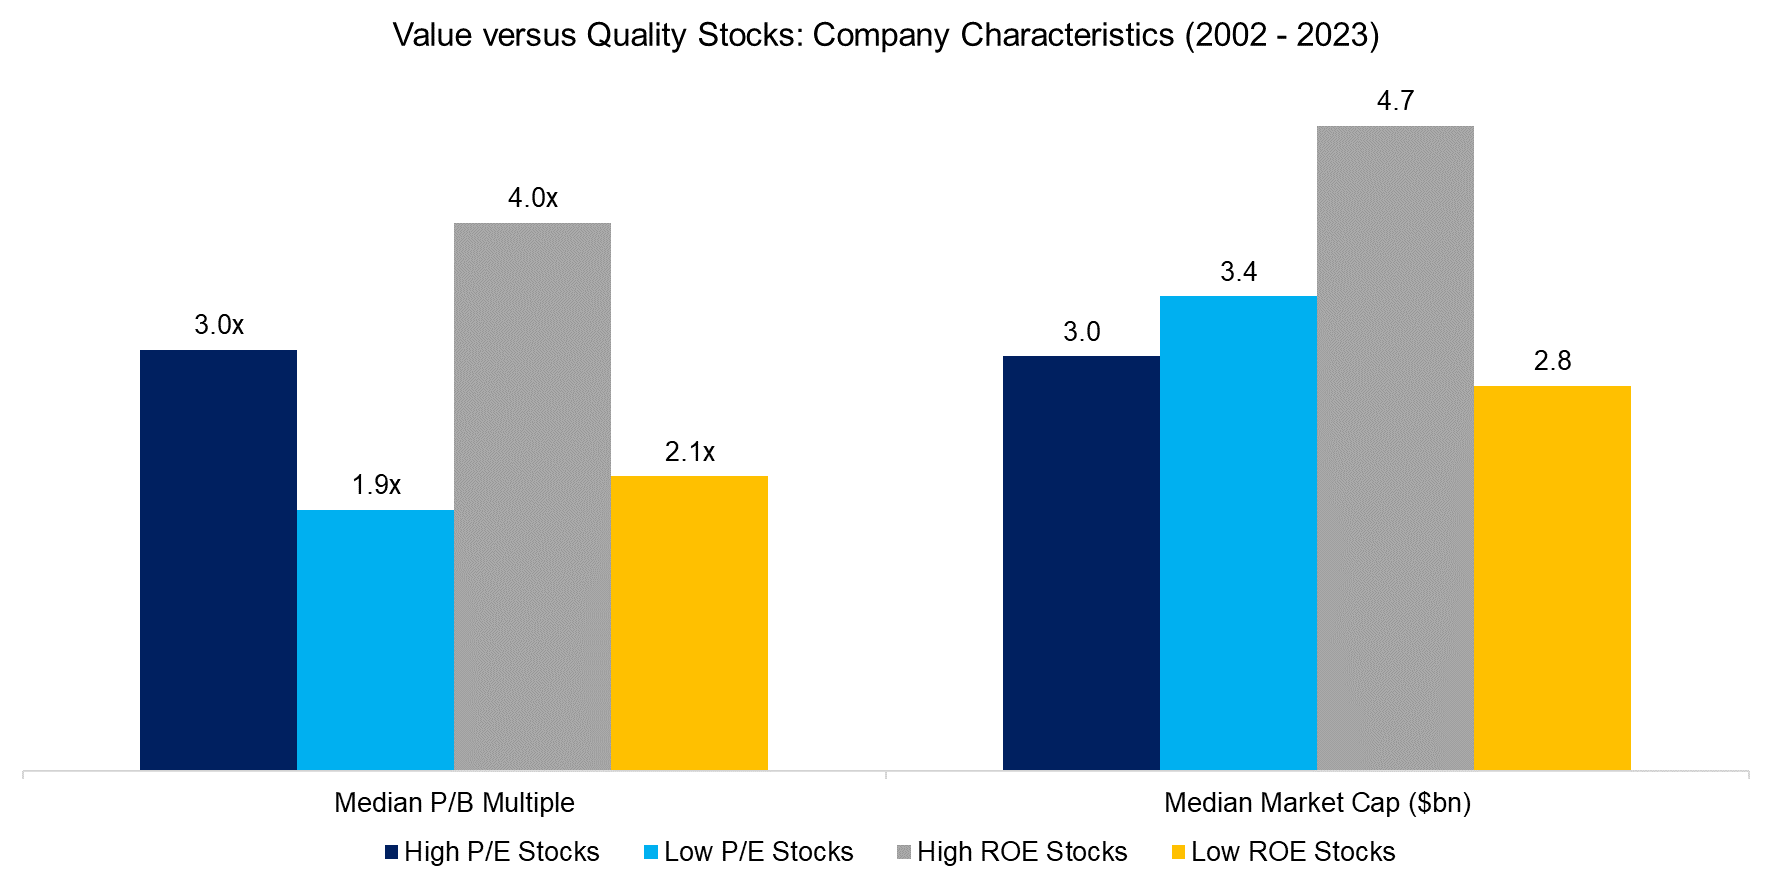
Given this, we create four long-only portfolios by selecting the top and bottom 30% of the universe of U.S. stocks with a market capitalization larger than $1 billion based on the trailing 12-month P/E multiples and ROE ratios. The portfolios are rebalanced monthly with 10bps transaction costs and stocks are weighted equally.
First, we analyze the company characteristics of these four portfolios, which highlights that stocks with high ROEs trade at the highest P/B multiples, followed by stocks with high P/E multiples, low ROEs, and low P/E multiples, as expected. We also observe that the most profitable stocks feature the largest market capitalizations, while there is not much differentiation for the other three portfolios.
Source: Finominal
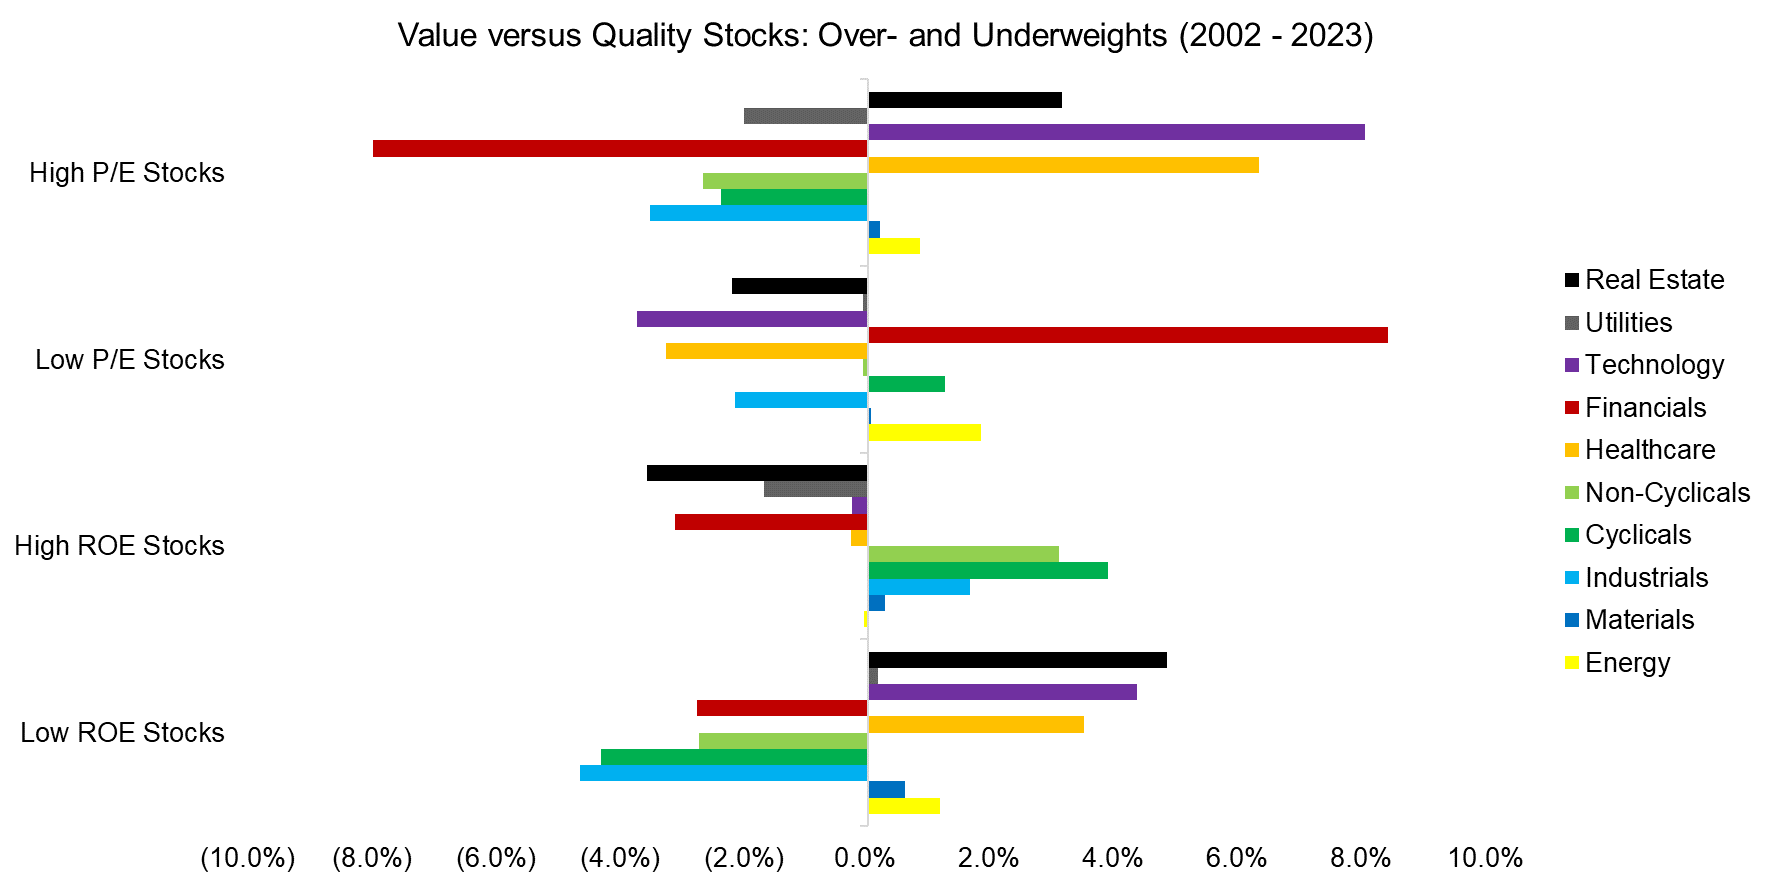
Next, we analyze the over- and underweights in sectors compared to an equal-weighted benchmark for the U.S. stock market. Some observations:
- High P/E stocks: Overweight in technology, underweight in financials
- Low P/E stocks: Overweight in financials, underweight in technology
- High ROE stocks: Overweight in cyclicals, underweight in real estate
- Low ROE stocks: Overweight in real estate, underweight in industrials
Source: Finominal
EXCESS RETURNS OF VALUE & QUALITY STOCKS
The breakdown by sectors highlights that high P/E and low ROE portfolios had a significant overlap in portfolios with overweights in real estate, technology, and healthcare, and underweights in financials, non-cyclicals, and industrials.
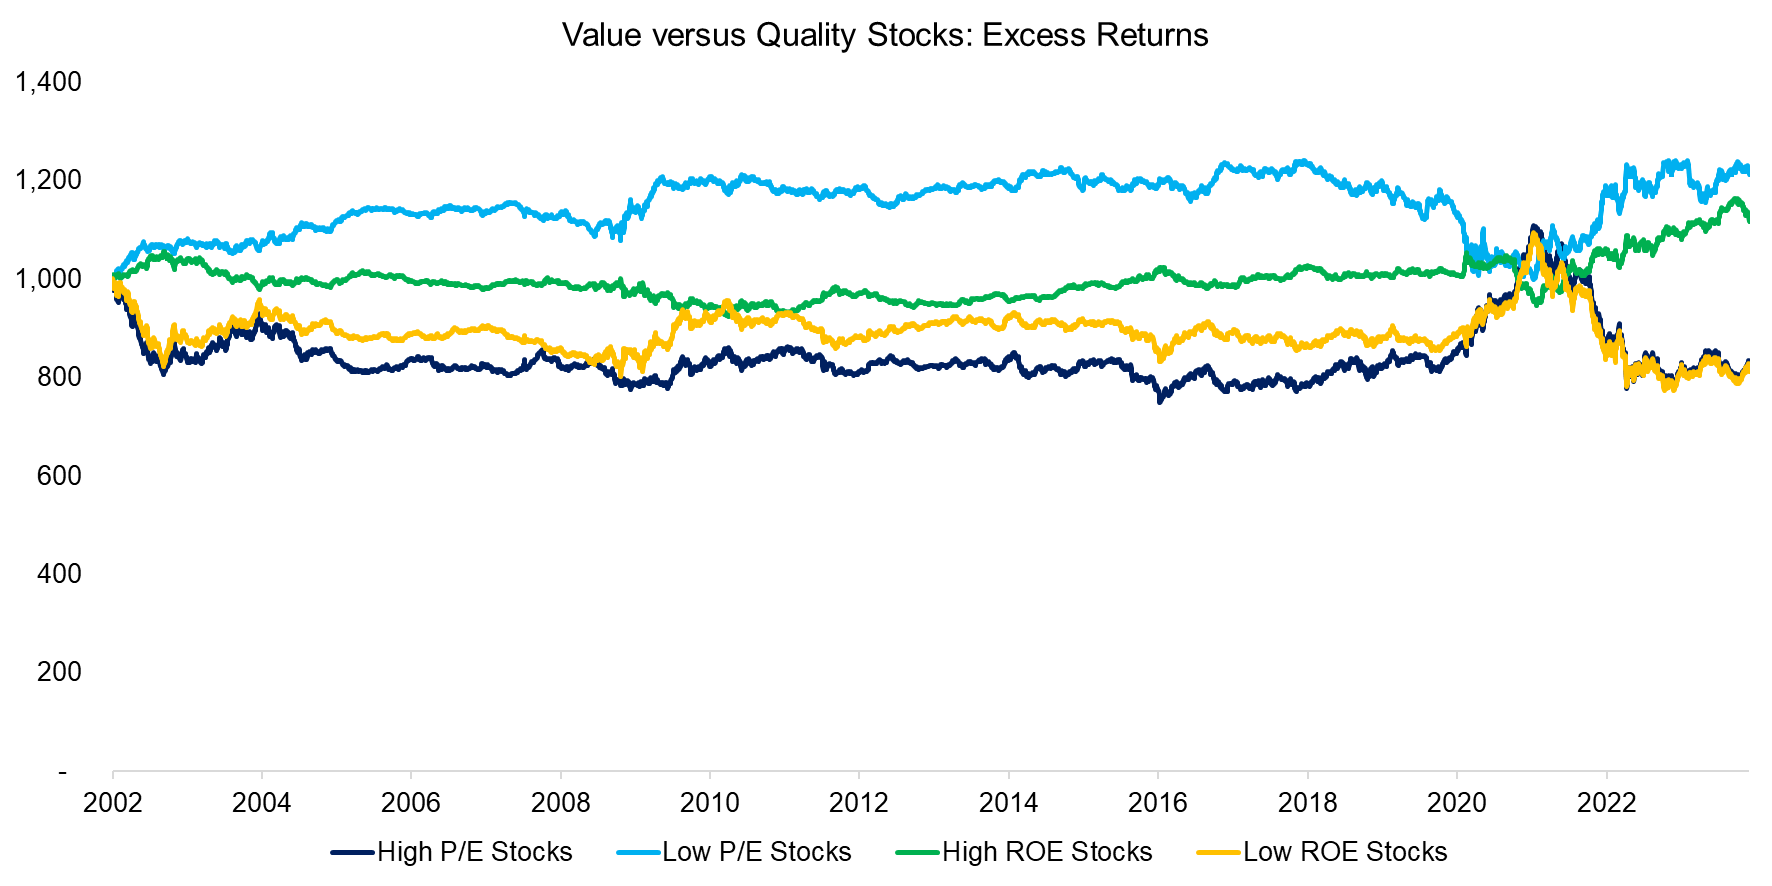
We can demonstrate the similarity of these portfolios by comparing their performance using excess returns versus an equal-weighted benchmark index for the U.S. stock market, which highlights that the performance was almost identical in the period from 2002 to 2023.
In contrast, the excess returns of low P/E and high ROE stocks were markedly different and these shared fewer common trends (read Oh, Quality, Where Art Thou?).
Source: Finominal
CORRELATION ANALYSIS
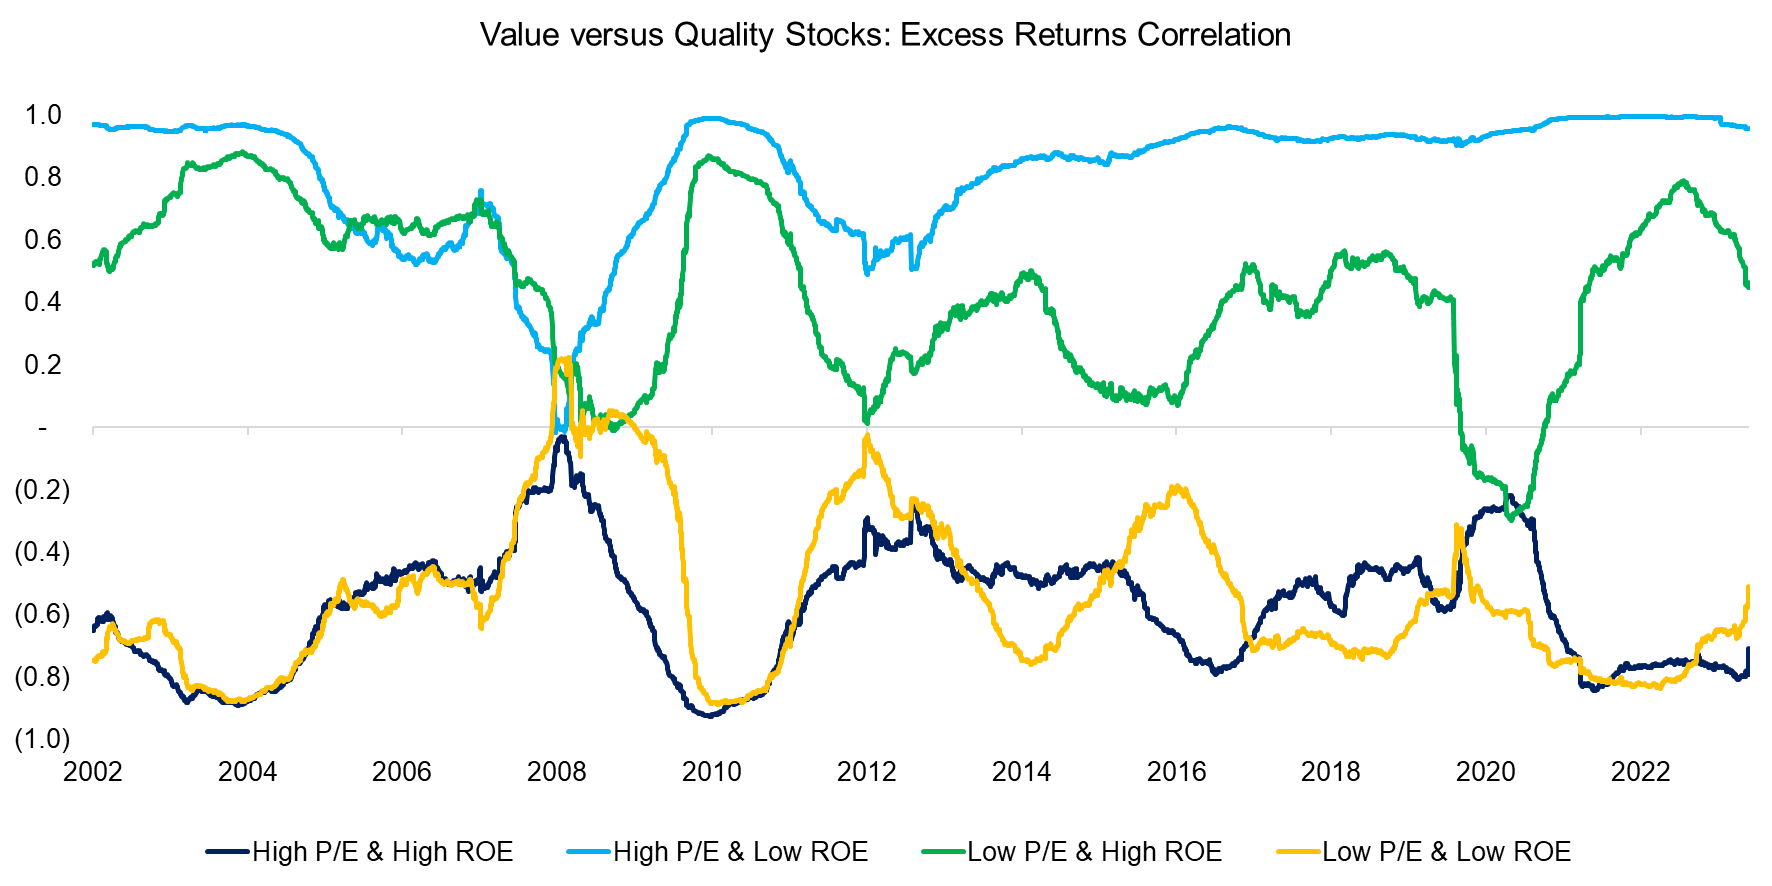
We calculate the rolling 12-month correlations of the excess returns over the last 20 years, where we can make the following observations:
- High P/E and high ROE stocks: these were negatively correlated, but should be positively correlated as investors should pay high multiples for high profitability
- High P/E and low ROE stocks: these were positively correlated, which is also counterintuitive as investors should pay low multiples for low profitability
- Low P/E and high ROE stocks: these were positively correlated, but why would high ROE stocks trade at low valuations?
- Low P/E and low ROE stocks: these were negatively correlated, but should be positively correlated
Source: Finominal
BACKTESTING INTRICACIES
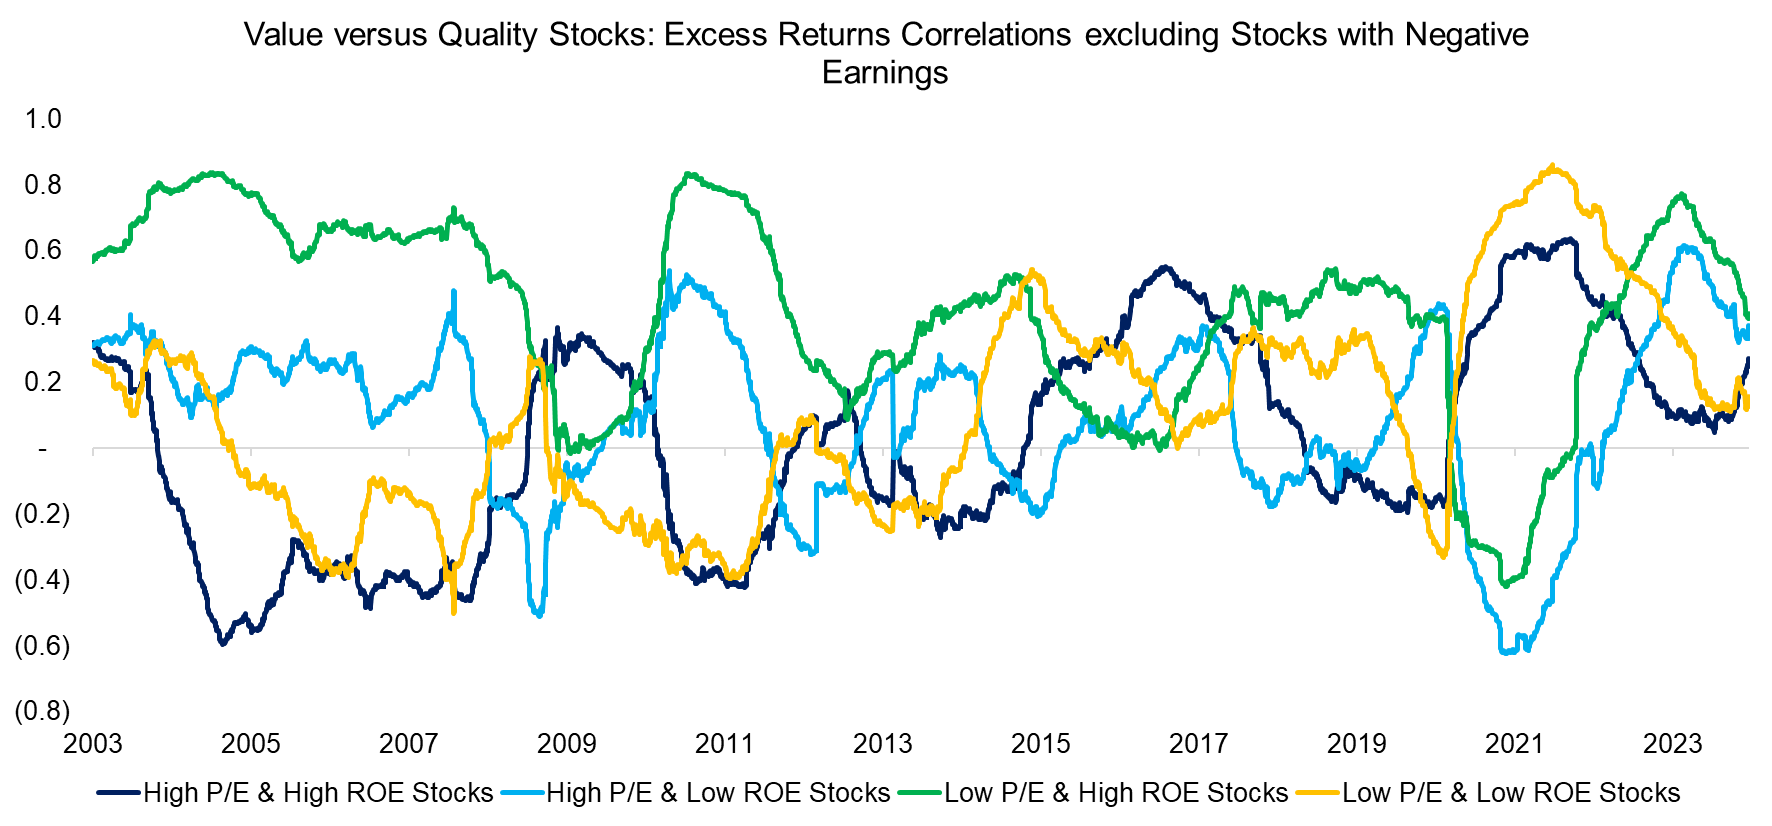
One of the intricacies of backtesting strategies is how to deal with negative values in fundamental data, eg is a $1 billion market cap-stock more expensive if it has earnings of $10m or -$10m, ie a P/E ratio of 100x or -100x? Many financial researchers exclude companies with negative earnings as that makes backtesting easier, however, this is not particularly correct as many stocks feature negative earnings for years.
It seems that precisely these stocks are responsible for the unusual correlation between value and quality portfolios. If we exclude stocks with negative earnings, then the correlations of the four portfolios become less correlated.
Source: Finominal
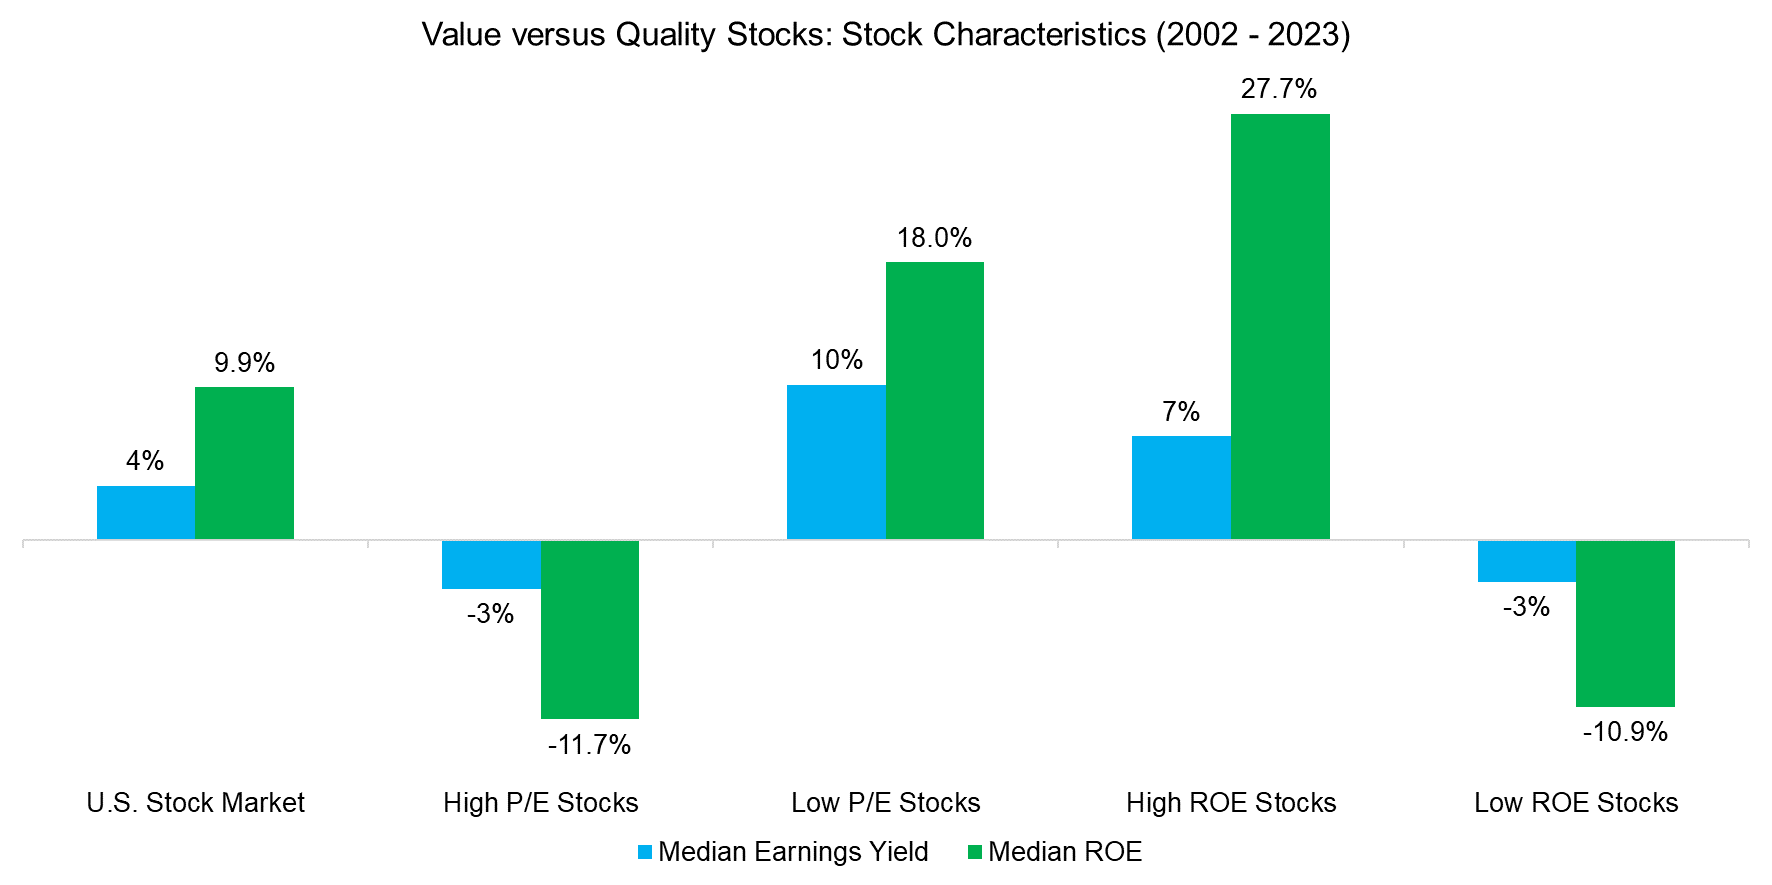
It is easier to think about earnings yields than P/E ratios as these are not linear. If we consider the stocks that have the most negative earnings yields (highest P/E ratios), ie are loss-making stocks, then these feature low ROEs on average. Similarly, the stocks with the most negative ROEs, which again implies loss-making stocks, also feature negative earnings yields (high P/E ratios).
In contrast, stocks with high earnings yields (low P/E stocks) have above-average ROEs, and stocks with the highest ROEs, also feature high earnings yields (low P/E stocks).
Source: Finominal
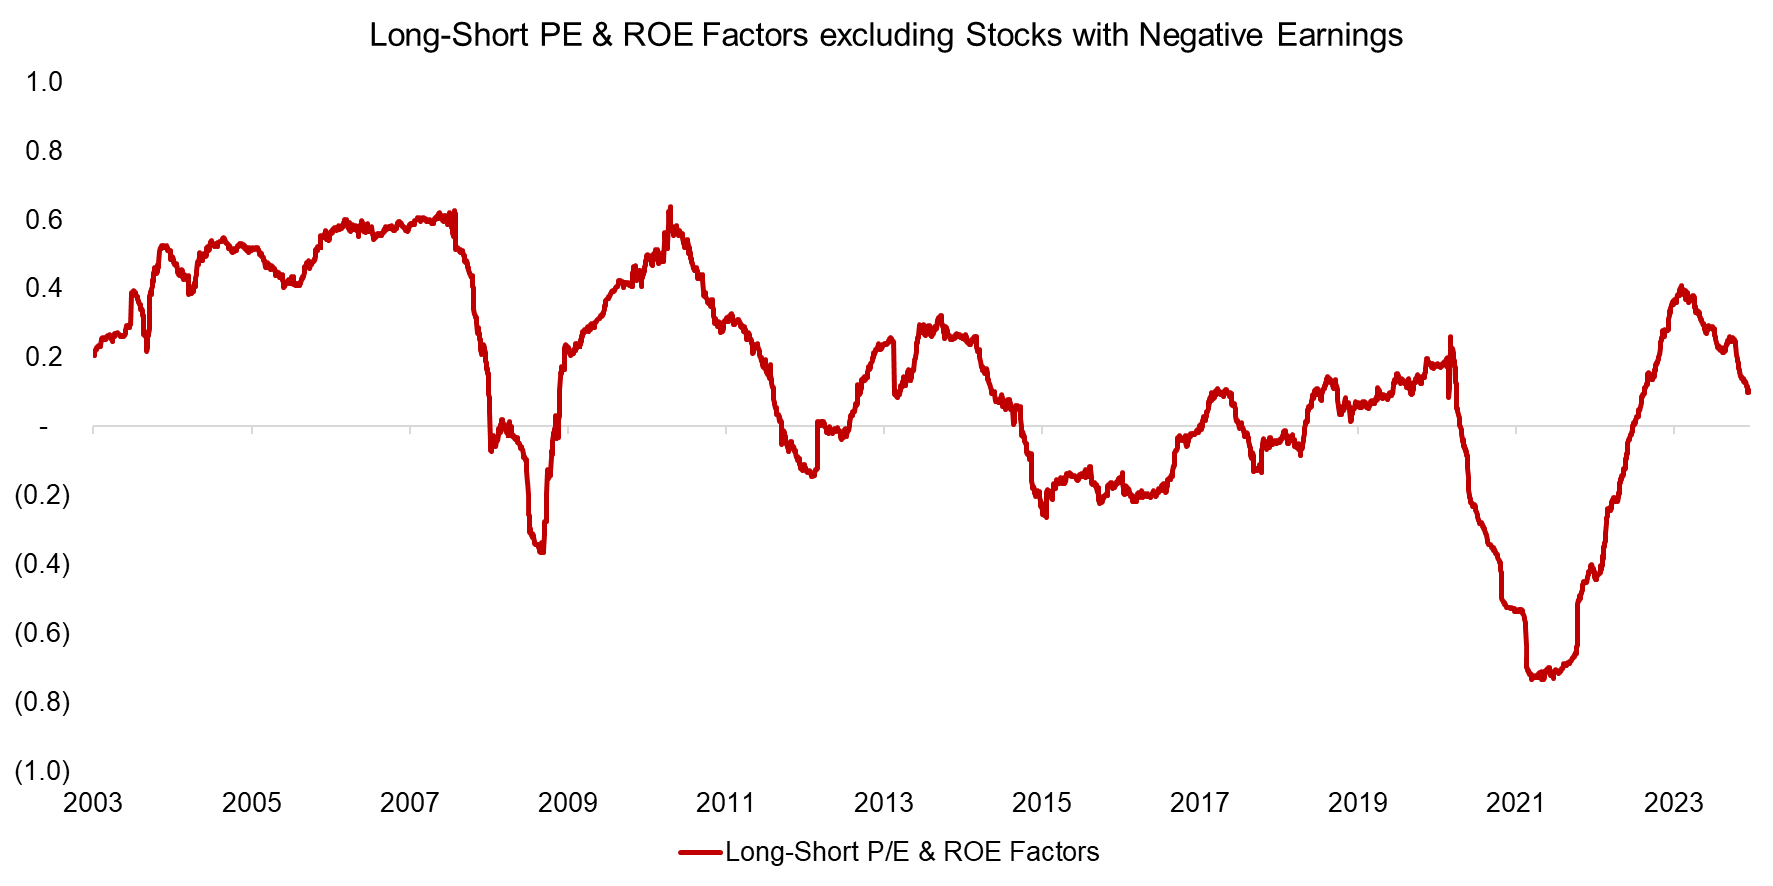
Finally, we can recalculate the correlation of the long-short P/E and ROE factors excluding stocks with negative earnings, which decreases to 0.1 on average in the period between 2003 and 2023. Naturally, that does not make the high correlation between these two factors including stocks with negative earnings wrong.
Source: Finominal
FURTHER THOUGHTS
Relationships in finance and economics are often not particularly intuitive, but that does not make them wrong, just difficult to explain. Unfortunately, this makes investing complicated and risky as simple measures like correlations can be misleading or misunderstood. Investing is far more gray than black and white.
RELATED RESEARCH
Oh, Quality, Where Art Thou?
Picking Profitable Companies Can Be Unprofitable
Quality Factor: Zero Alpha for Most Investors
Value & Quality Factor Valuations
Beta in Beta-Neutral Factors?
REFERENCED DATA
ABOUT THE AUTHOR
Nicolas Rabener is the CEO & Founder of Finominal, which empowers professional investors with data, technology, and research insights to improve their investment outcomes. Previously he created Jackdaw Capital, an award-winning quantitative hedge fund. Before that Nicolas worked at GIC and Citigroup in London and New York. Nicolas holds a Master of Finance from HHL Leipzig Graduate School of Management, is a CAIA charter holder, and enjoys endurance sports (Ironman & 100km Ultramarathon).
Connect with me on LinkedIn or X.

