Venture Capital: Worth Venturing Into?
Replicating Venture Capital Returns
February 2020. Reading Time: 10 Minutes. Author: Nicolas Rabener.
SUMMARY
- Venture capital returns are likely to be overstated
- Top-performing VC funds generated attractive returns, but are difficult to access
- Average venture capital returns can be replicated efficiently with public equities
WINNERS & LOSERS
The further the global financial crisis retreats into history, the clearer the winners and losers become. Insurance companies, banks, pension funds, savers, and renters have all suffered from the subsequent central bank policies that pushed interest rates to all-time lows.
In contrast and in an ironic twist, investors in such leveraged asset classes as real estate and private equity have benefitted from the low interest rate environment. But the biggest winner of all is probably venture capital (VC). Why? Because in a low-growth environment, growth is almost priceless.
The VC industry had an eventful 2019. Valuable start-ups like Uber and Lyft went public, but cracks started to appear in the bullish outlook and valuations of high-growth firms. This shift in investor sentiment became clear as the real estate start-up WeWork readied for its initial public offering (IPO) in August: The deal collapsed and the start-up’s valuation plunged from $47 billion to about $10 billion in a matter of weeks.
For a venture capitalist, an IPO is the ultimate achievement, the equivalent of a father walking his daughter down the aisle. No longer a start-up, the company is now mature and ready to pursue its own path with a new partner. But public capital tends to be quite different from private capital. Which can make for a bad marriage.
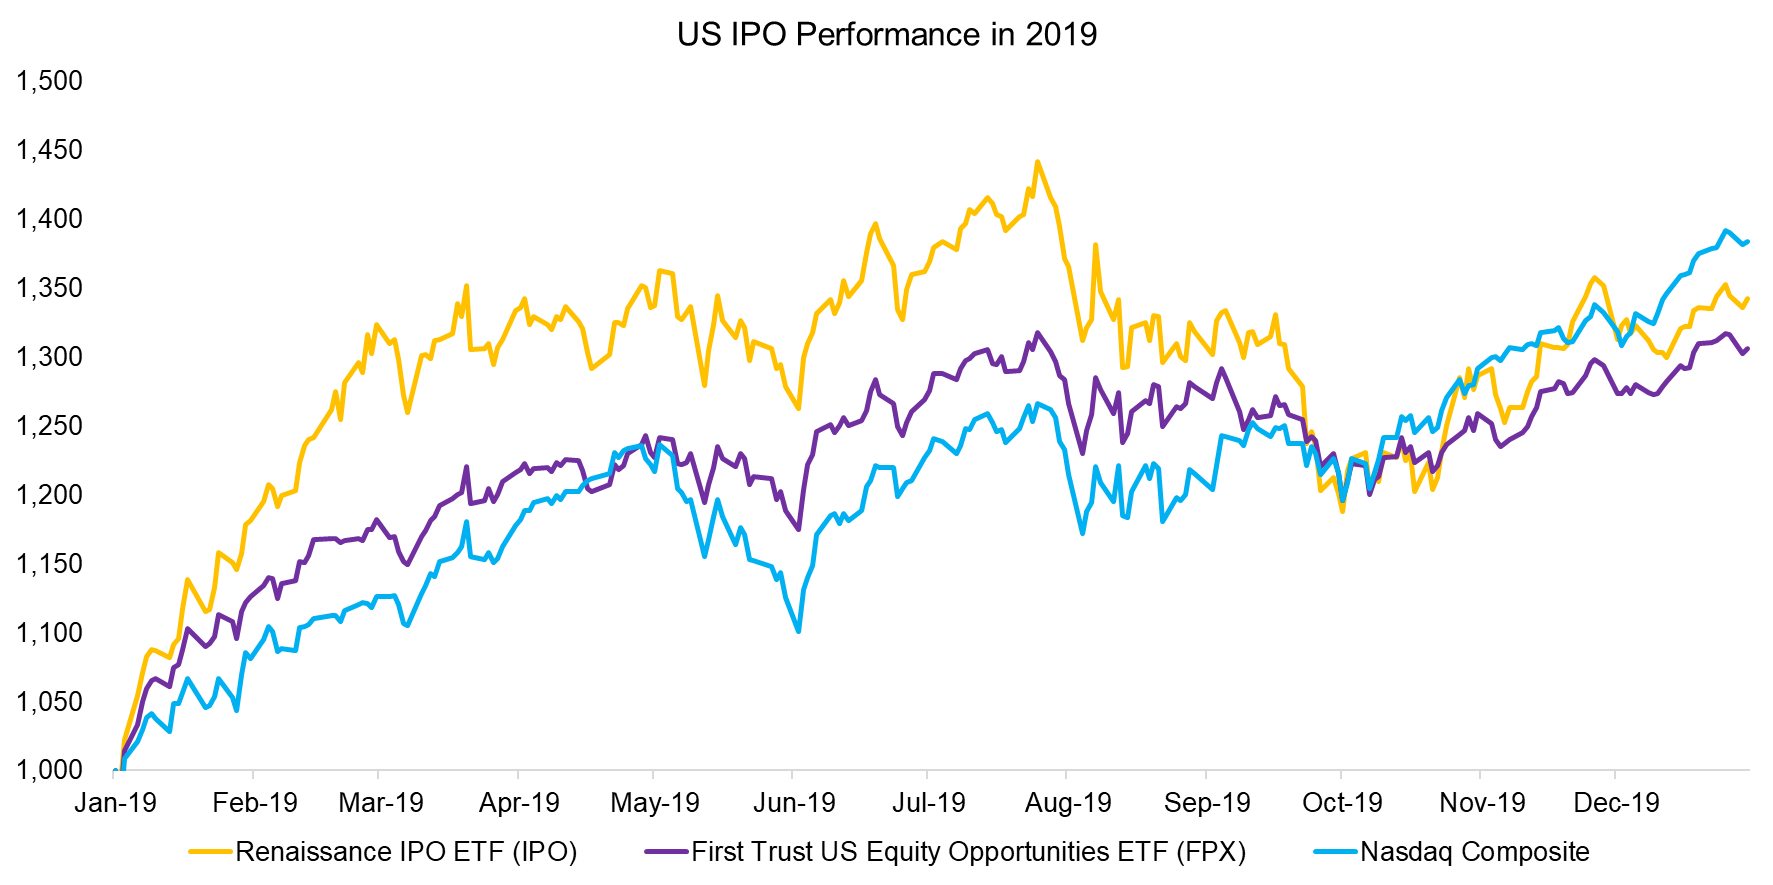
Last year, as measured by two exchange-traded funds (ETFs) that provide access to recently listed firms, IPOs at first outperformed the NASDAQ Composite. But from September onward, they underperformed – a reversal of fortune that coincided with the WeWork implosion.
Source: FactorResearch.
To those contemplating an allocation to venture capital, it may look like the golden years have already passed. Some will point to the fallout from the tech bubble in 2000, when many investments were written down to zero.
So just what do venture capital fund returns look like and what are some alternative ways to allocate to the asset class? (read Private Equity: The Emperor has No Clothes)
VENTURE CAPITAL VS PUBLIC MARKET RETURNS
Like their counterparts in private equity and real estate, VC returns tend to be measured by their internal rate of return (IRR) and are not directly comparable to the time-weighted returns of capital markets. But most investors make asset allocation decisions based on these heterogeneous data sets because there are no better alternatives, so we will follow this approach despite its limitations.
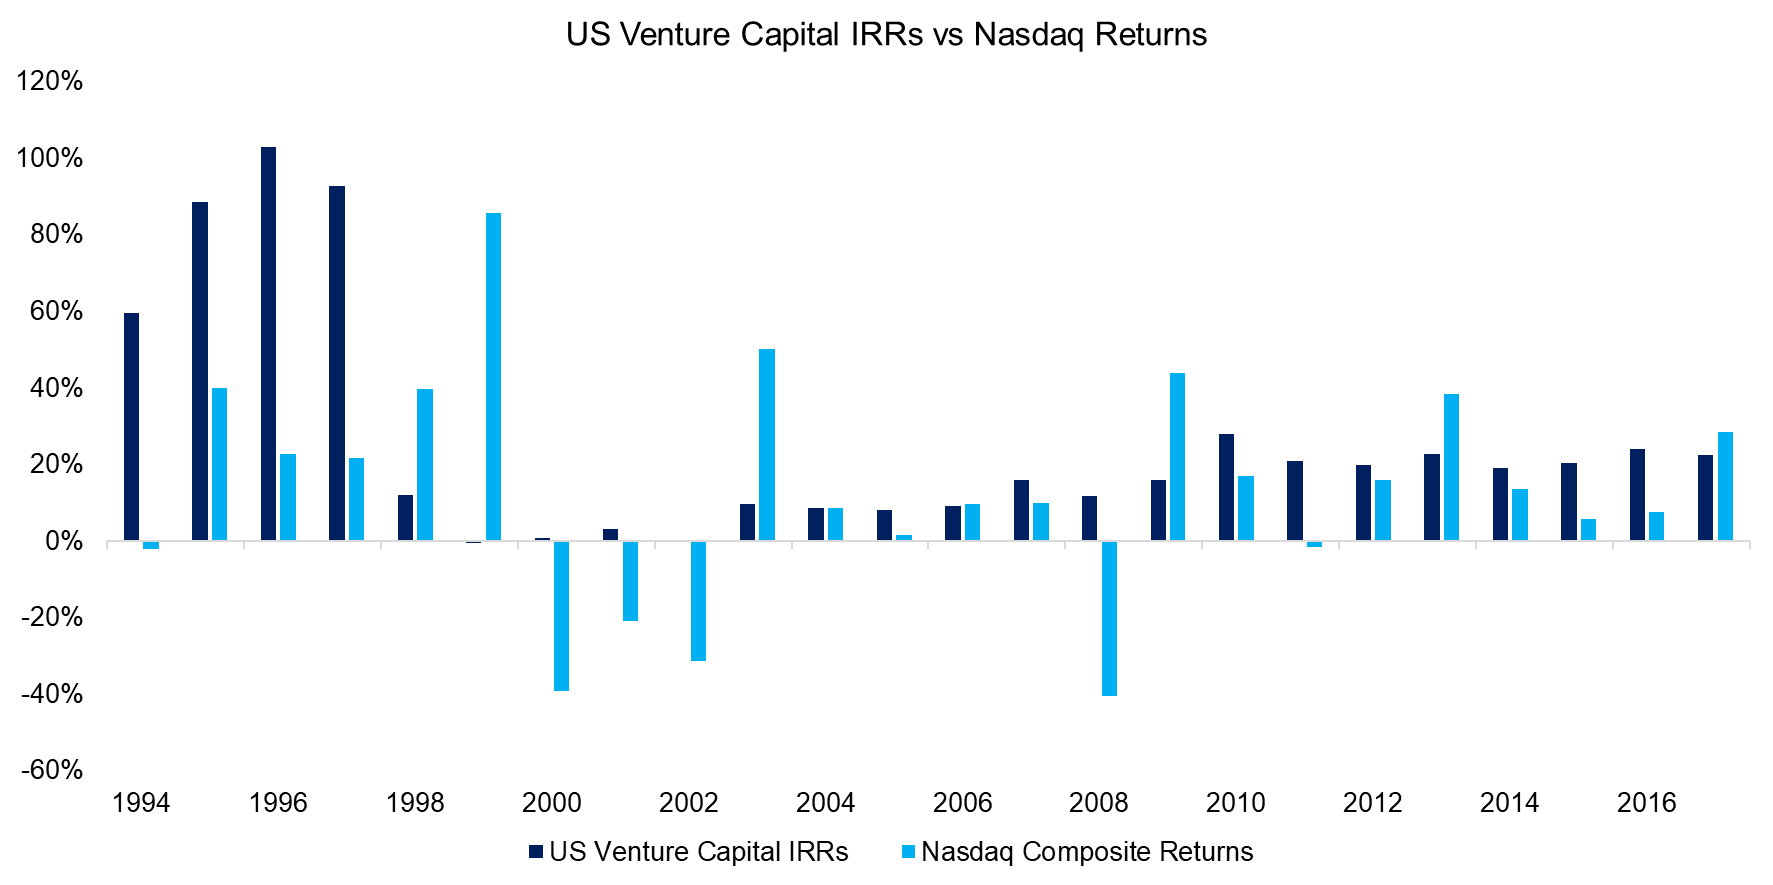
We compare annual IRRs for the US venture capital industry with returns from the NASDAQ Composite, which we believe is the best benchmark given its focus on high-growth companies. Data is sourced from the investment consultancy Cambridge Associates.
On first glance, returns of venture capital funds and public markets seem uncorrelated, implying diversification benefits. The returns were much more extreme during the 1990s tech bubble leading up to 2000 than in recent years, which might give some comfort to investors contemplating an allocation to VC today. Naturally, returns do not state anything about start-up valuations, which have risen over the last decade.
But there’s reason to doubt the accuracy of annual VC returns. VC firms invest almost exclusively in the equity of emerging companies, and that makes for a portfolio comparable to an index like the NASDAQ Composite. Investors might wonder, then, how between 2000 and 2002, when the NASDAQ fell 78%, annual venture capital IRRs were positive on average. Publicly listed start-ups like Pets.com filed for bankruptcy and even the firms that survived – Amazon and eBay, among them – saw their stock prices collapse. Privately held start-ups didn’t fare much better. The logical conclusion? Annual VC returns are overstated due to reporting biases and should not be trusted.
Source: Cambridge Associates, FactorResearch.
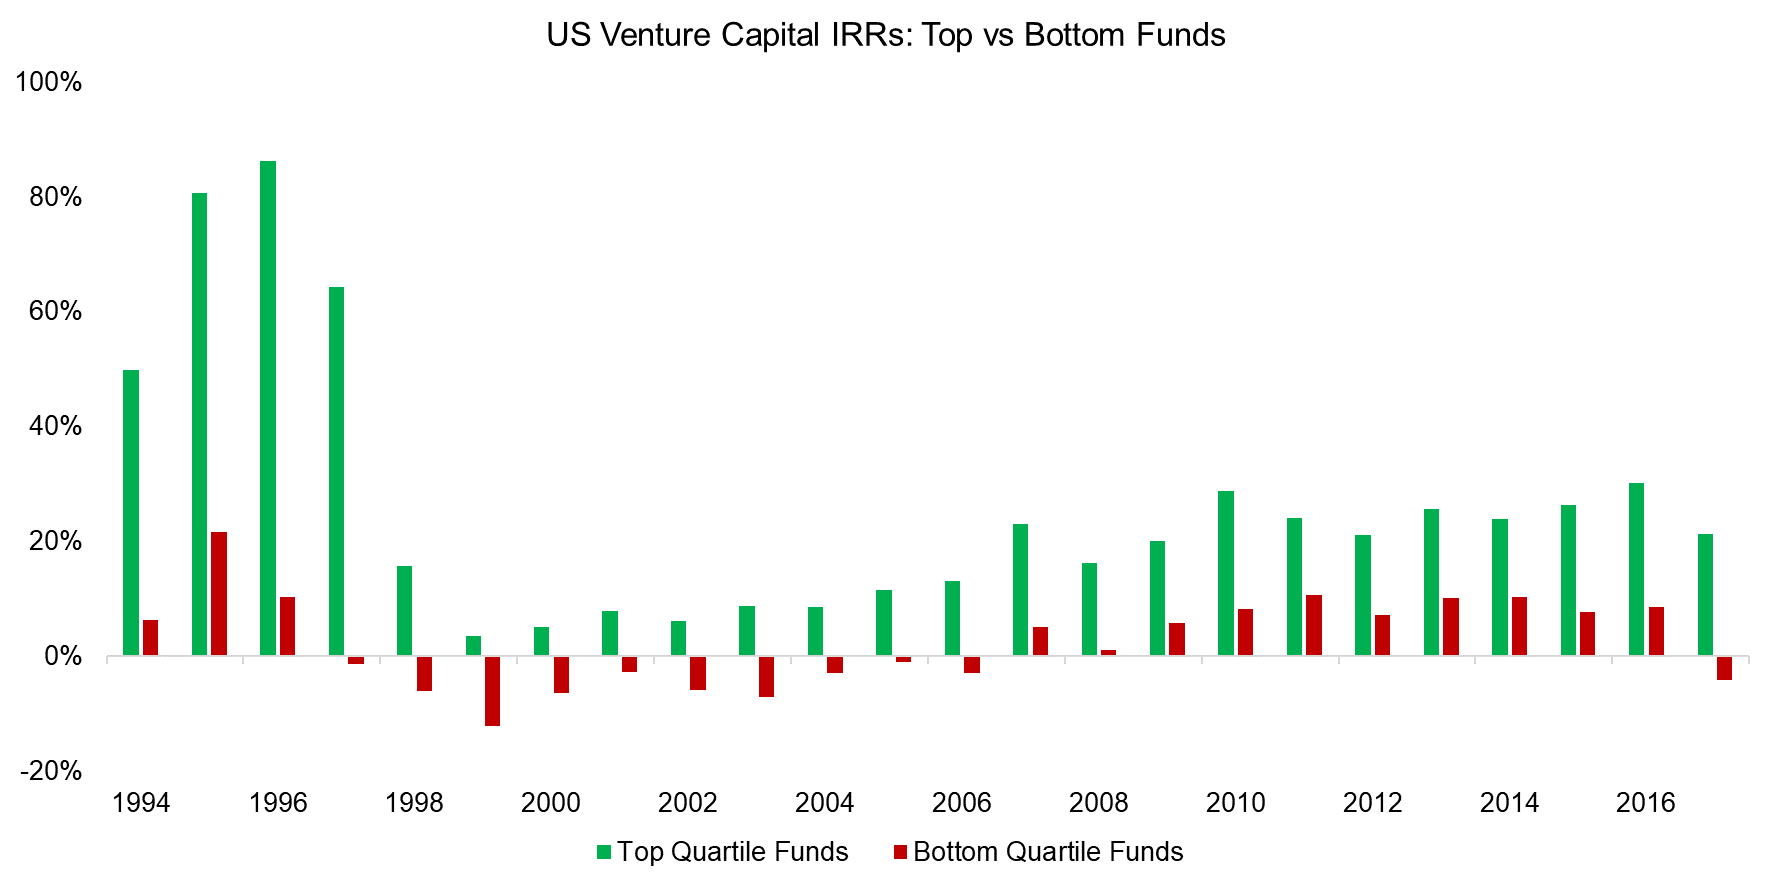
Since VC fund investors are required to lock up capital for years and the funds themselves are risky, return expectations should be on the high side. A common refrain in the industry is that returns show elevated levels of dispersion and only the leading funds are worth investing in. Comparing the returns of the top and bottom quartile VC funds in the United States demonstrates this heterogeneous performance.
Return dispersion is common across asset classes, but must be persistent to be meaningful for investors. Mutual fund returns exhibit little persistence, so buying the best performing funds is not sound investing. In fact, according to our research, underperforming mutual funds generated better subsequent returns than outperforming funds.
However, research from Steven N. Kaplan and Antoinette Schoar demonstrates that venture capital returns were persistent from 1980 to 1997. The most likely explanation for this? Proprietary deal flow. The more prestigious the VC firm, the better the deal flow. Well-known venture capitalists like Reid Hoffman or Peter Thiel have robust networks that give them unique access to start-ups.
In contrast, mutual fund managers have the same access to stocks, albeit with occasional preferential access to IPOs and marginal differences in execution capabilities.
Michael Ewens and Matthew Rhodes-Kropf confirm the return persistence. But they attribute this phenomenon to the skill of the venture capitalist, not the firm. Which makes allocating to venture capital more complicated: It requires investors to monitor the partnership structures of VC firms. While partners do not leave firms, especially successful ones, all that often, this nevertheless makes due diligence much more complex.
Source: Cambridge Associates, FactorResearch.
REPLICATING VENTURE CAPITAL RETURNS
While we’d all like to invest in the top VC funds, few have access to such opportunities. The total assets under management (AUM) in the VC sector is only $850 billion, according to Preqin, and in contrast to those in other asset classes, VC firms often limit the amount of capital they are raising. In the VC world, bigger isn’t necessarily better. There are few opportunities for large investments. Softbank’s $100 billion fund suggests this may be changing, but the jury is definitely still out on that.
Since access to the top VC funds is so limited, might there be alternative ways to replicate average VC returns without long capital lock-up periods or high management fees? (read Replicating Famous Hedge Funds)
Theoretically, we could look for stocks with start-up characteristics: small market capitalization, high sales growth, high R&D expenses, negative earnings, etc. Or we could wait and simply invest in the NASDAQ.
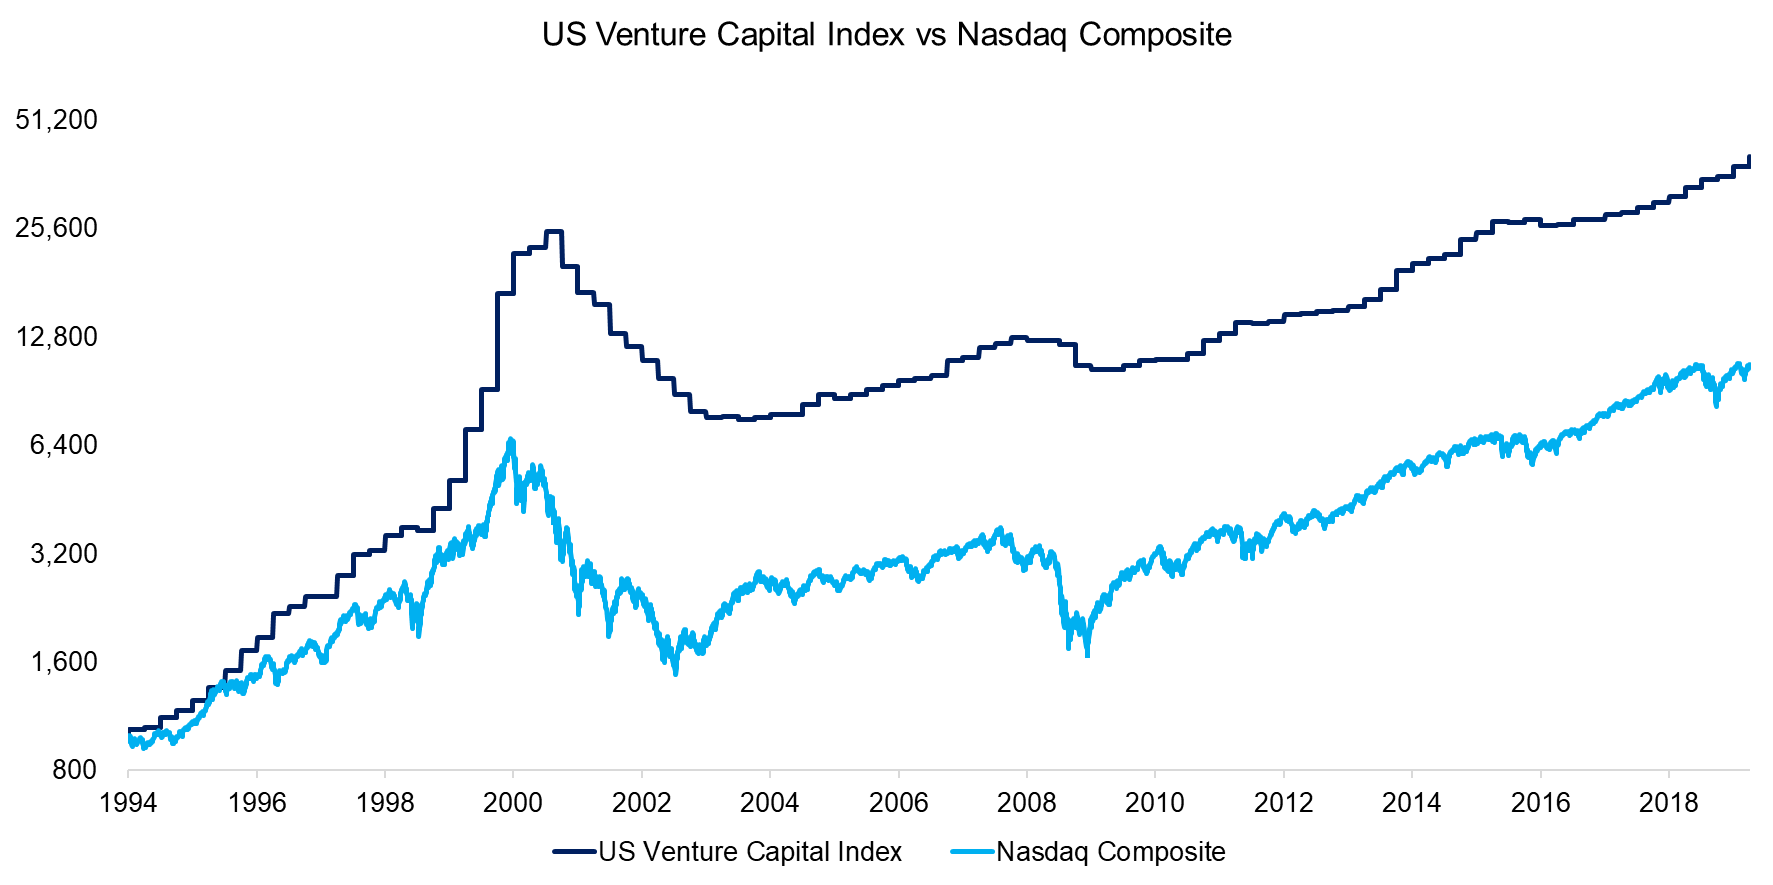
VC funds in the United States generated much higher returns than the NASDAQ from 1994 to 2018, but the performance trend is approximately the same. Inasmuch as these both represent portfolios of equity positions in high-growth companies, this is not unexpected.
Source: Cambridge Associates, FactorResearch.
But most of the VC outperformance can be attributed to the tech bubble in 2000. The number of VC firms more than doubled during this period, only to fall dramatically thereafter as the bubble collapsed. Asset managers often stop reporting returns after performance falls off a cliff and the liquidation of a fund or firm is in sight, which likely overstates performance over that timeframe.
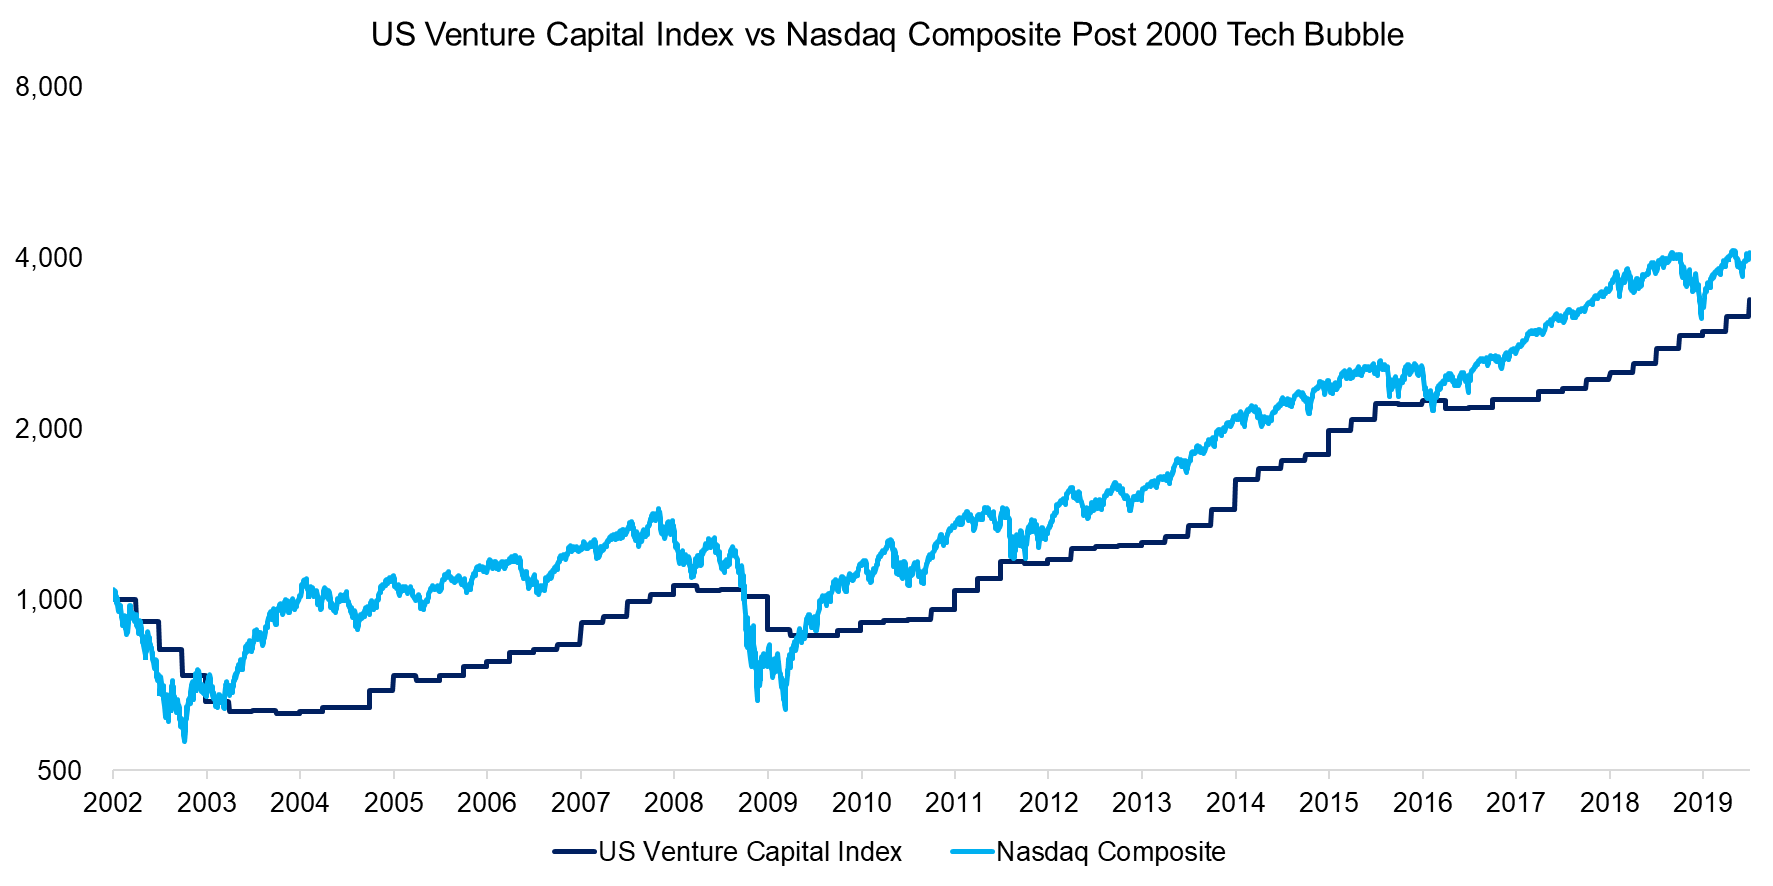
VC fund performance from 2002 onward is comparable to that of the NASDAQ. Reporting of VC returns lags that of the public markets, as is typical for private market return data. Results are usually reported on a quarterly basis and valuations tend to be smoothened, which helps explain why VC returns do not seem highly correlated to public equities. But this is largely a mind game since both represent long-only bets on the equity of high-growth firms.
Source: Cambridge Associates, FactorResearch.
FURTHER THOUGHTS
The world needs more innovation. We rely too much on fossil fuels, are losing the battle against superbugs, and still have painful experiences at the dentist.
Supporting innovation requires capital. But few investors have access to the most promising VC funds that justify the inherent risks.
As a consequence most investors should simply invest in public market indices like the NASDAQ. It may not be as exciting or as glamorous as the VC space, but exchange-traded funds (ETFs) make it almost free and it requires minimal initial or ongoing due diligence. And there’s daily liquidity. All of which make it a better bet than trying to get in on the next Uber or WeWork.
RELATED RESEARCH
Private Equity: Fooling Some Investors All The Time?
Chasing Mutual Fund Performance
Do Activist Investors Create Value?
Global Pension Funds: The Coming Storm
REFERENCED RESEARCH
Private Equity Performance: Returns, Persistence and Capital; Kaplan and Schoar, 2003
Is a VC Partnership Greater Than the Sum of Its Partners?; Ewens and Rhodes-Kropf, 2015
ABOUT THE AUTHOR
Nicolas Rabener is the CEO & Founder of Finominal, which empowers professional investors with data, technology, and research insights to improve their investment outcomes. Previously he created Jackdaw Capital, an award-winning quantitative hedge fund. Before that Nicolas worked at GIC and Citigroup in London and New York. Nicolas holds a Master of Finance from HHL Leipzig Graduate School of Management, is a CAIA charter holder, and enjoys endurance sports (Ironman & 100km Ultramarathon).
Connect with me on LinkedIn or X.

