Volatility-based Equity Allocations
The VIX is high, S&P 500 goodbye?
October 2022. Reading Time: 10 Minutes. Author: Nicolas Rabener.
SUMMARY
- The VIX currently trades within its top quartile since 1990
- Using volatility to time equity allocations is a widely used strategy
- However, it is challenging to pursue this over the long-term
INTRODUCTION
The One Ring from J.R.R. Tolkien’s Lord of the Rings saga is a plain gold ring unless it is thrown into a fire, when Elvish runes appear that roughly translate into “One Ring to rule them all, One Ring to find them, One Ring to bring them all, and in the darkness bind them”.
Investors are not searching for a ring, but they love the idea of a single all-powerful signal that can be used to time markets. Unfortunately, like the One Ring, such a signal remains a fantasy.
However, there are some systematic frameworks that have more merit than others. For example, there is plenty of academic research that shows that stock market risk tends to cluster, e.g. when volatility was high, there is a reasonable probability for it to remain high in the short term. In contrast, there is little evidence that returns cluster in the short term, although they do in the long term, which is defined as momentum.
Equity market volatility has been exceptionally low between the global financial crisis in 2009 and the COVID-19 crisis in 2020, but mostly remained above the long-term average of 19.6 since then. Some market participants are speculating that markets have changed, while others argue that the elevated volatility is a foreshadowing of a severe bear market.
In this research note, we will explore the utilization of volatility as a signal for equity allocations, which is one of the classic tactical asset allocation strategies (read Defining Tactical Asset Allocation).
VOLATILITY & STOCK MARKET RETURNS
Most investors consider the VIX index as the equivalent of the volatility or risk of the stock market. Technically, the VIX represents the implied volatility from S&P 500 options, which at times differs from realized volatility. The difference between both potentially can be harvested by investors via the variance risk premium (read The Variance Risk Premium: What Premium?).
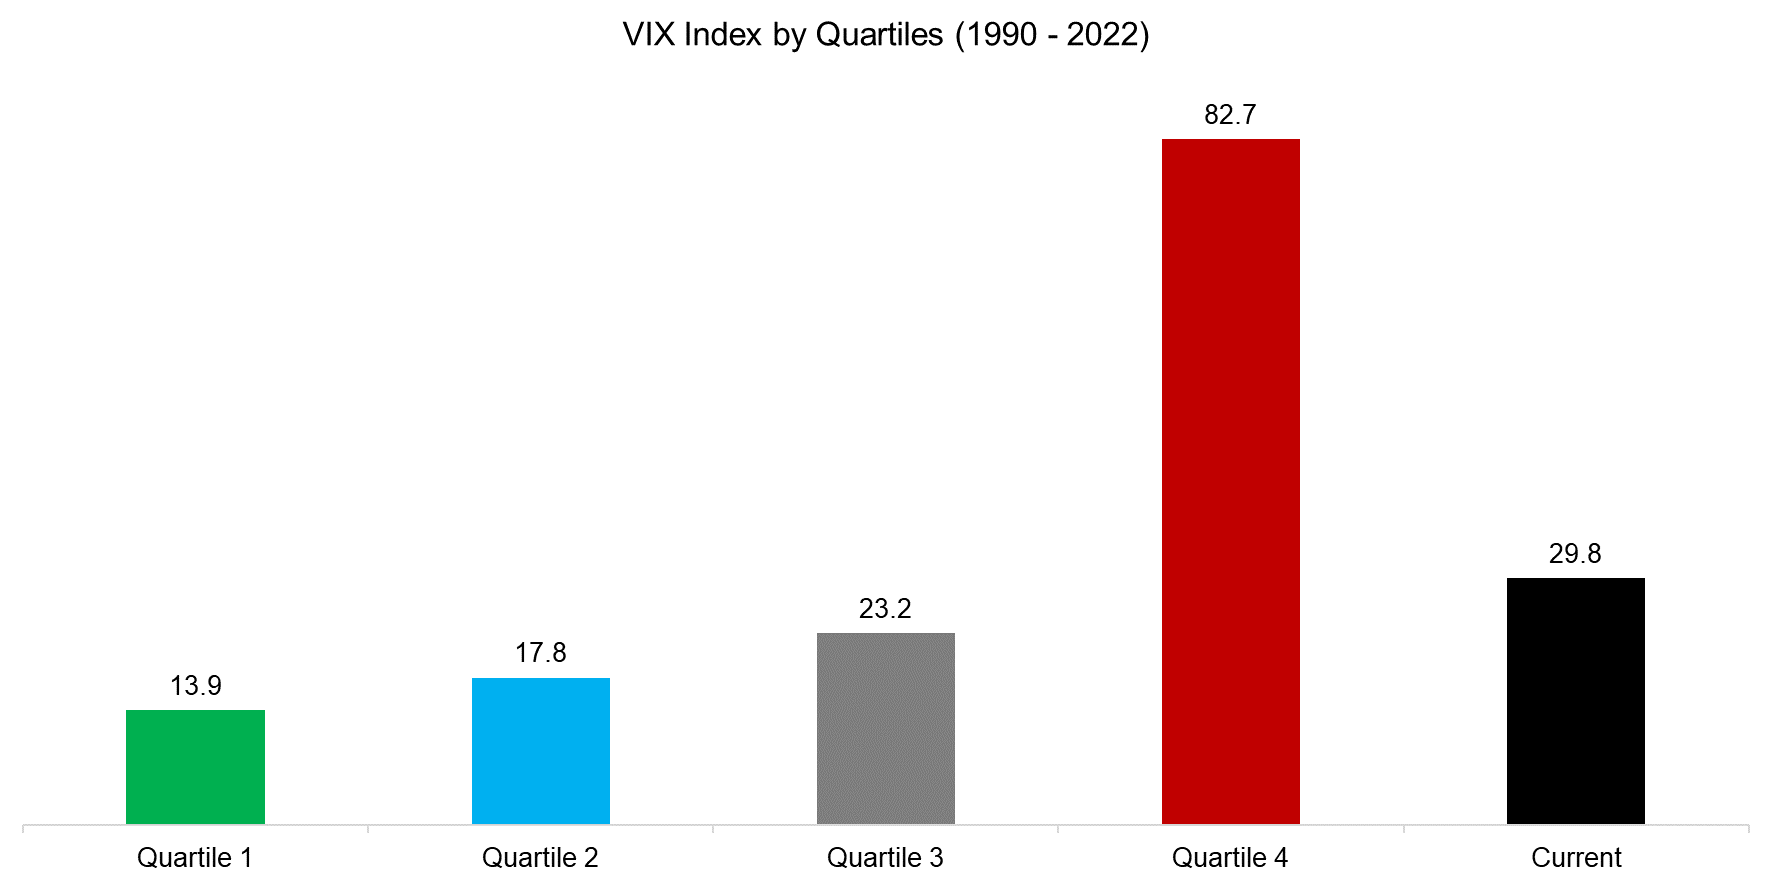
The VIX reached its all-time low at 9.1 in November 2017, although similar low readings were reached in 1993. During such times, market participants are complacent about risk and are living la dolce vita.
In contrast, the current VIX reading is approximately 30, which is within the highest quartile of VIX prints. Stated differently, investors are highly concerned about market risk, which is influenced by the war in Ukraine, the high global inflation, and related monetary tightening by central banks.
Source: Finominal
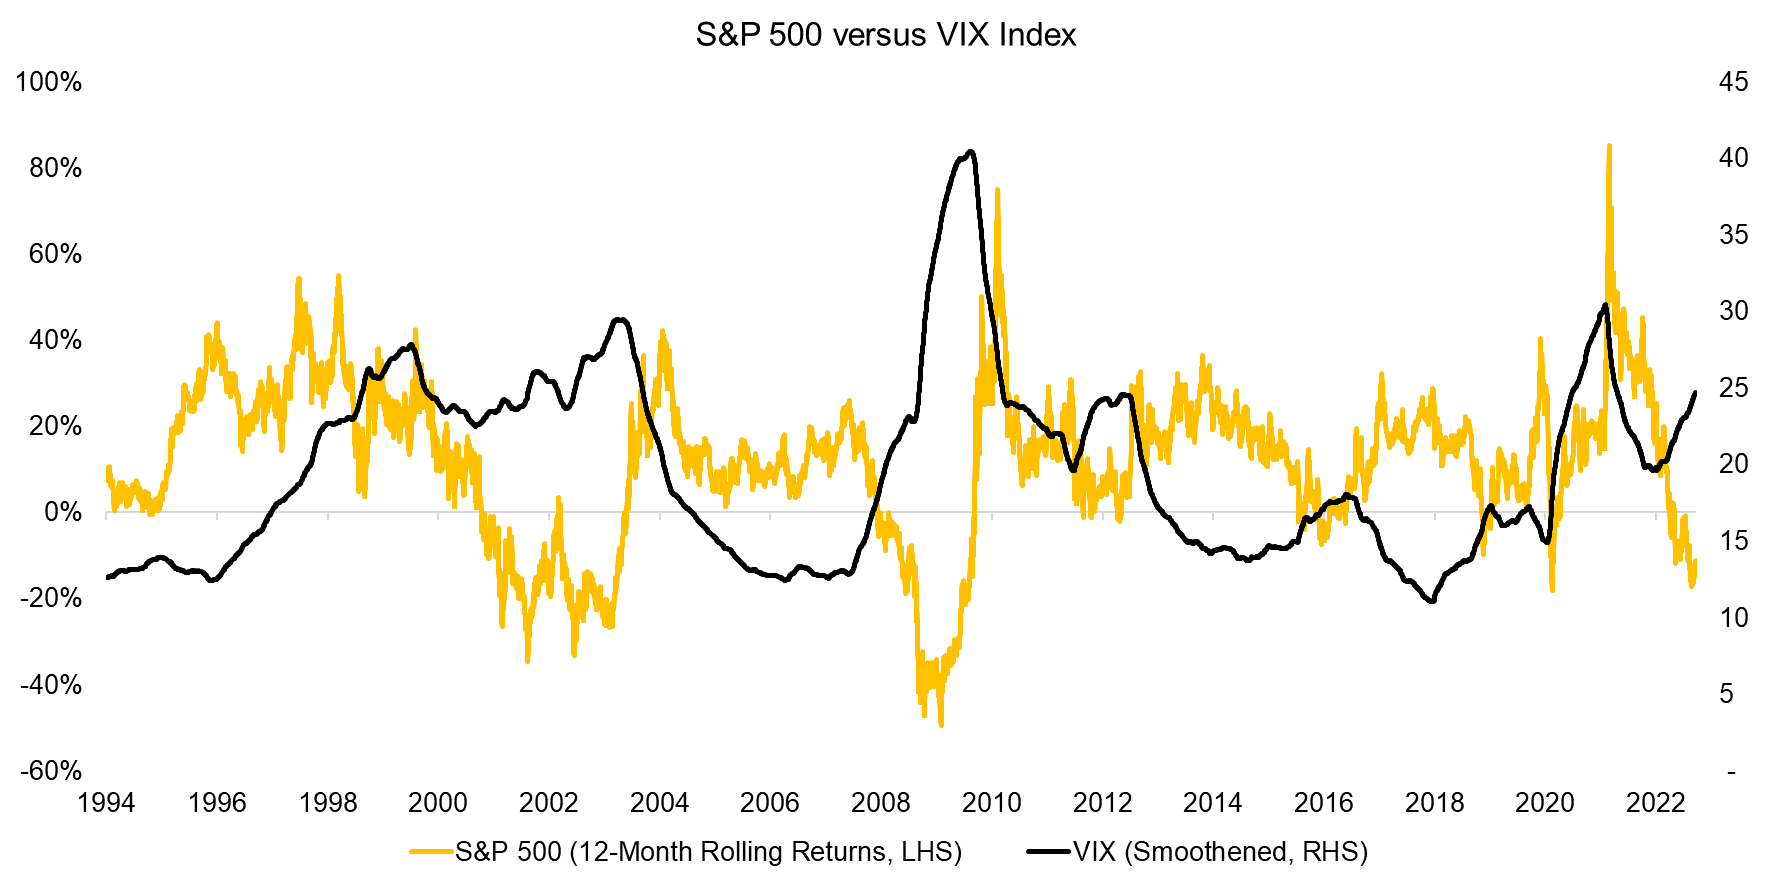
Comparing the 12-month rolling returns of the S&P 500 and the 12-month rolling average of the VIX seems to suggest that a decrease in stock prices is associated with an increase in volatility, which was especially pronounced in the global financial crisis in 2008.
However, we can also observe that there were periods when volatility was high, but the stock market generated strong returns, e.g. during the tech boom between 1998 to 2000 (read Stock Market Returns and Volatility).
Source: Finominal
VOLATILITY-BASED EQUITY ALLOCATIONS
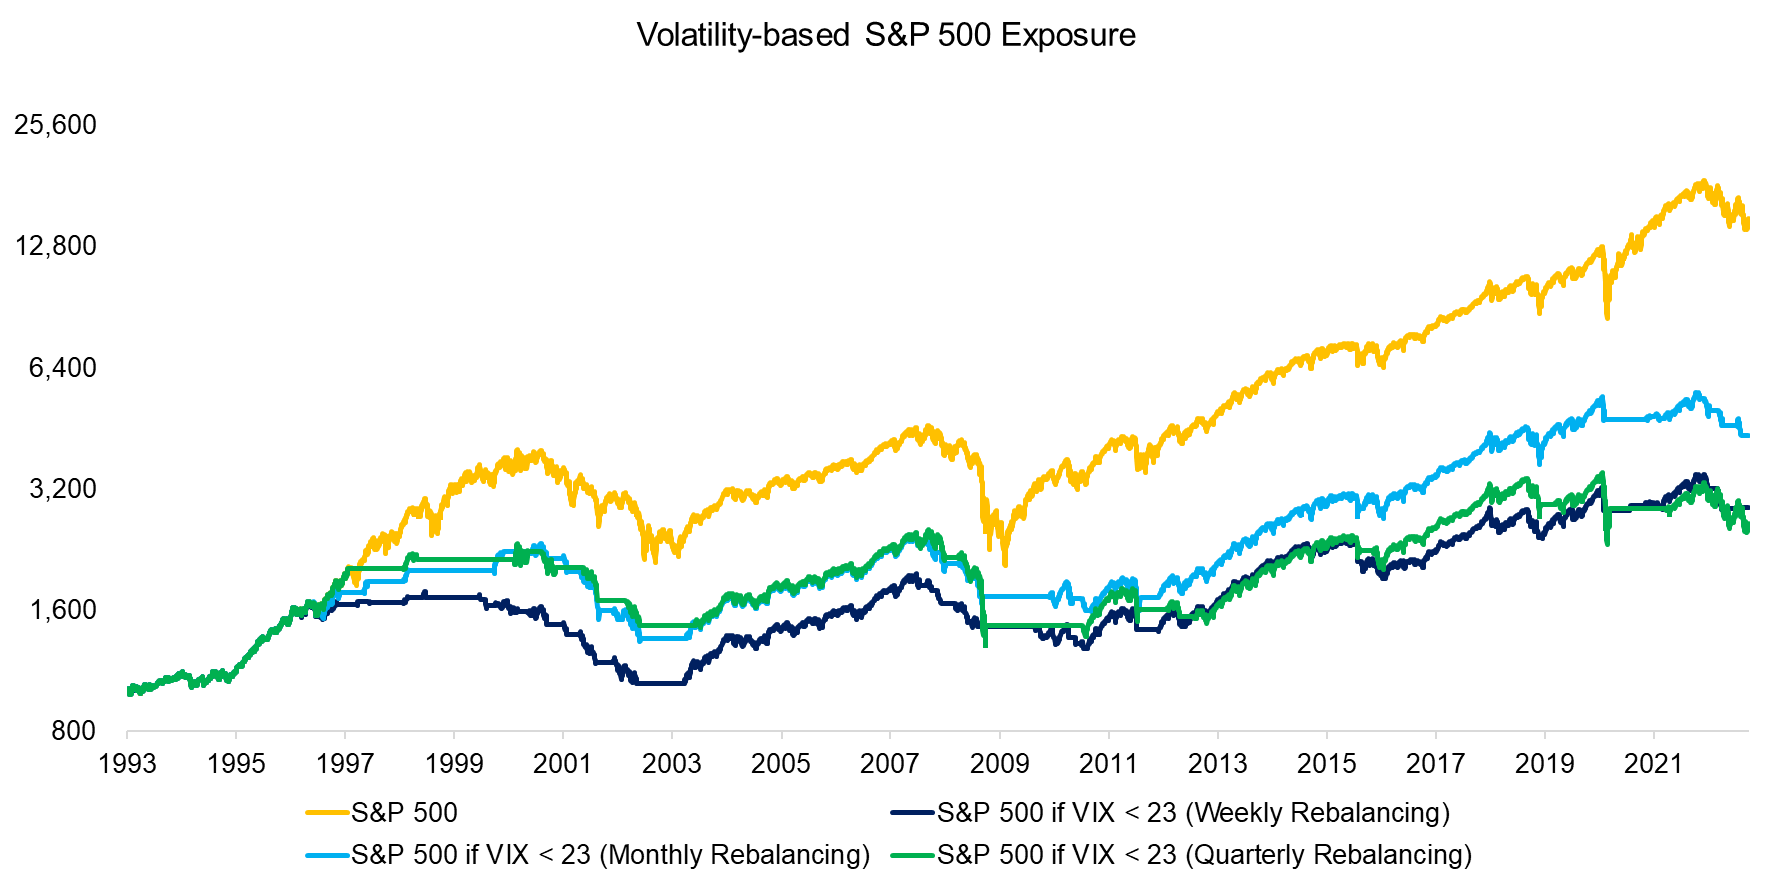
Next, we evaluate the framework of allocating to equities when the volatility was low to moderate, but move to cash when it was high. We use the VIX as a measure for volatility and change from a 100% to 0% allocation to the S&P 500 when the VIX trades within the fourth quartile, which we measure on a forward-rolling basis. Currently, the highest VIX quartile starts at a reading of 23, and goes all the way to the all-time high of 82.7, which was reached during the COVID-19 crisis in March 2020.
We exclude transaction costs, but include a day delay for using the signal to determine the allocations. Furthermore, we show three scenarios where we vary the rebalancing period from weekly to quarterly. We observe that the total return of this tactical asset allocation strategy was below that of the S&P 500 for all three rebalancing scenarios in the period from 1993 to 2022. We could have used interest-bearing bonds instead of cash, which would have slightly increased the returns.
Source: Finominal
However, although the total return of the tactical strategy was lower than that of the S&P 500, we observe that many drawdowns were substantially reduced. It can be argued that the goal of using a volatility-based for allocating to equities should be higher risk-adjusted rather than total returns.
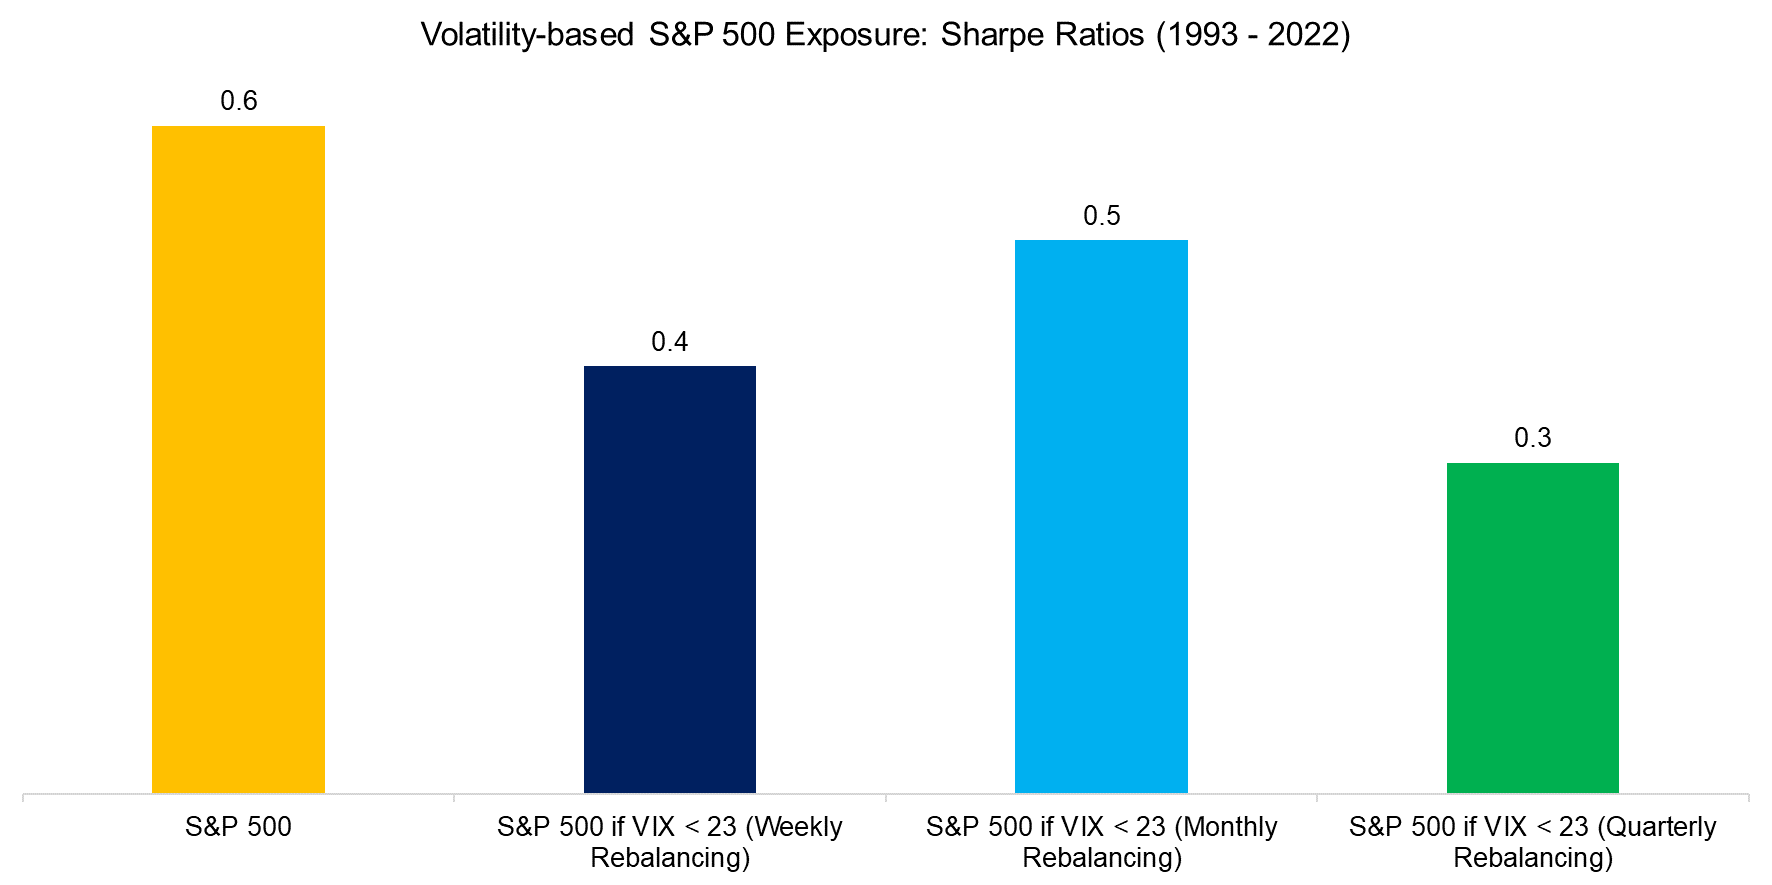
Given this, we calculate the Sharpe ratios, but this highlights lower risk-adjusted returns for the tactical strategy than for the S&P 500, regardless of the rebalancing period. This result is primarily explained by the period between 1998 and 2000, when initially volatility and returns were high, so the tactical strategy was out of the market. Then the tech bubble collapsed, but volatility was not always in the fourth quartile. Essentially, the volatility-based asset allocation missed out in the good times but then tried partying when the cops were already on the scene.
Source: Finominal
EXPANDING THE TIME HORIZON
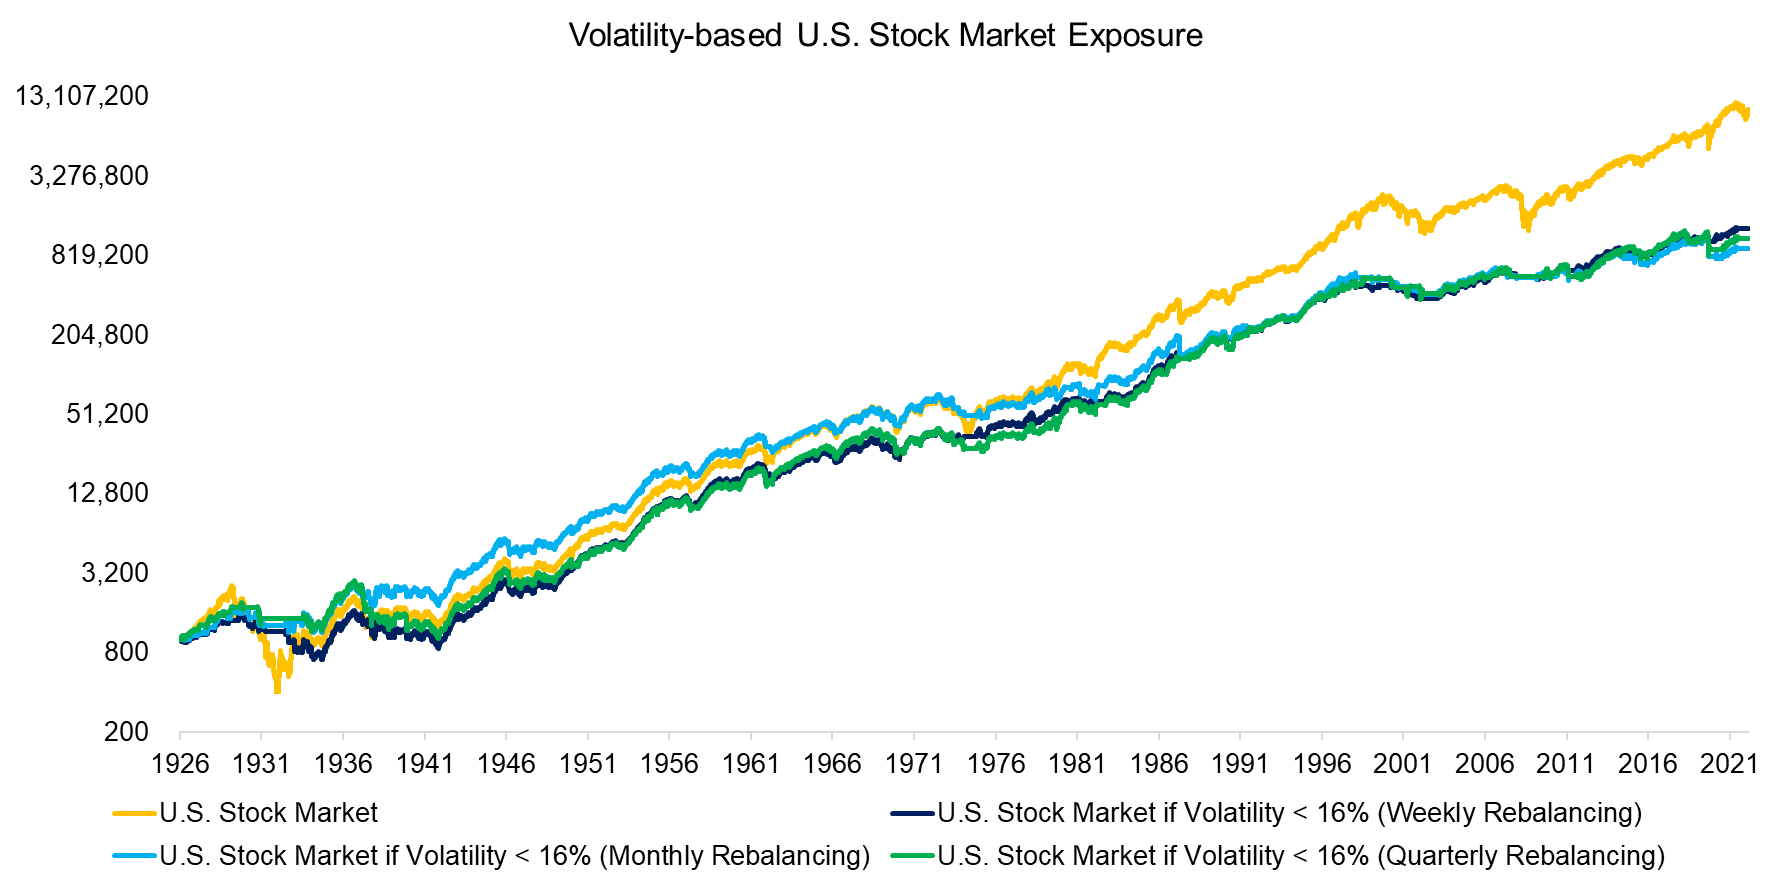
30 years is a long time period for testing a strategy, but we can expand the testing period to close to 100 years if we use realized instead of implied volatility. We replicate the strategy for the time period from 1926 to 2022, which also highlights lower total returns for the volatility-based asset allocation strategy.
Source: Finominal, Kenneth R. French Data Library
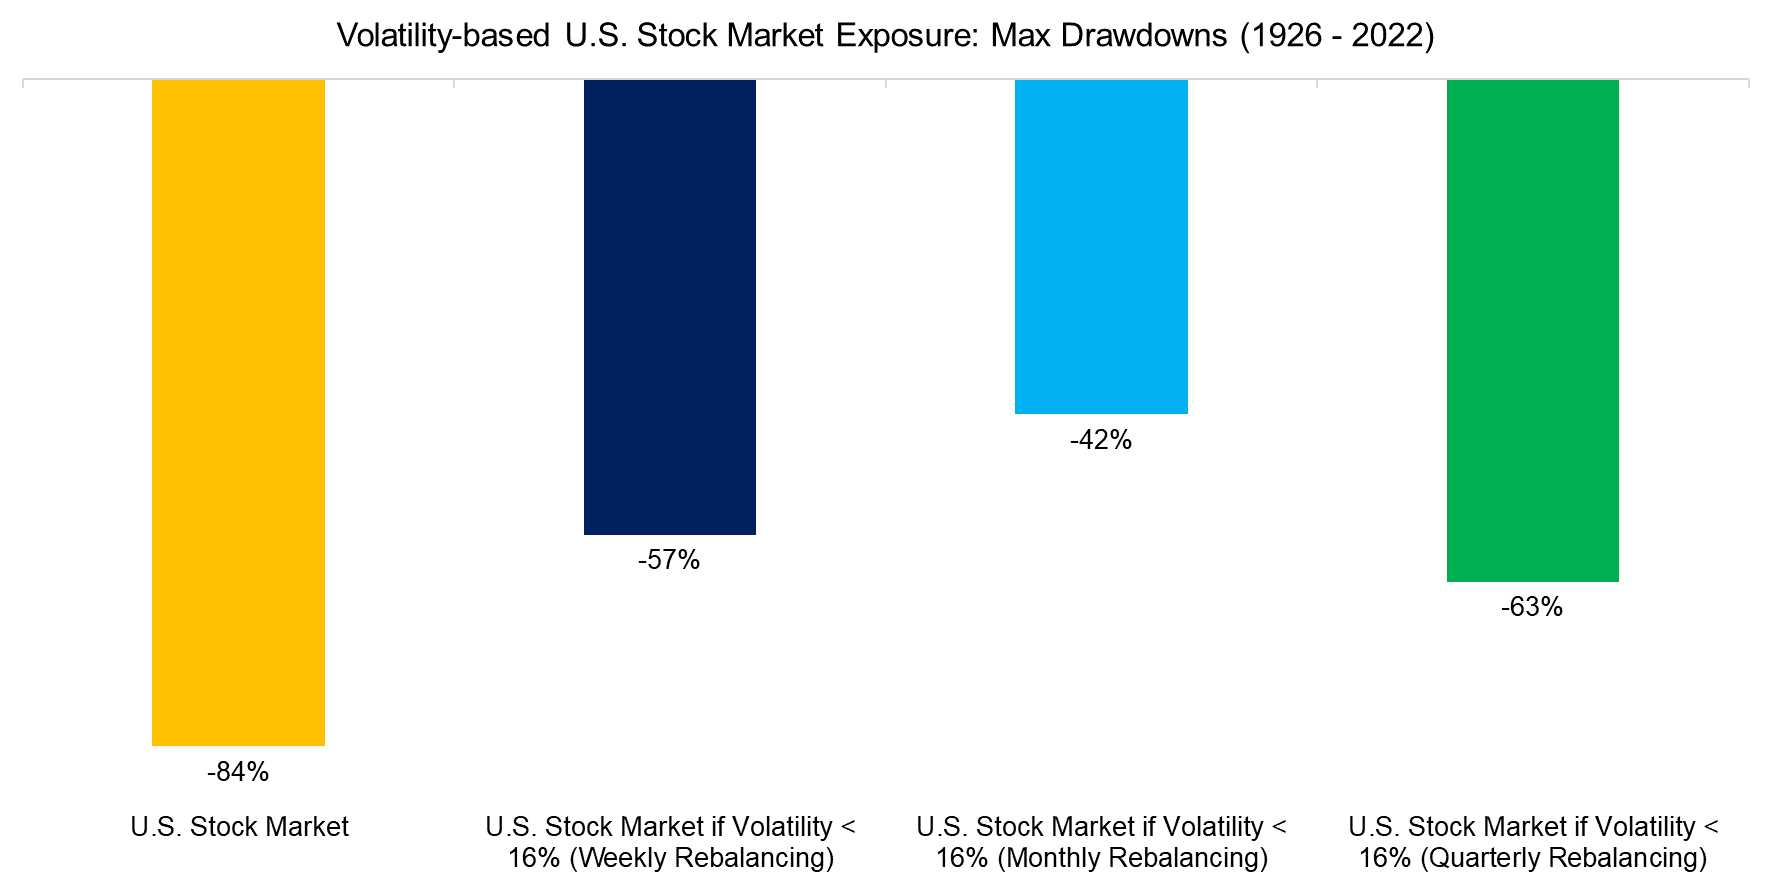
We observe that the tactical asset allocation strategy would have kept investors out of the U.S. stock market during the Great Depression in the 1930s, which would have significantly reduced the maximum drawdowns. The S&P 500 declined by 84%, compared to 42% to 63% for the volatility-based asset allocations.
However, despite this dramatic stock market crash, the S&P 500 caught up with two of the tactical strategies by 1940. Only the strategy using monthly rebalancing managed to outperform the S&P 500 until 1975, but this can likely be attributed to model luck rather than monthly rebalancing being more effective.
Source: Finominal, Kenneth R. French Data Library
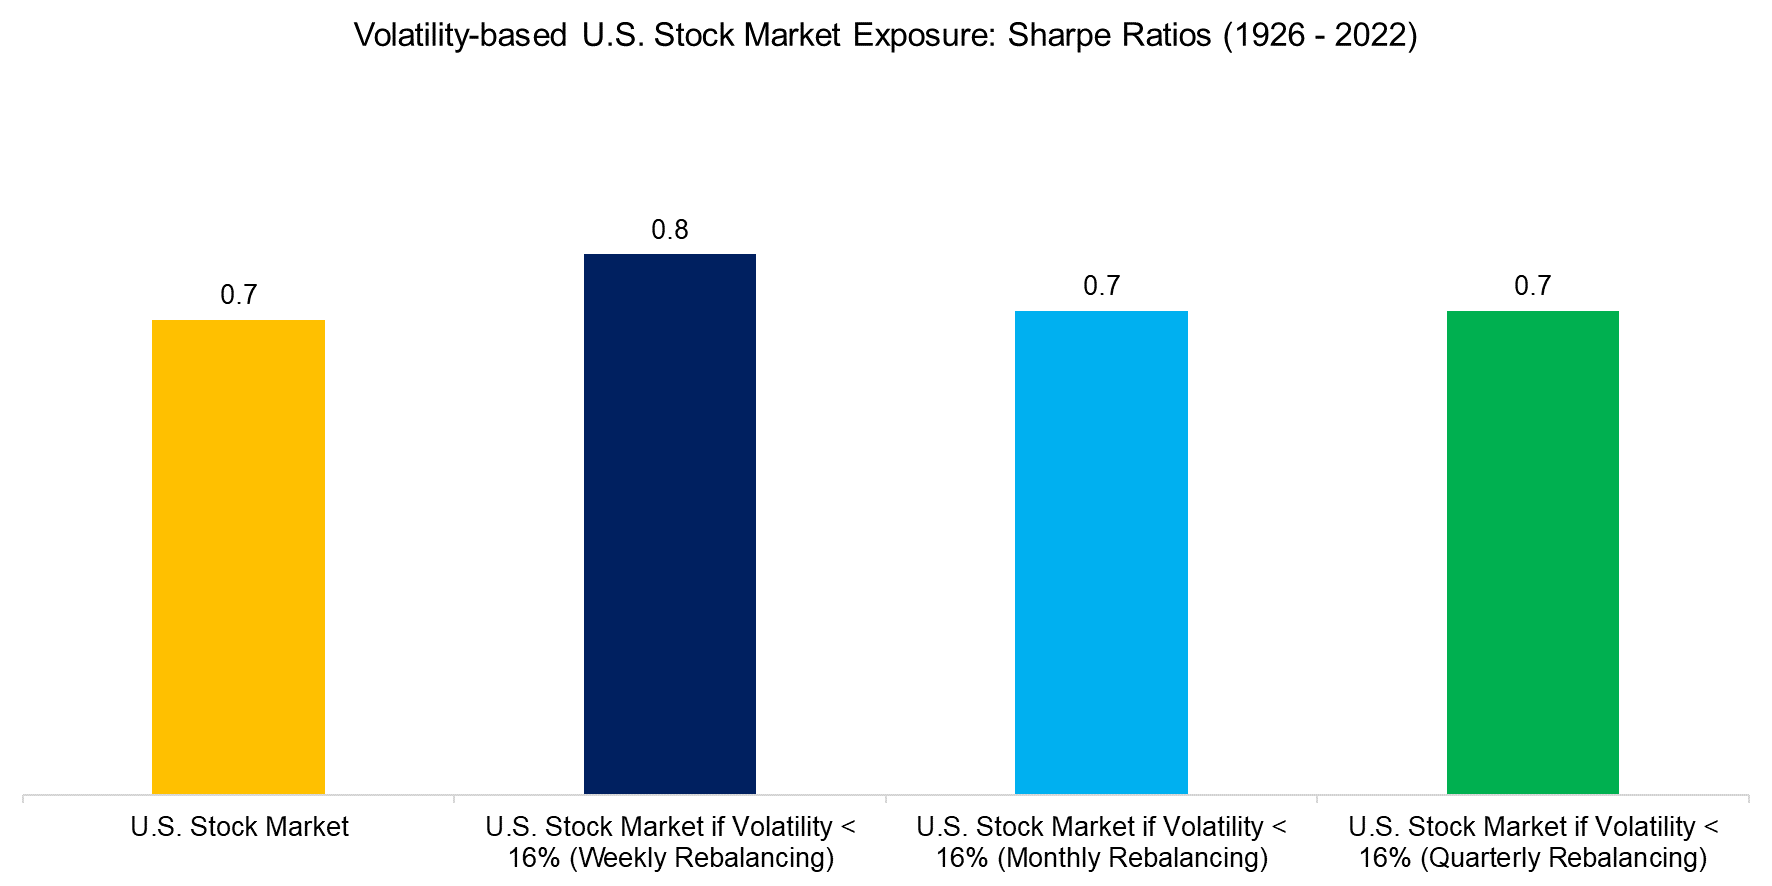
Finally, we calculate the Sharpe ratios for the period from 1926 to 2022, which highlights almost identical returns for the U.S. stock market and the volatility-based asset allocation strategies. This contrasts with the earlier results for the 30-year period using the VIX, where risk-adjusted returns were lower.
Source: Finominal, Kenneth R. French Data Library
FURTHER THOUGHTS
Based on achieving similar Sharpe ratios using volatility for equity allocations, an investor might argue that it is a better way than constant equity exposure. Leverage could be used to generate the same total return as the S&P 500, e.g. via leveraged ETFs, and capital could be invested into bonds when out of the stock market to generate additional returns.
However, we excluded transaction costs and there is a substantial model risk, eg the backtested returns are sensitive to the rebalancing period. Even if an investor would get comfortable with the model risks, the real challenge would be sticking to this framework over the long term. Being out of the market when stocks are going up is far easier said than done.
A better alternative is to scale the equity allocation in line with an investor’s risk preferences, which is what most risk parity products do. Ultimately, investors need to be invested in equities to grow their wealth as there are no true alternatives, but the difficulty is staying invested, where volatility optimization may be of help.
RELATED RESEARCH
Long Volatility Strategies versus Tactical Asset Allocation
Defining Tactical Asset Allocation
Tactical ETFs: Tactfully No, Thank You?
Risk-Managed Equity Exposure II
Risk-Managed Equity Exposure
Market Timing vs Risk Management
Market Timing with Multiples, Momentum, and Volatility
Market Timing via the VRP?
The Variance Risk Premium: What Premium?
ABOUT THE AUTHOR
Nicolas Rabener is the CEO & Founder of Finominal, which empowers professional investors with data, technology, and research insights to improve their investment outcomes. Previously he created Jackdaw Capital, an award-winning quantitative hedge fund. Before that Nicolas worked at GIC and Citigroup in London and New York. Nicolas holds a Master of Finance from HHL Leipzig Graduate School of Management, is a CAIA charter holder, and enjoys endurance sports (Ironman & 100km Ultramarathon).
Connect with me on LinkedIn or X.

