What Are Growth Stocks?
Growth lies in the eye of the beholder.
January 2023. Reading Time: 10 Minutes. Author: Nicolas Rabener.
SUMMARY
- Growth stocks can be defined via valuations, fundamentals, or performance
- These stocks have generated essentially zero excess returns since 2005
- Neither has the inverse basket (low valuations, low growth, low momentum)
INTRODUCTION
When Yale history professor Sherman Kent interviewed 23 NATO officers on their interpretation of probabilistic words in 1964, the results were surprising and concerning. The probability associated with the word “probable” ranged from 25% to 95%, depending on the officer. Naturally, this begs the question of how worried a military commander should be when he is informed that an attack is probable.
Although less concerning, such differentiated perceptions are common in the investing world. Take growth stocks, how exactly are these defined?
For many financial researchers, these simply represent the inverse of value stocks, ie the most expensive ones, while investors often consider growth stocks as companies that have great fundamentals. Another definition is simply the stocks that have outperformed. Or the ones that have been dominating headlines, which were companies like Amazon or Apple for most of the past decade.
Different definitions lead to different portfolios, which makes evaluating growth-focused strategies challenging. In this research article, we will explore three common types of growth stocks namely expensive, high growth, and high momentum stocks.
VALUATIONS OF GROWTH STOCKS
First, we create five indices that represent common perceptions of growth stocks. Stocks are selected on price-to-book (P/B), price-to-earnings (P/E), sales growth, earnings growth, or momentum, using the top 10% of stocks for each metric from the universe of all U.S. stocks with a market capitalization larger than $1 billion. P/B is calculated using the latest available book value, P/E with the last 12 months of earnings, sales and earnings growth based on 3 years of data, and momentum with a 12-month lookback, excluding the most recent month (read Growth: Factor Investing Sinning?).
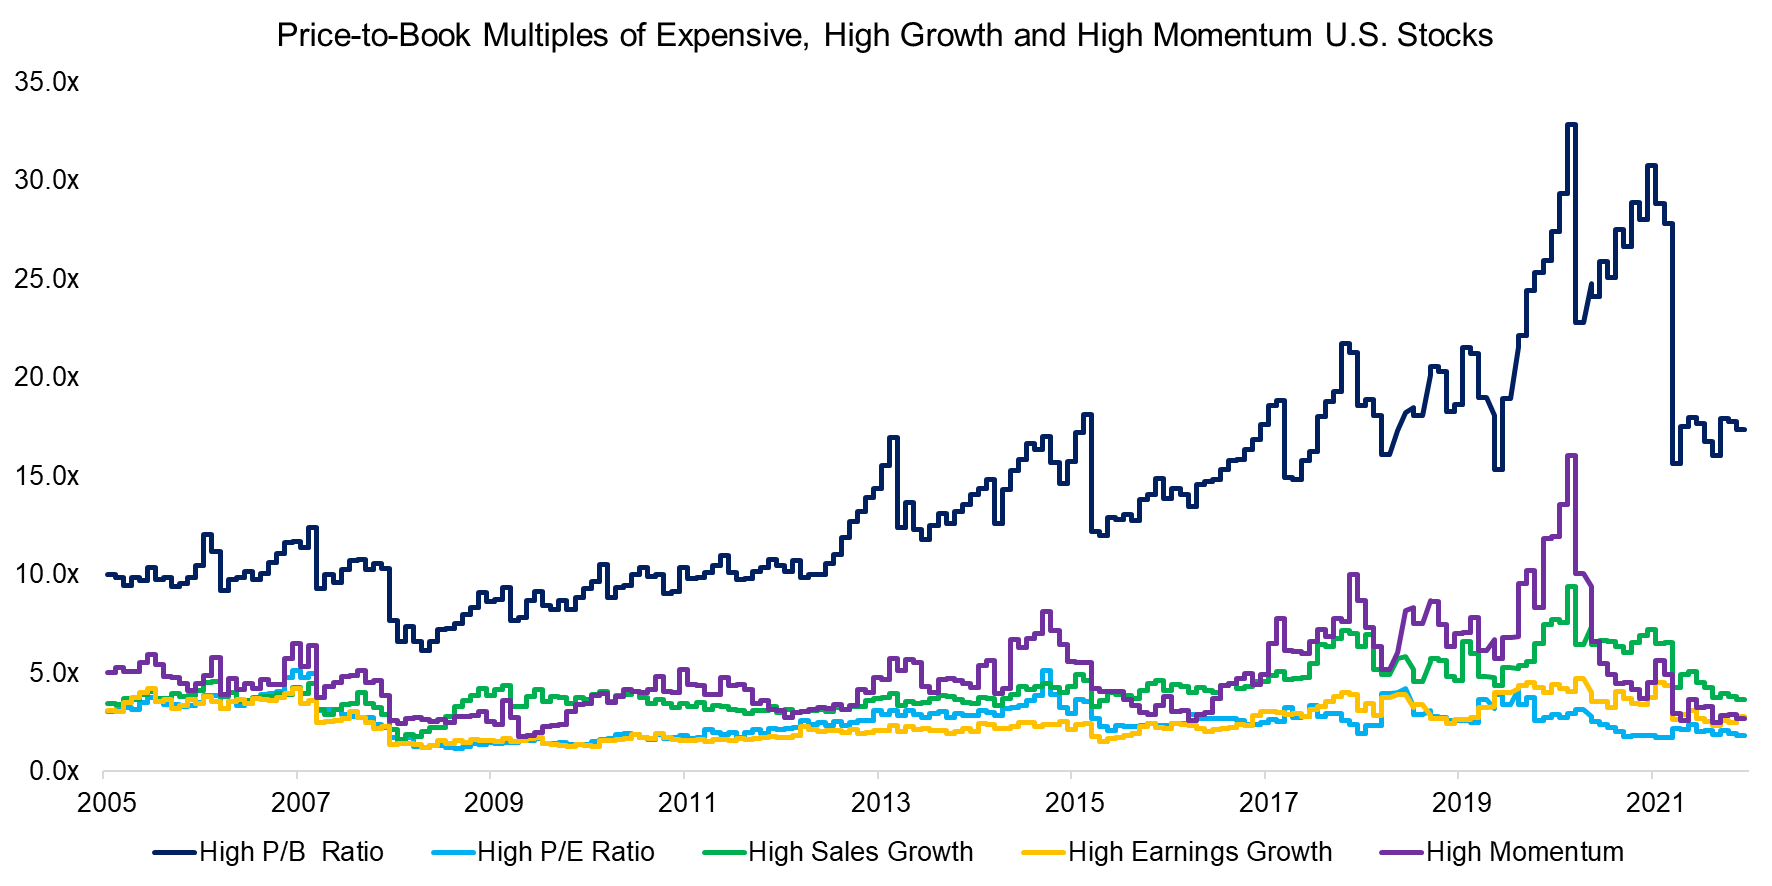
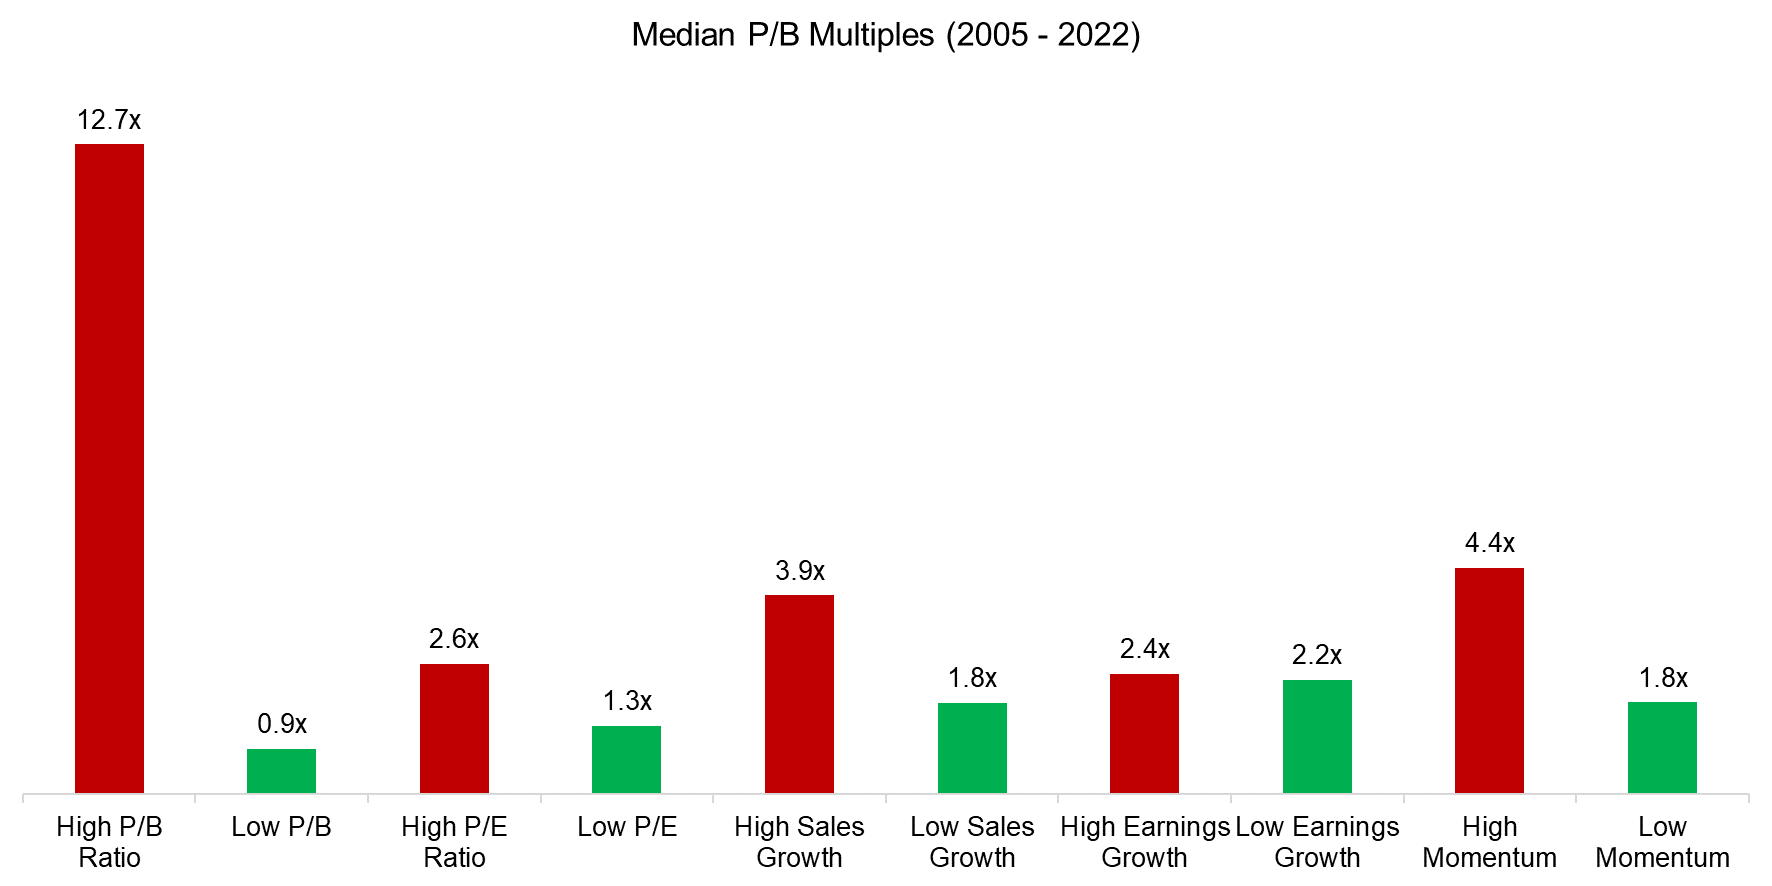
Next, we compare the valuations of these portfolios in the period from 2005 to 2022 using P/B multiples. As expected, the portfolio comprised of stocks with high P/B multiples has the highest median P/B multiple. However, we also notice stocks selected on P/E have a significantly lower average P/B multiple, which indicates a different underlying portfolio, despite both portfolios consisting of expensive stocks. Similarily, stocks with high fundamental growth or momentum did not trade at high P/B multiples.
Source: Finominal
BREAKDOWN BY SECTORS
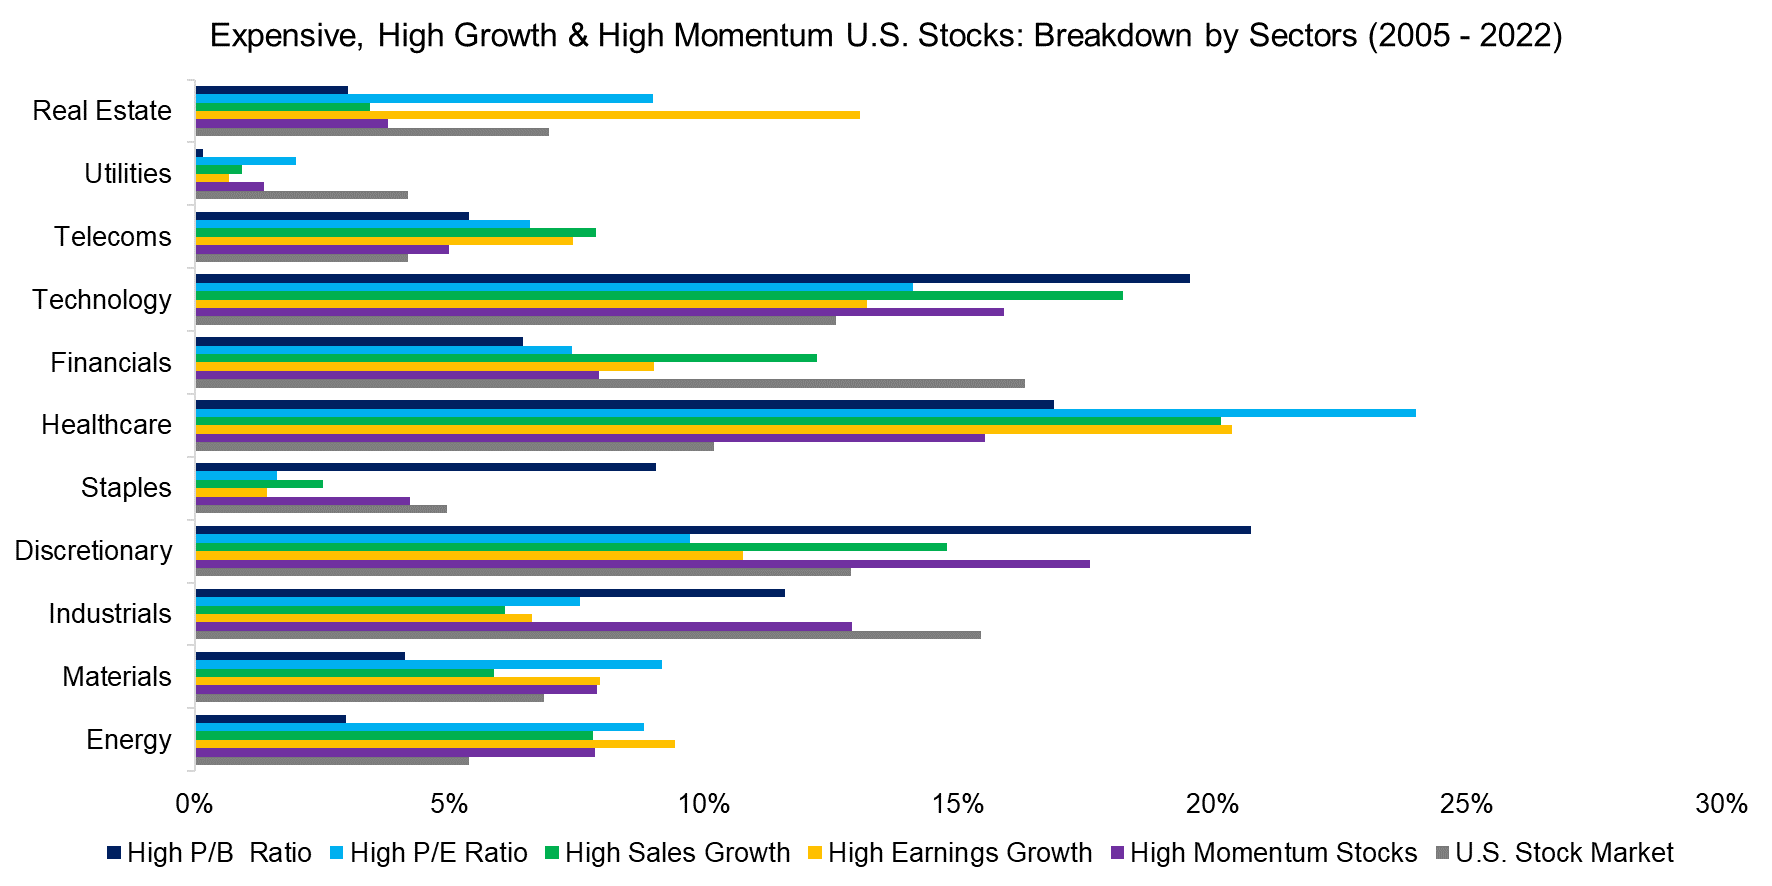
Next, we analyze the breakdown by sectors of the five indices as well as the stock market in the period from 2005 to 2022.
It is worth noting that all indices are created using equal weights rather than market capitalizations for portfolio construction, which explains why healthcare is the dominant sector for stocks selected on P/E, high sales and high earnings growth, in contrast to consumer discretionary for P/B and momentum. If we were using market capitalizations for stock weights, then the technology sector would play a much more important role.
Some metrics like P/B and P/E have structural sector biases, eg biotech companies are almost always more expensive than financial stocks. In contrast, the momentum factor changes its sector exposure dramatically, which is demonstrated by the 36% weight to energy stocks in the high momentum portfolio currently, compared to 8% for the average over the last 17 years.
Source: Finominal
PERFORMANCE OF EXPENSIVE, HIGH GROWTH & HIGH MOMENTUM STOCKS
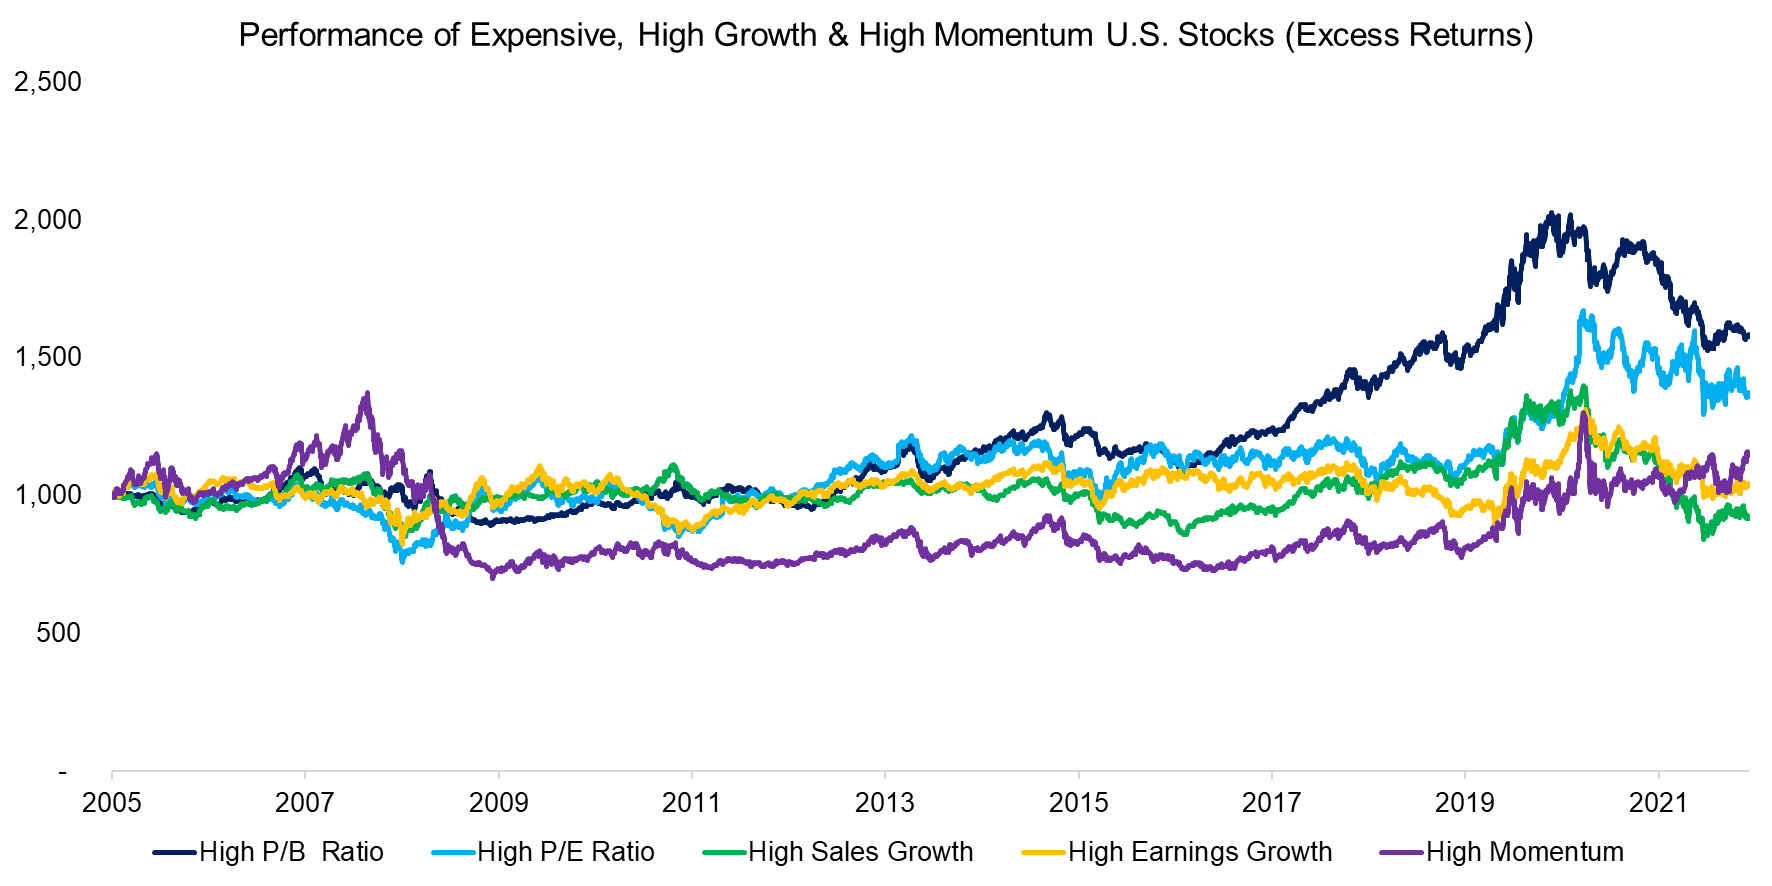
We calculate the excess returns of these indices by subtracting the returns of the stock market, which essentially highlights the outperformance of these portfolios.
Unfortunately for growth investors, we observe that in the period from 2005 to 2022, there was little benefit in investing in such stocks, regardless of the definition. Only expensive stocks (P/B & P/E) created positive excess returns, but these have been giving away most of their outperformance since mid-2020.
Source: Finominal
CORRELATION ANALYSIS
The excess returns of expensive, high growth and high momentum stocks were zero for most of the last 17 years, until these collectively started outperforming the stock market in 2017, and then underperforming from 2020 onwards.
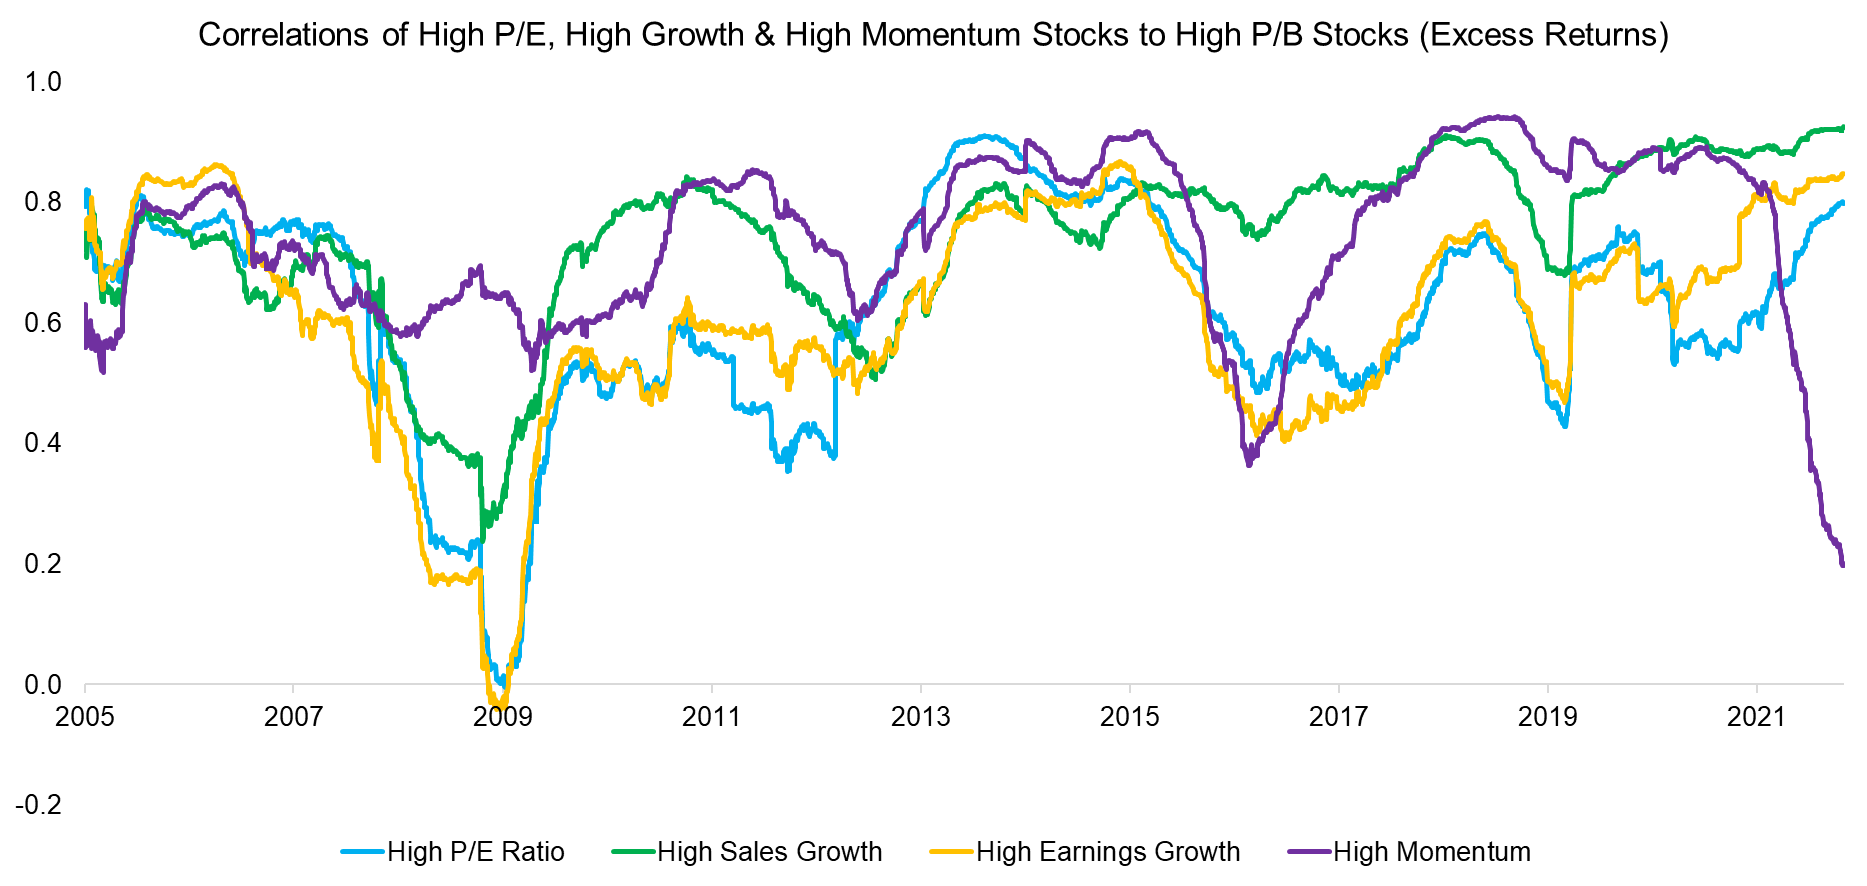
Although there were some differences in performance, the overall trends were similar, which indicates the same return drivers. In order to quantify their relationships, we calculate the rolling 12-month correlations to the P/B portfolio. The average correlations ranged from 0.61 for high earnings growth to 0.74 for high sales growth. Overall, it seems that high P/E, high sales and high earnings growth had the most similar portfolios as their trends in correlation were often identical.
Source: Finominal
PERFORMANCE OF CHEAP, LOW GROWTH & LOW MOMENTUM STOCKS
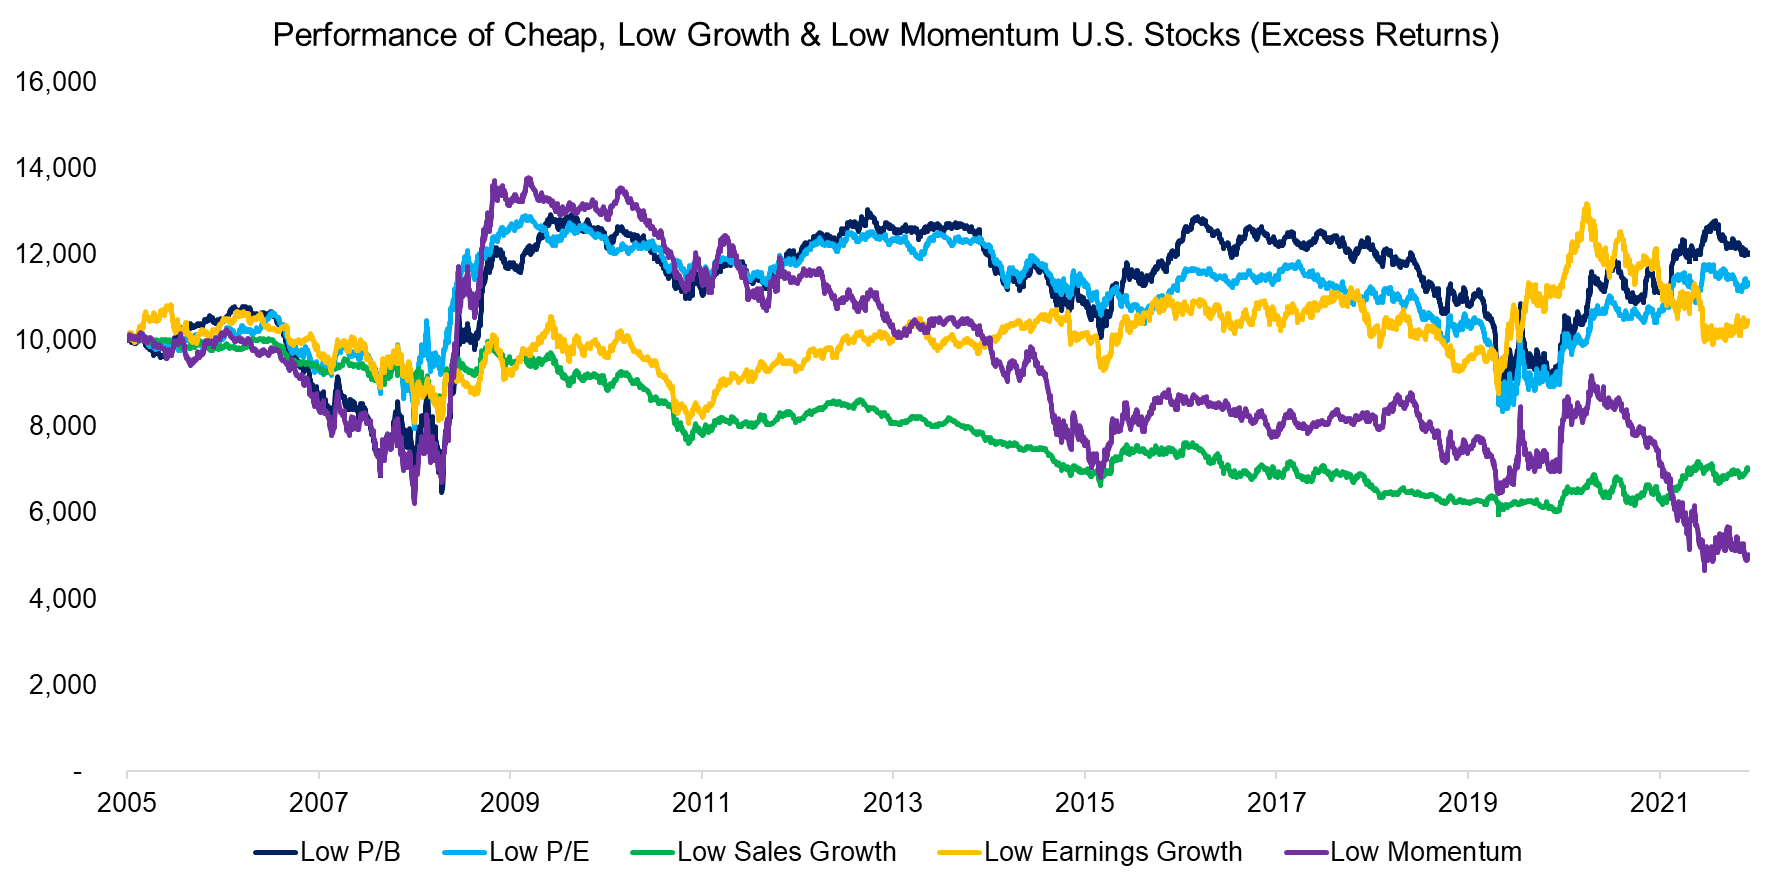
Naturally, we can also review the performance of the inverse portfolios, which consist of cheap, low growth, and low momentum stocks. The excess returns have also been low to negative. The portfolios comprised of low sales growth and low momentum stocks have been consistently losing money, except for a recovery post the global financial crisis in 2009.
Astute readers might recognize the crash of the momentum factor, which is the combination of high and low momentum stock portfolios. When stock markets recovered in early 2009, previously underperforming sectors like financials rallied significantly and outperformed the stocks that held up during the crisis (read Improving the Momentum Factor and Momentum Variations).
Source: Finominal
VALUATION COMPARISON
Finally, we contrast the median P/B multiples of all portfolios analyzed. The P/B portfolio had the largest difference in median valuation multiples, as per its definition. For other portfolios, eg where stocks were selected on high and low earnings growth, there was only a marginal difference in valuations.
Naturally, this changes depending on which valuation multiple is measured. Using P/B can easily be challenged as it is not a relevant metric for evaluating technology companies that own substantial intellectual property. However, other metrics have other issues, eg EV/EBITDA is irrelevant for most financial companies, P/E is very volatile, etc (read Value Factor: Comparison of Valuation Metrics).
Source: Finominal
FURTHER THOUGHTS
Comparisons between the extreme equity valuations between 2019 and 2022 and the tech bubble of 2000 were often discarded by growth investors with the argument that modern tech companies are often highly profitable companies, compared to the unprofitable internet stocks 20 years earlier.
Although this is partially true, it is missing the point.
Given the choice of holding GE or Apple, most investors will hold the latter. GE is a fallen star with multiple ongoing business concerns, mainly negative news flow, and plenty of “Sell” ratings. In contrast, Apple creates products that delight its customers while charging hefty markups, making it the most valuable company on the planet. But no pain, no excess gains.
RELATED RESEARCH
GARP: Golden or Garbage?
Improving the Odds of Value Investing
Low Vol-Momentum vs Value-Momentum Portfolios
Intregrated Value, Growth & Quality Portfolios
Improving the Momentum Factor
ABOUT THE AUTHOR
Nicolas Rabener is the CEO & Founder of Finominal, which empowers professional investors with data, technology, and research insights to improve their investment outcomes. Previously he created Jackdaw Capital, an award-winning quantitative hedge fund. Before that Nicolas worked at GIC and Citigroup in London and New York. Nicolas holds a Master of Finance from HHL Leipzig Graduate School of Management, is a CAIA charter holder, and enjoys endurance sports (Ironman & 100km Ultramarathon).
Connect with me on LinkedIn or X.

