What’s My International Exposure?
Comparing top-down vs bottom-up approaches
February 2023. Reading Time: 10 Minutes. Author: Nicolas Rabener.
SUMMARY
- The S&P 500 has meaningful exposure to international markets
- Measuring geographical exposure can be done top-down or bottom-up
- However, both approaches have flaws
INTRODUCTION
Globalization has significantly improved our lives, although some countries like Germany have benefitted more than others given export-oriented industries. It is easy for politicians to highlight damage done by foreign nations, and make the case for more protective and nationalistic policies.
However, most countries depend on global trade, and even large economies like China or the US can not turn away from it without severe economic consequences. Moving jobs that were outsourced to China or Vietnam back to the US or Europe will perhaps improve supply chain logistics, as well as achieve certain political goals, but it unlikely will make production cheaper.
Investors typically consider the S&P 500 as a portfolio of 500 American companies. Although most of the constituents are headquartered in the US, many have significant sales abroad. Coca-Cola generates more than 60% of its sales outside of the US, so is it an American or global company?
Buying the S&P 500 will provide investors with exposure to the global economy, so adding international or emerging market funds or ETFs might not provide any additional diversification benefits. Key is to measure the exposure to geographies, which we explore in this article.
METHODOLOGY COMPARISONS
Investors can analyze the breakdown by geographies top-down or bottom-up. The former implies regressing a portfolio against variables representing the different geographies. The latter means analyzing fundamental data like the location of headquarters or breakdown by revenues of the underlying companies. Unfortunately, many companies do not provide any information on where their sales originate, which makes this approach often difficult to implement.
We will first evaluate the top-down methodology, but will contrast the results with fundamental data later on. The basic approach is to run a regression analysis on a single stock or portfolio using equity indices for the major regions. We take the S&P 500 for the US, S&P Europe 350 for Europe, MSCI Japan for Japan, and MSCI Emerging Markets index for emerging markets. Naturally, this could be expanded to include more countries or conducted more granularly on single-country level (read Factor Exposure Analysis 101: Linear vs Lasso Regression).
One of the issues with these indices is that they are moderate to highly correlated with each other, e.g. US and European stock markets exhibited a correlation of 0.85 over the last 20 years. This heteroskedasticity can be reduced by residualizing the indices (read Factor Exposure Analysis 103: Exploring Residualization).
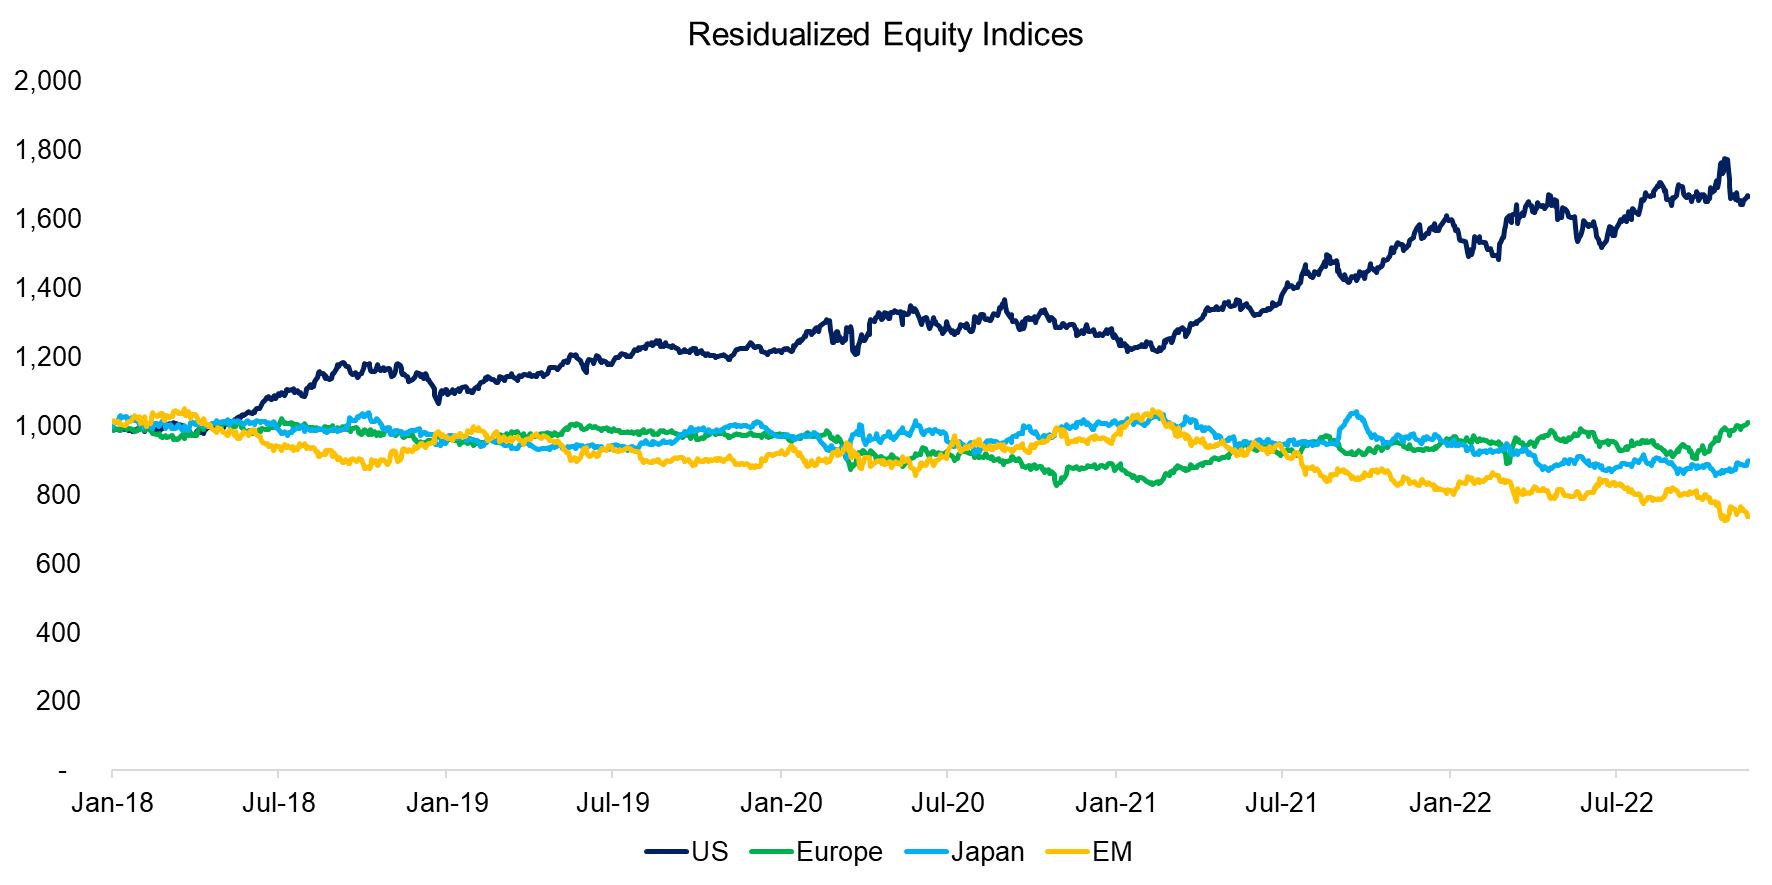
Running a residualization process across the four indices highlights that only US stocks generated positive returns for investors over the last five years. Stated differently, even if the Japanese or European stock markets might have been up over this period, all of the gains can be attributed to the US stock market.
Source: Finominal
FACTOR BETA TO EQUITY INDICES
We randomly selected a global equity fund, namely the Columbia Select Global Equity Fund (CGEZX), which manages $600 million and charges a management fee of 0.99%. The portfolio is comprised of 45 stocks, where Microsoft is the largest holding currently with a 7.7% stake.
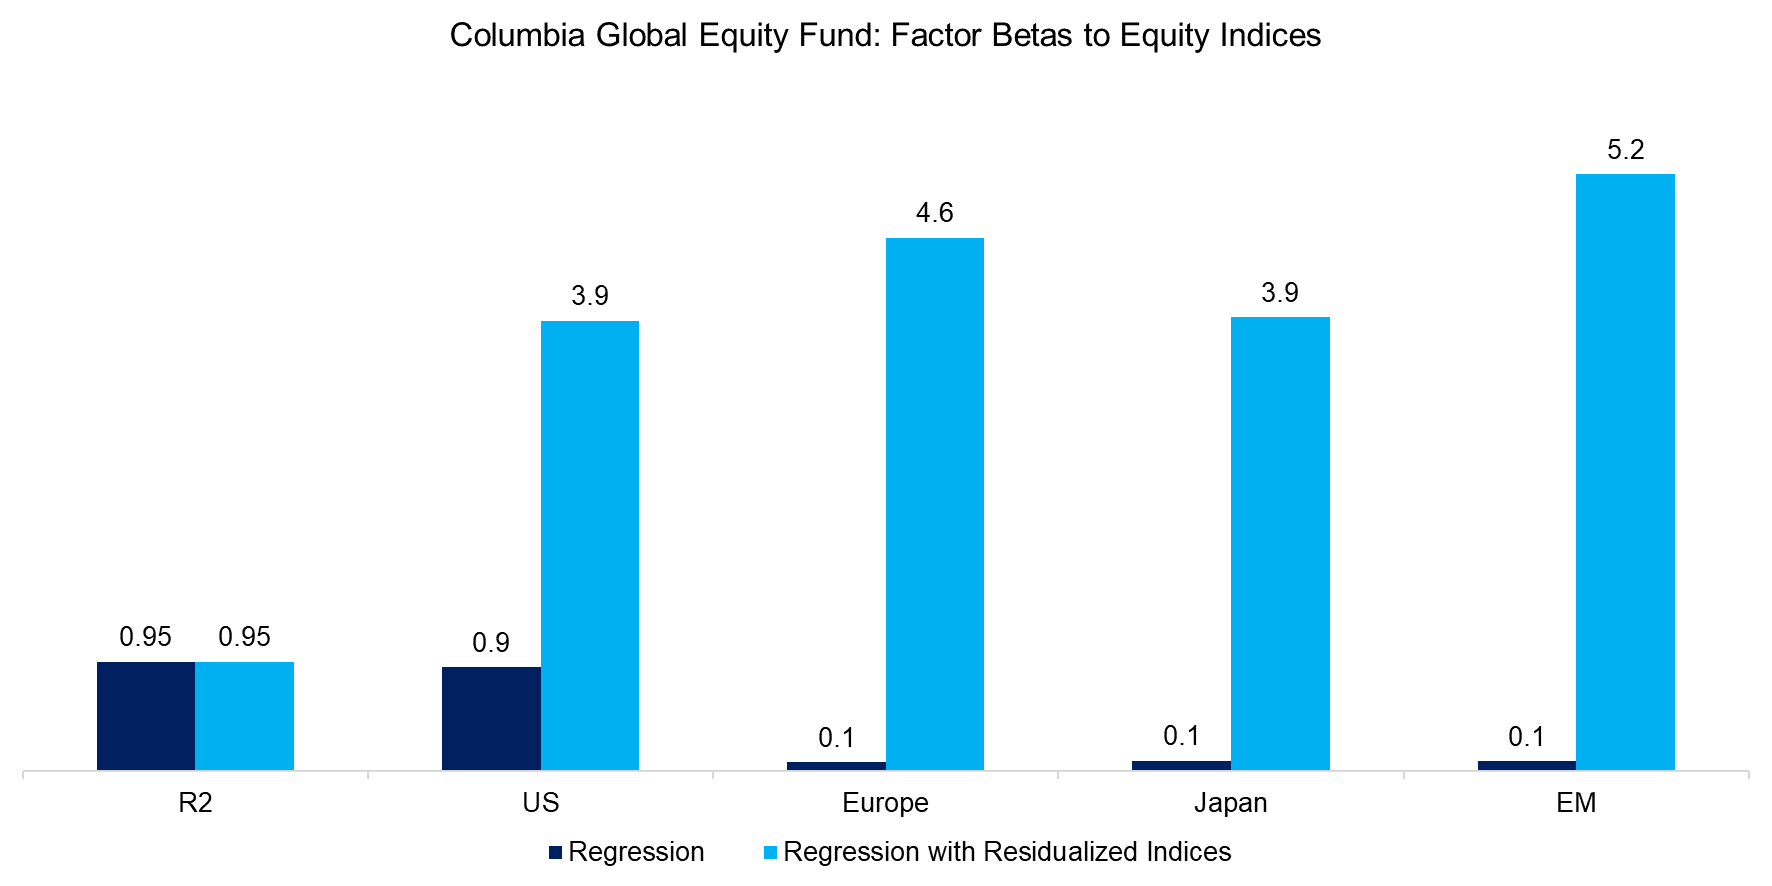
Using the standard and residualized equity indices in a regression analysis on CGEZX highlights an identical R2 of 0.95, but different factor betas. The standard indices show a high beta of 0.9 to the US and almost zero betas to the other stock markets, while the residualized indices all exhibit high betas.
Source: Finominal
RISK CONTRIBUTIONS
Factor betas themselves are not so easy to interpret as they are impacted significantly by the volatility of the underlying variables. For example, the residualized indices are less volatile than the standard indices, so the betas are significantly higher, which may be confusing.
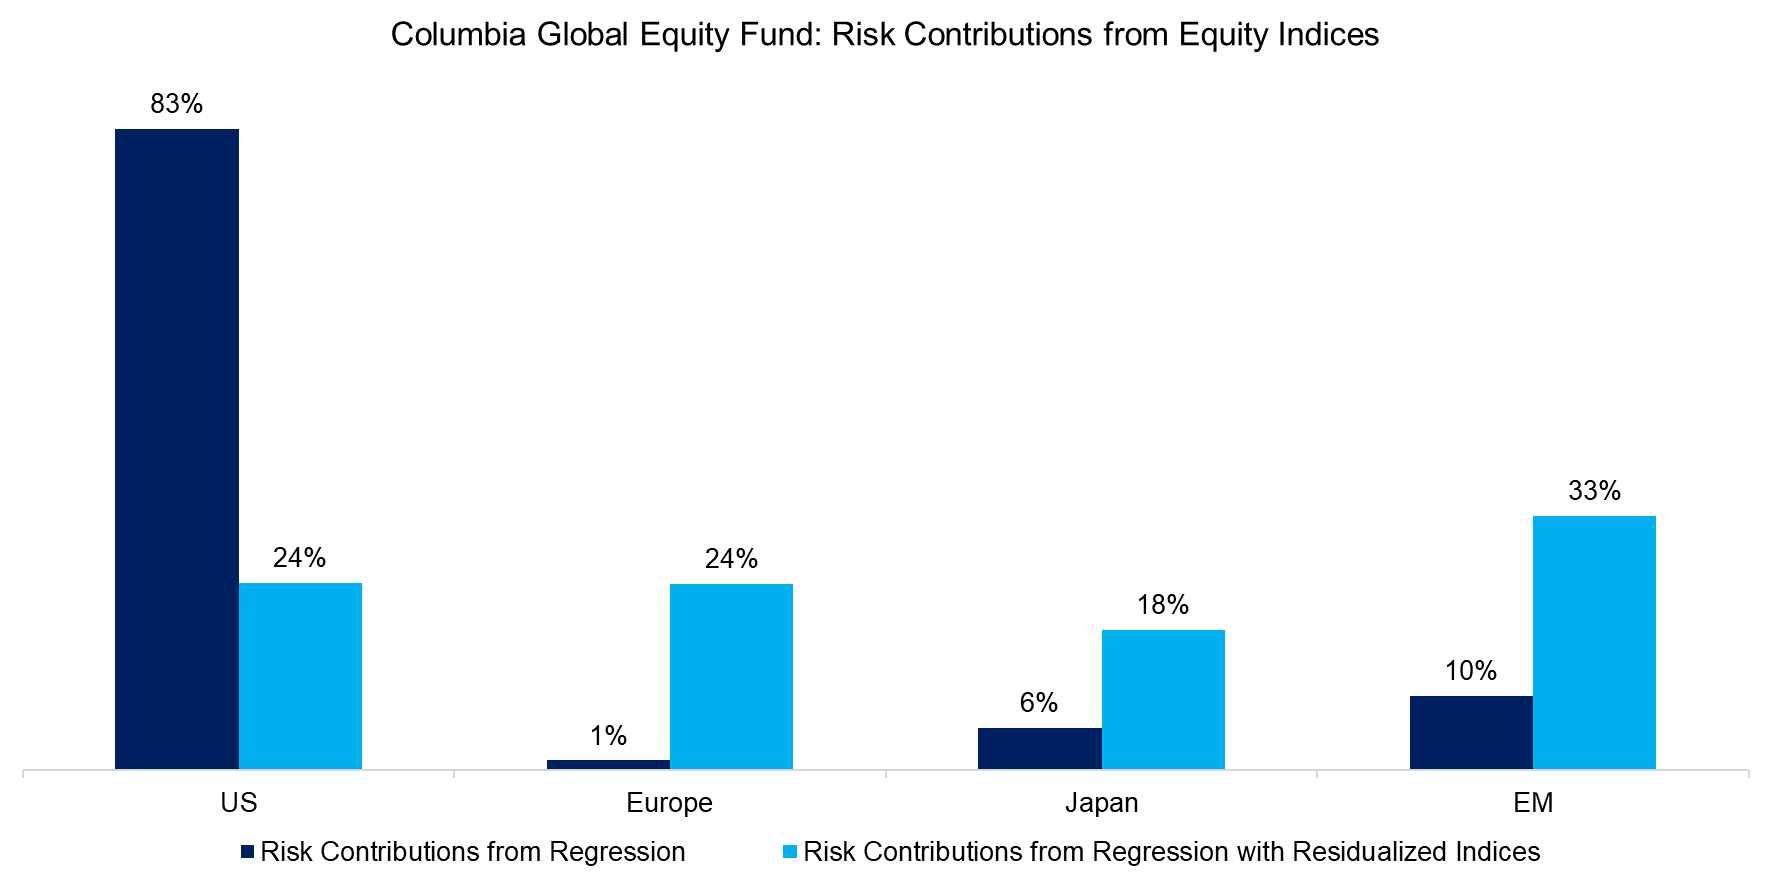
Given this, we calculate the risk contributions from the different geographies. Although this portrays the same perspective as the factor betas, the results are standardized and therefore easier to digest. The residualized indices suggest that CGEZX has exposure to all four regions, while the standard indices highlight primarily exposure to the US.
Source: Finominal
RISK CONTRIBUTIONS VS BREAKDOWN BY FUNDAMENTALS
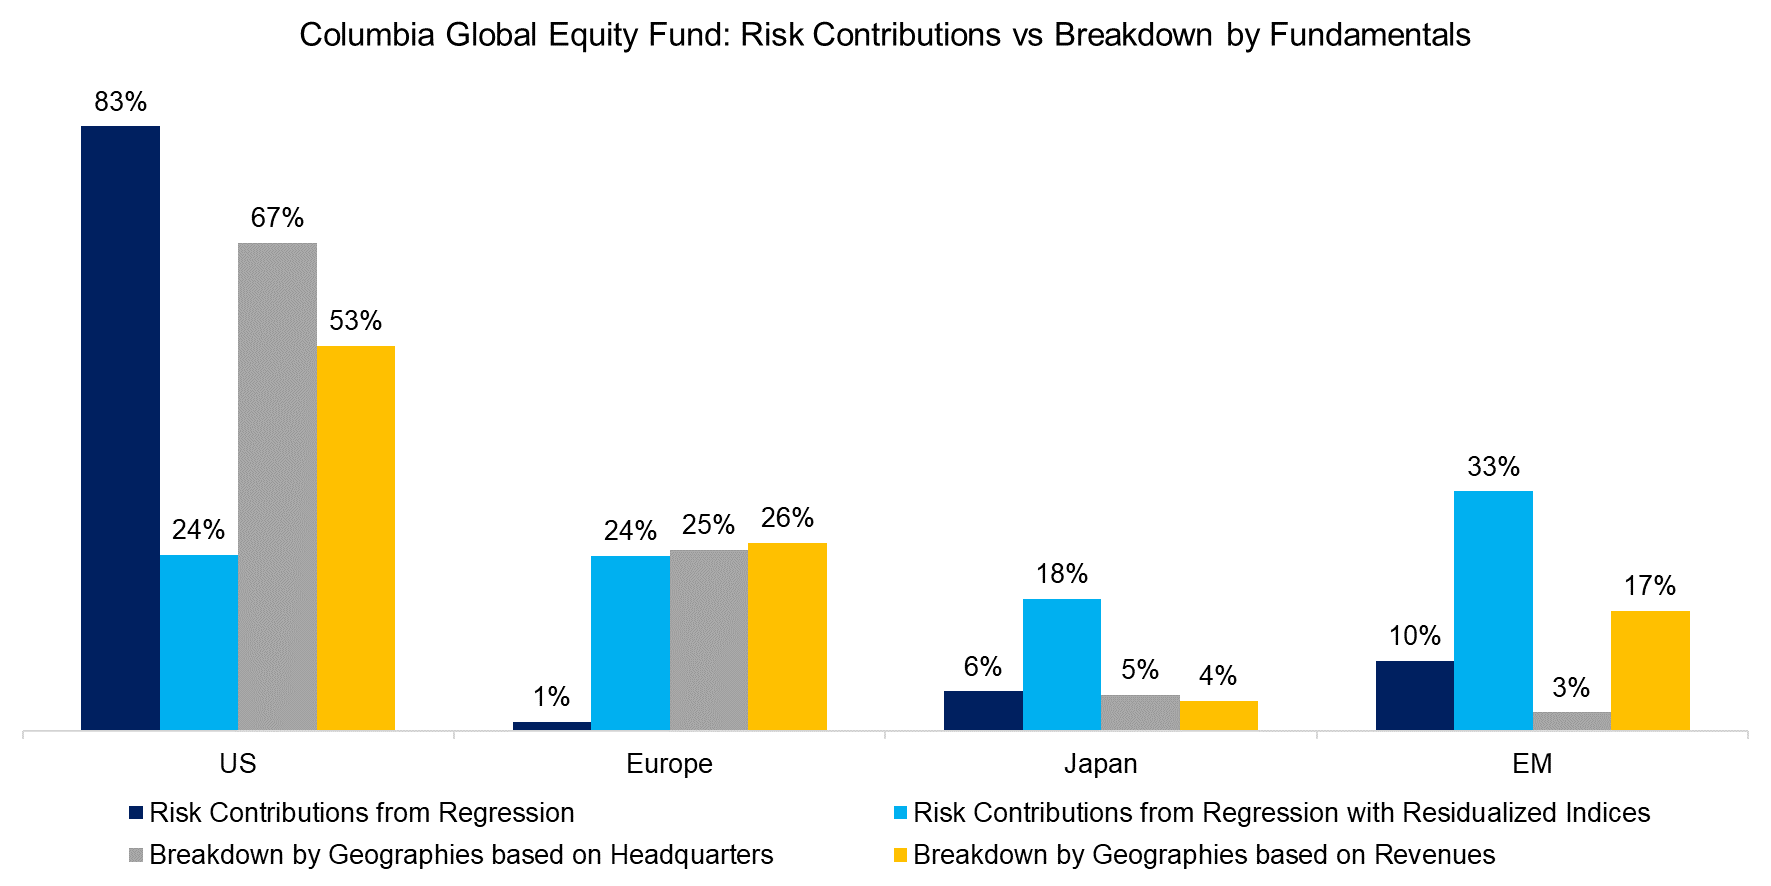
Next, we compare the breakdown of geographies from the regression analysis with fundamental data based on the headquarters and revenues of the constituents of CGEZX. We observe that using the residualized indices generates results that can not be reconciled with the fundamental data, so it seems residualizing equity indices for calculating the breakdown by geographies has little merit.
Using the standard indices generates a breakdown by assets in Japan and emerging markets that is comparable to the fundamental data, but there are significant differences in the US and Europe.
However, we do need to caveat that the fundamental data has flaws. There are many companies headquartered in low-tax domiciles like in Ireland, although they have little sales there. Using revenue data is also challenging as many companies do not provide a breakdown by geographies, eg only half of the 45 constituents of CGEZX publish such data.
Source: Finominal
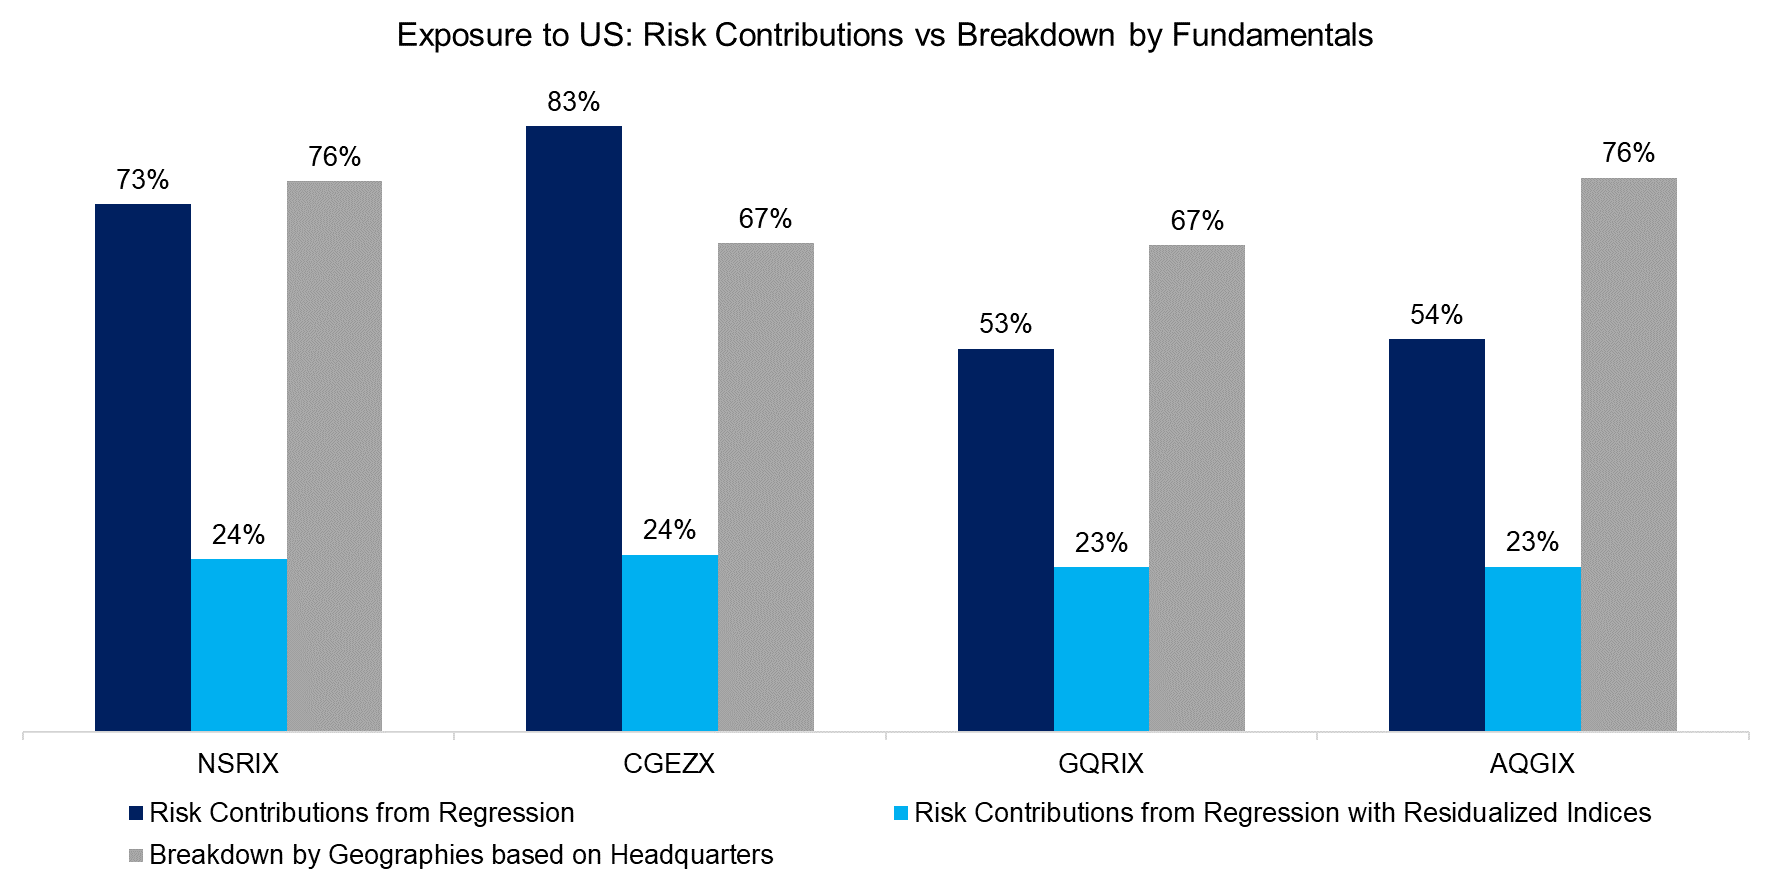
Finally, we expand the analysis to three further global equity mutual funds and rerun the analysis. Analyzing the exposure of the four global stock funds to the US confirms that residualized indices might not be so useful for measuring the exposure to geographies.
Using the standard indices in the regression roughly matches the exposure calculated using the location of the companies’ headquarters.
Source: Finominal
FURTHER THOUGHTS
Financial research tends to highlight strategies or methodologies that work as investors do not tend to be interested in what does not. However, what does not work is at least as important as it might help to prevent losses.
Evaluating the top-down and bottom-up approaches for measuring geographical exposure has highlighted flaws in both. Residualizing equity indices does not seem to provide meaningful results, but fundamental data is either not available or can be deceiving.
Perhaps a principal component or natural language processing analysis might provide better insights. Ultimately, investors need to understand the geographical exposure of their portfolios in order to avoid duplicate risk positions.
RELATED RESEARCH
Sector vs Factor-based Benchmark Selection
Mirror, Mirror, on the Wall, which is the Fairest Benchmark of All?
Factor Exposure Analysis 101: Linear vs Lasso Regression
Factor Exposure Analysis 103: Exploring Residualization
Time Machines for Investors
Factor Exposure Analysis 102: More or Less Independent Variables?
ABOUT THE AUTHOR
Nicolas Rabener is the CEO & Founder of Finominal, which empowers professional investors with data, technology, and research insights to improve their investment outcomes. Previously he created Jackdaw Capital, an award-winning quantitative hedge fund. Before that Nicolas worked at GIC and Citigroup in London and New York. Nicolas holds a Master of Finance from HHL Leipzig Graduate School of Management, is a CAIA charter holder, and enjoys endurance sports (Ironman & 100km Ultramarathon).
Connect with me on LinkedIn or X.

