Quality Factor: Zero Alpha for Most Investors?
Factor Construction Matters
September 2017. Reading Time: 10 Minutes. Author: Nicolas Rabener.
SUMMARY
- It’s difficult to rationalise why there should be excess returns from high quality stocks
- The Quality factor needs to be constructed beta-neutral to achieve positive returns
- Exposure to the Quality factor is an attractive hedge for an equity-centric portfolio
INTRODUCTION
The concept of investing into the Quality factor is an odd one as it’s difficult to rationalise why investors should get compensated for holding companies that are highly profitable and have solid balance sheets. Intuitively high quality stocks should be structurally expensive and the factor performance should be flat or negative, except in periods of financial crisis. It might be argued that high quality stocks outperform low quality stocks on a risk-adjusted basis, similar to the Low Volatility factor, which would require investors to manage their Quality portfolios beta-neutral. In this short note we’re going to analyse the difference between constructing the Quality factor $-neutral versus beta-neutral and the impact of adding either to an equity-centric portfolio (read Factor Construction: Beta vs $-Neutrality).
METHODOLOGY
We’re going to focus on the Quality factor in the US and Global ex-US, which includes all developed markets in Europe and Asia. We define Quality as a combination of debt-to-equity and return-on-equity, i.e. reflecting balance sheet strength and profitability. The factor is constructed as a long-short portfolio by taking the top and bottom 10% of the stock universes. Only companies with a minimum market capitalization of $1bn are considered and 10bps of transaction costs are included (read Quality Factor: How To Define It?).
The $-neutral portfolio is model-free as the long portfolio receives the same allocation in $-terms as the short portfolio, e.g. $100 each. For the avoidance of doubt, $ simply refers to a unit of currency and not to the US$. The beta-neutral portfolio is constructed by increasing the weights of stocks which have a one-year beta to the local index of below 1 and decreasing the weights of stocks with a beta above 1, i.e. as a result the long and short portfolios will both have a beta of 1.
QUALITY FACTOR (LONG / SHORT) IN THE US
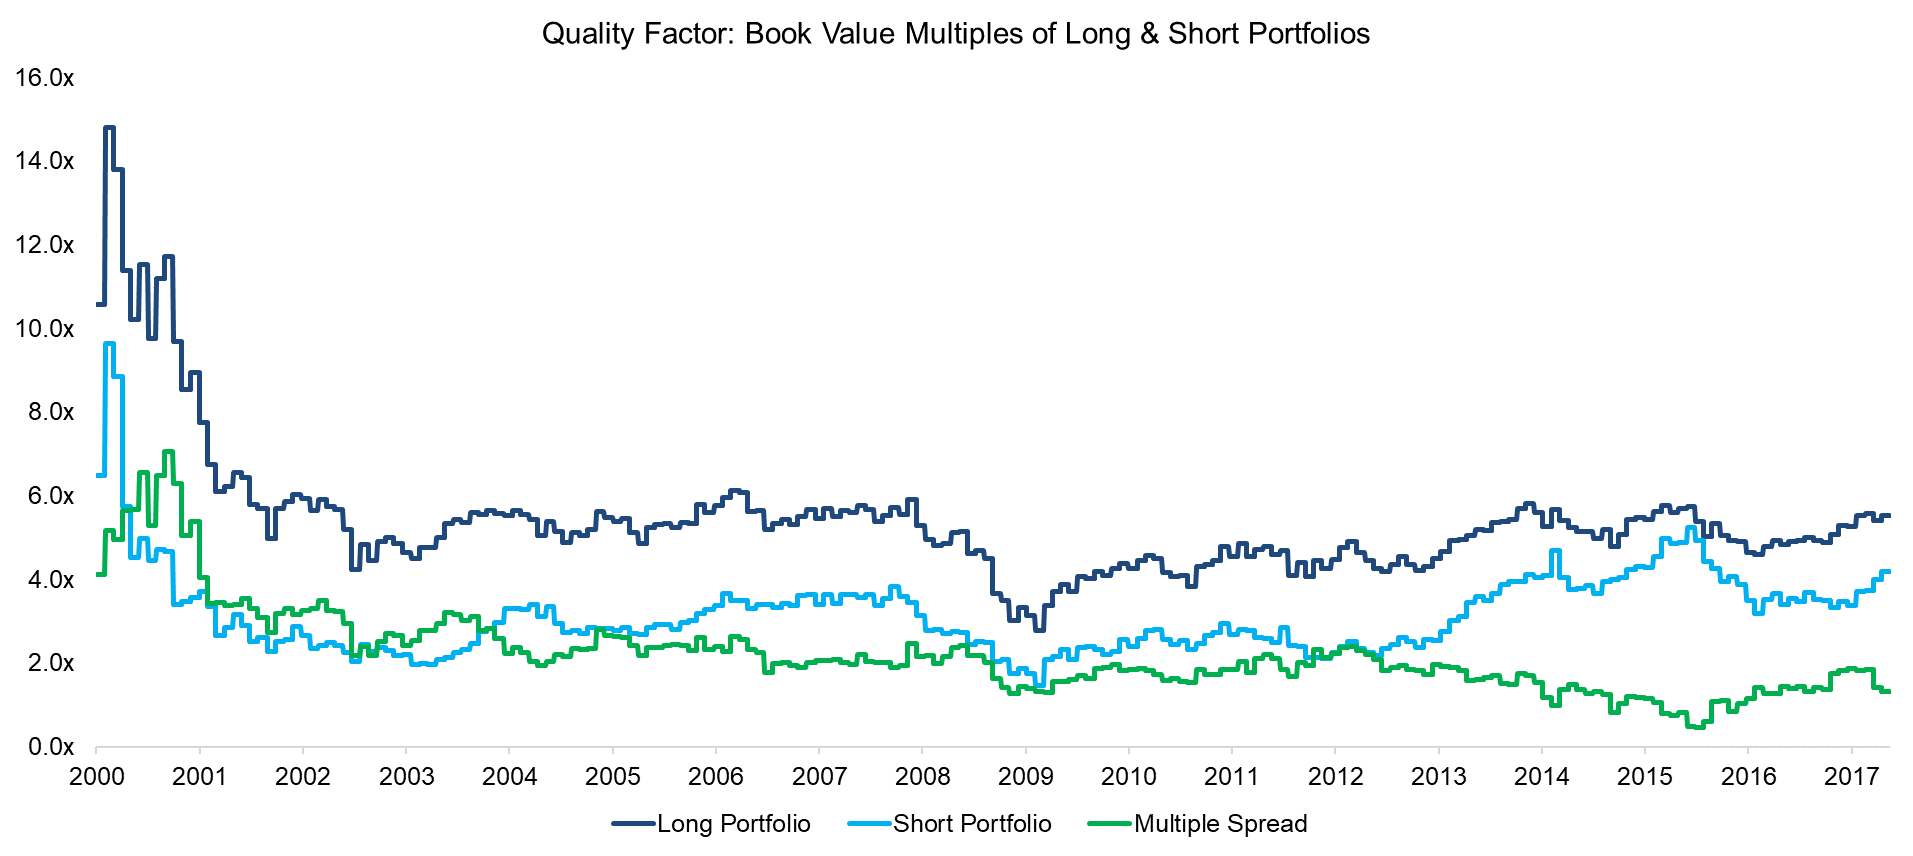
Companies that have little debt and high profit margins should be trading at a premium on stock markets, which we can see reflected in the chart below. The long portfolio of the Quality factor traded structurally at higher book value multiples than the short portfolio. The multiple spread between both portfolios is one way of evaluating the attractiveness of the factor and currently indicates that the factor is slightly cheap compared to its historical average. It’s worth highlighting that the Tech bubble around 2000 had a significant impact on the time series as valuations went to extremes.
Source: FactorResearch
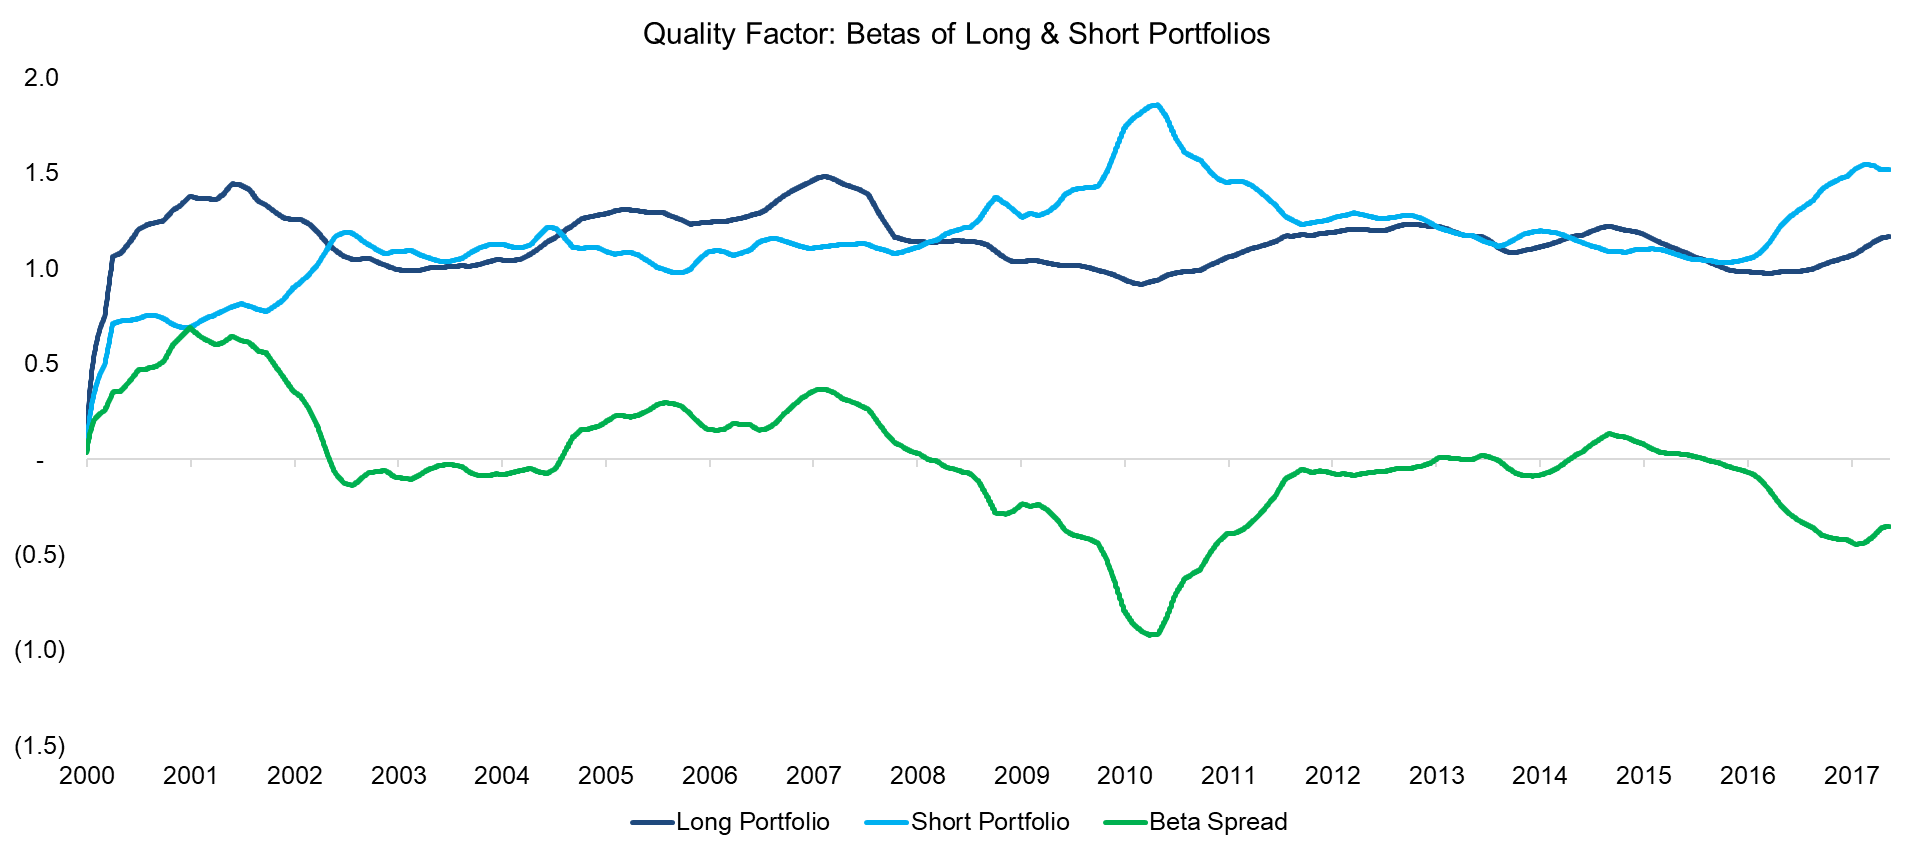
The next chart shows the betas of the long and short portfolios and we can observe that on average high quality stocks have lower betas than low quality stocks, which is expected as safe companies should be less volatile than risky companies. The beta spread tends to become quite negative in periods of crisis, e.g. in 2009.
Source: FactorResearch
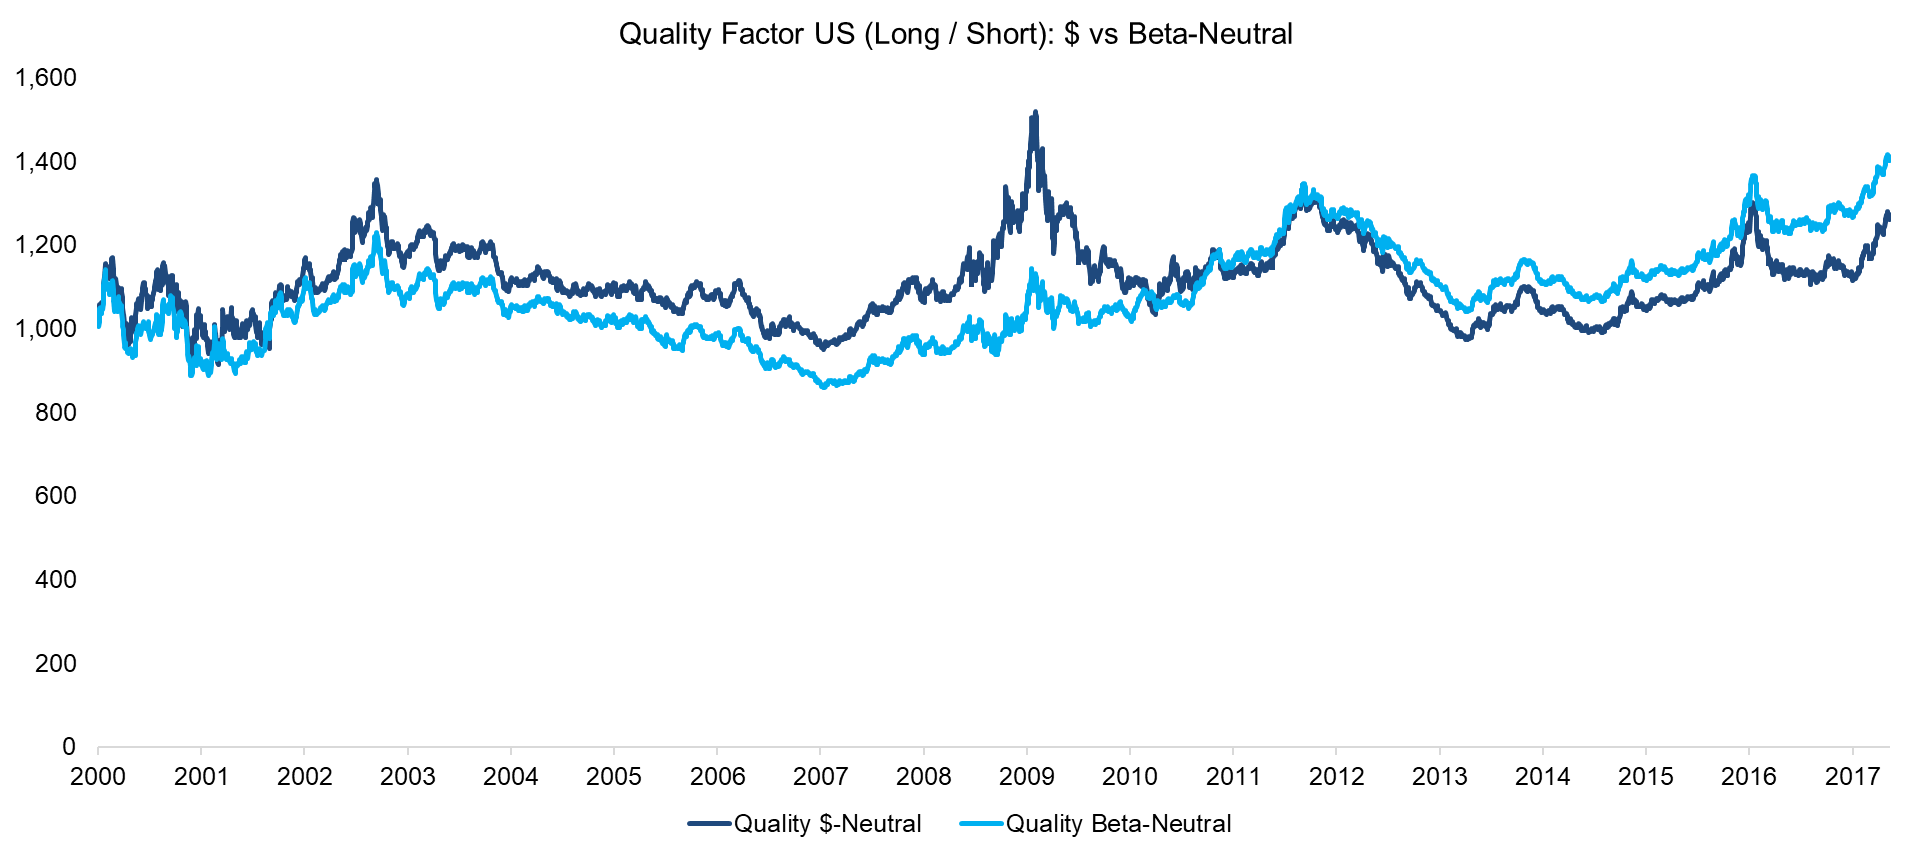
The performance of the Quality factor in the US from 2000 to 2017 was barely positive, which would be inline with our thinking that it’s difficult to ratonalise why investors should get compensated for holding high quality stocks. We can also observe that in the US there was no significant difference between the $ and beta-neutral portfolios, except for the Global Financial Crisis, where the $-neutral portfolio acted as a good hedge for an equity-centric portfolio, which can be explained by the significant negative net beta position at that time, i.e. effectively a short position on the market.
Source: FactorResearch
QUALITY FACTOR (LONG / SHORT) GLOBAL EX-US
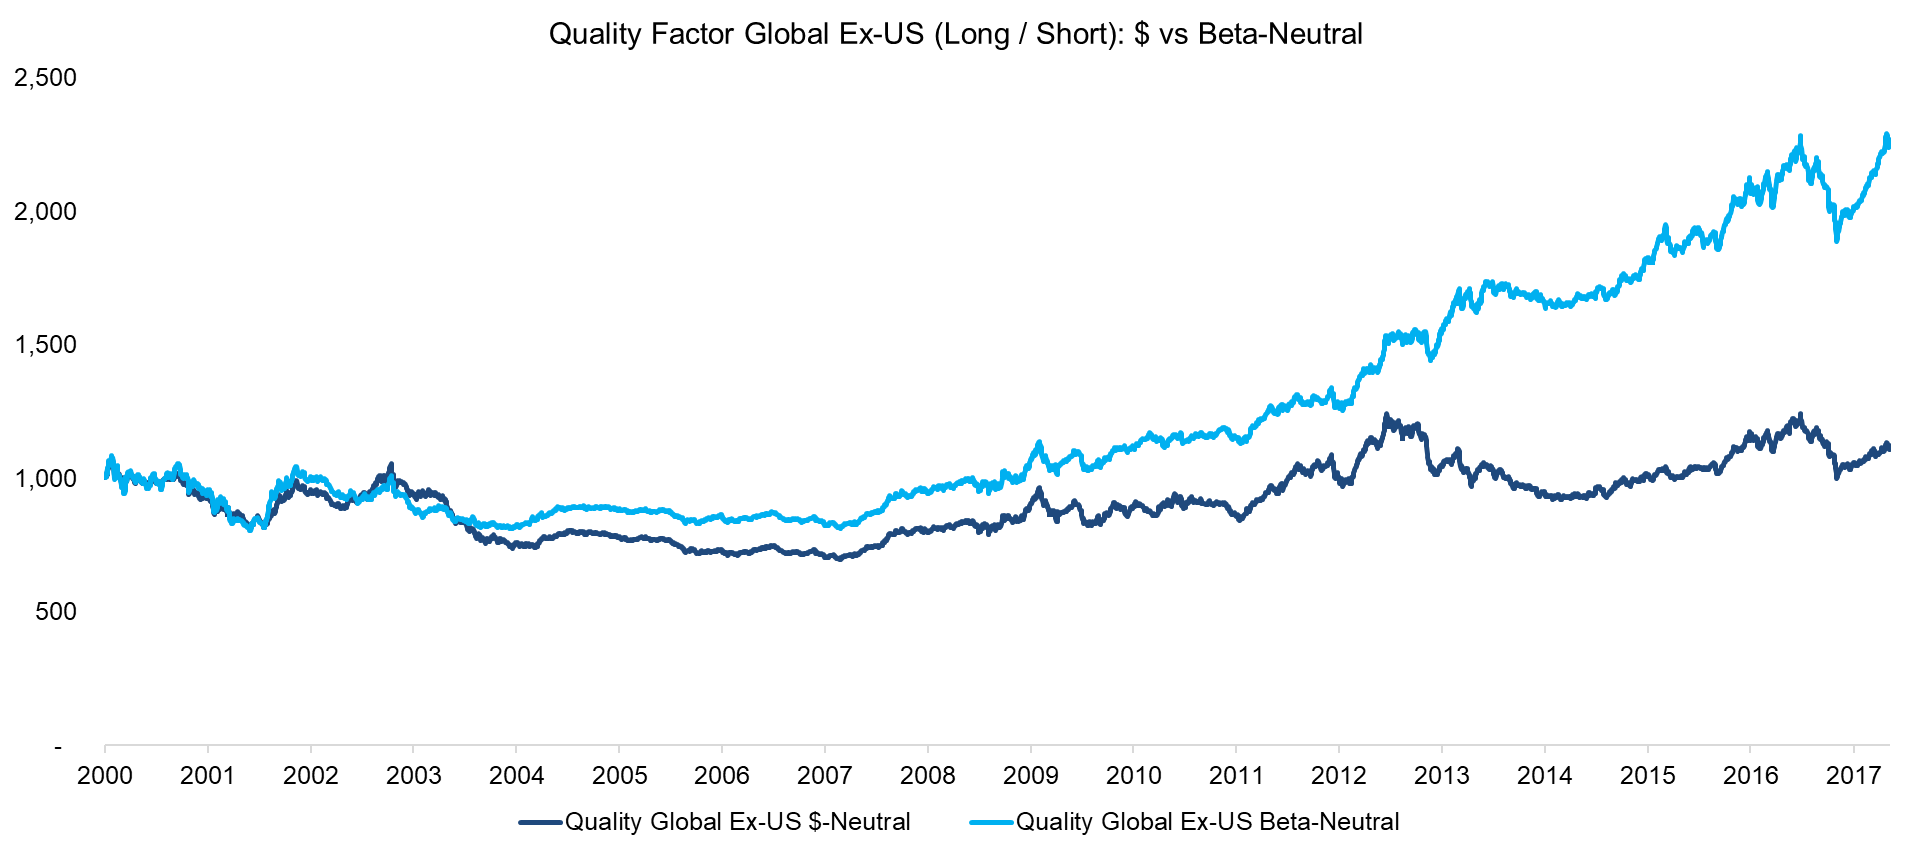
The $-neutral Quality factor Global Ex-US generated almost zero returns from 2000 to 2017, but would have moderately offset the steep losses on equity market declines during the Global Financial Crisis. Interestingly the beta-neutral portfolio exhibits a steady positive performance over time, indicating that on a risk-adjusted basis high quality stocks outperform low quality stocks. If we would look at the individual countries, we would see this confirmed consistently across markets.
However, for investors to harvest these attractive returns, it implies that portfolio managers need to beta-adjust their positions and product provider to ensure the beta-neutrality of their factor products. Surveying some Quality smart beta ETFs we can find little evidence for this, which likely means low to zero excess returns from these products.
Source: FactorResearch
QUALITY FACTOR (LONG / SHORT) US VS S&P 500
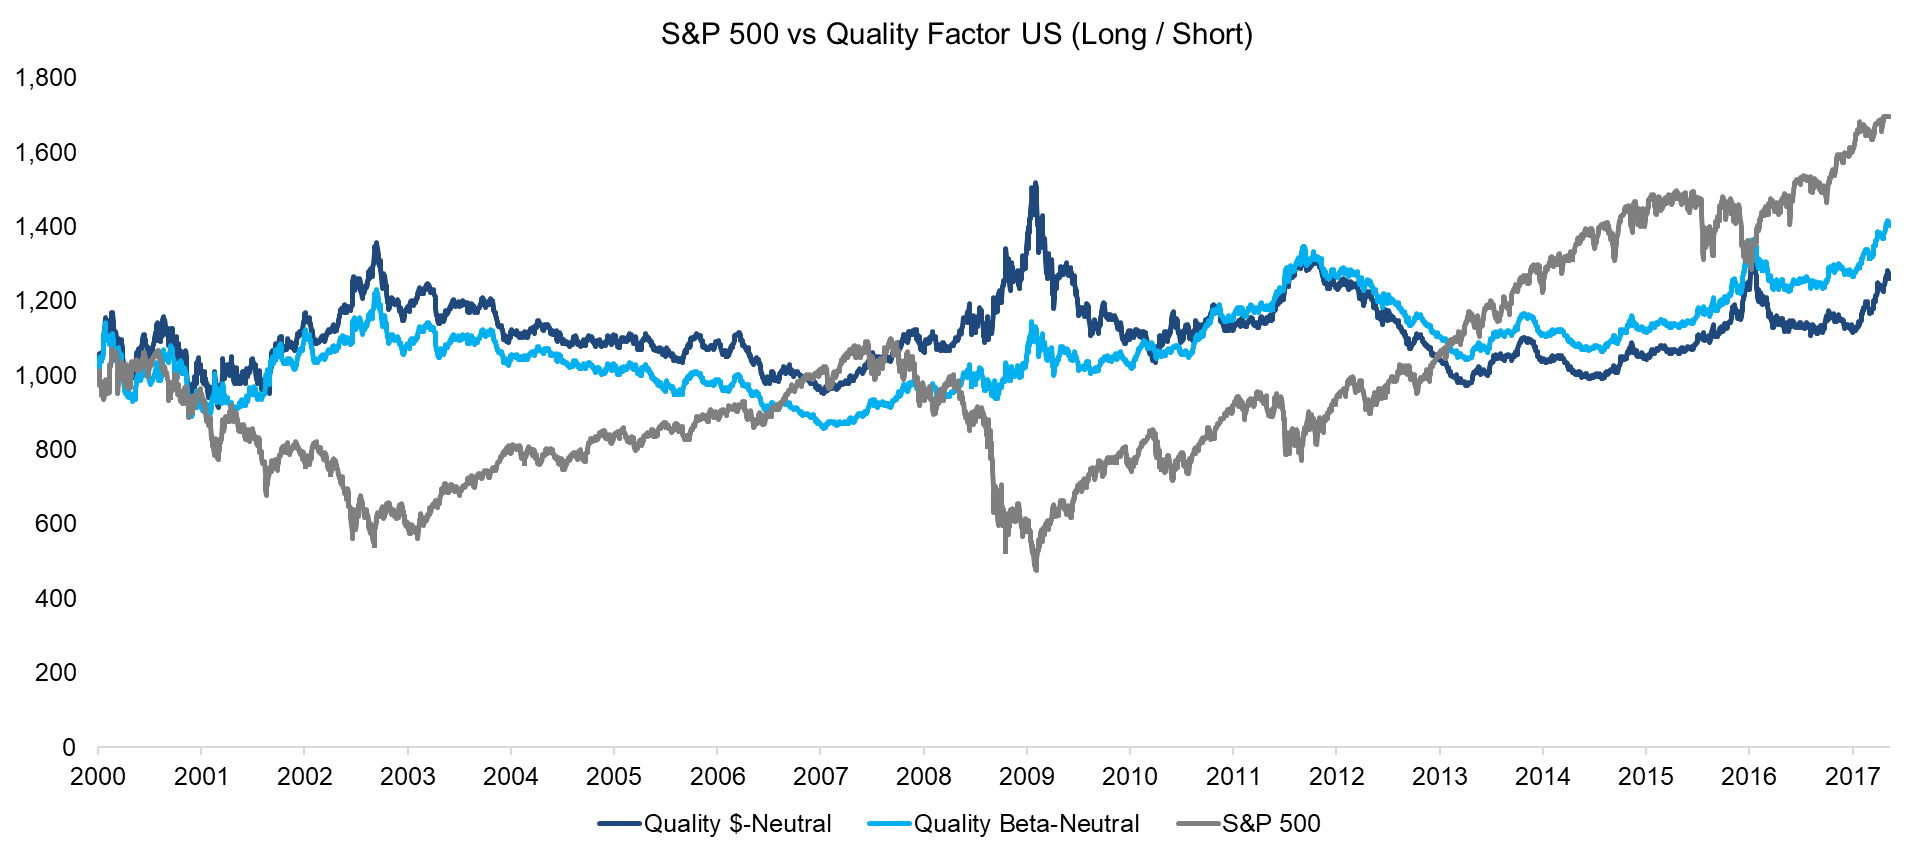
The Quality factor in the US, either $ or beta-neutral, has a correlation of close to zero to the S&P 500 and is therefore interesting from a diversification perspective. The chart below shows that the factor behaved almost like a perfect hedge to the S& 500, e.g. in 2009, throughout the observation period. Over the last year the factor increases significantly, which can be explained the strong performance of the Tech sector, which features companies with low debt and high profitability.
Source: FactorResearch
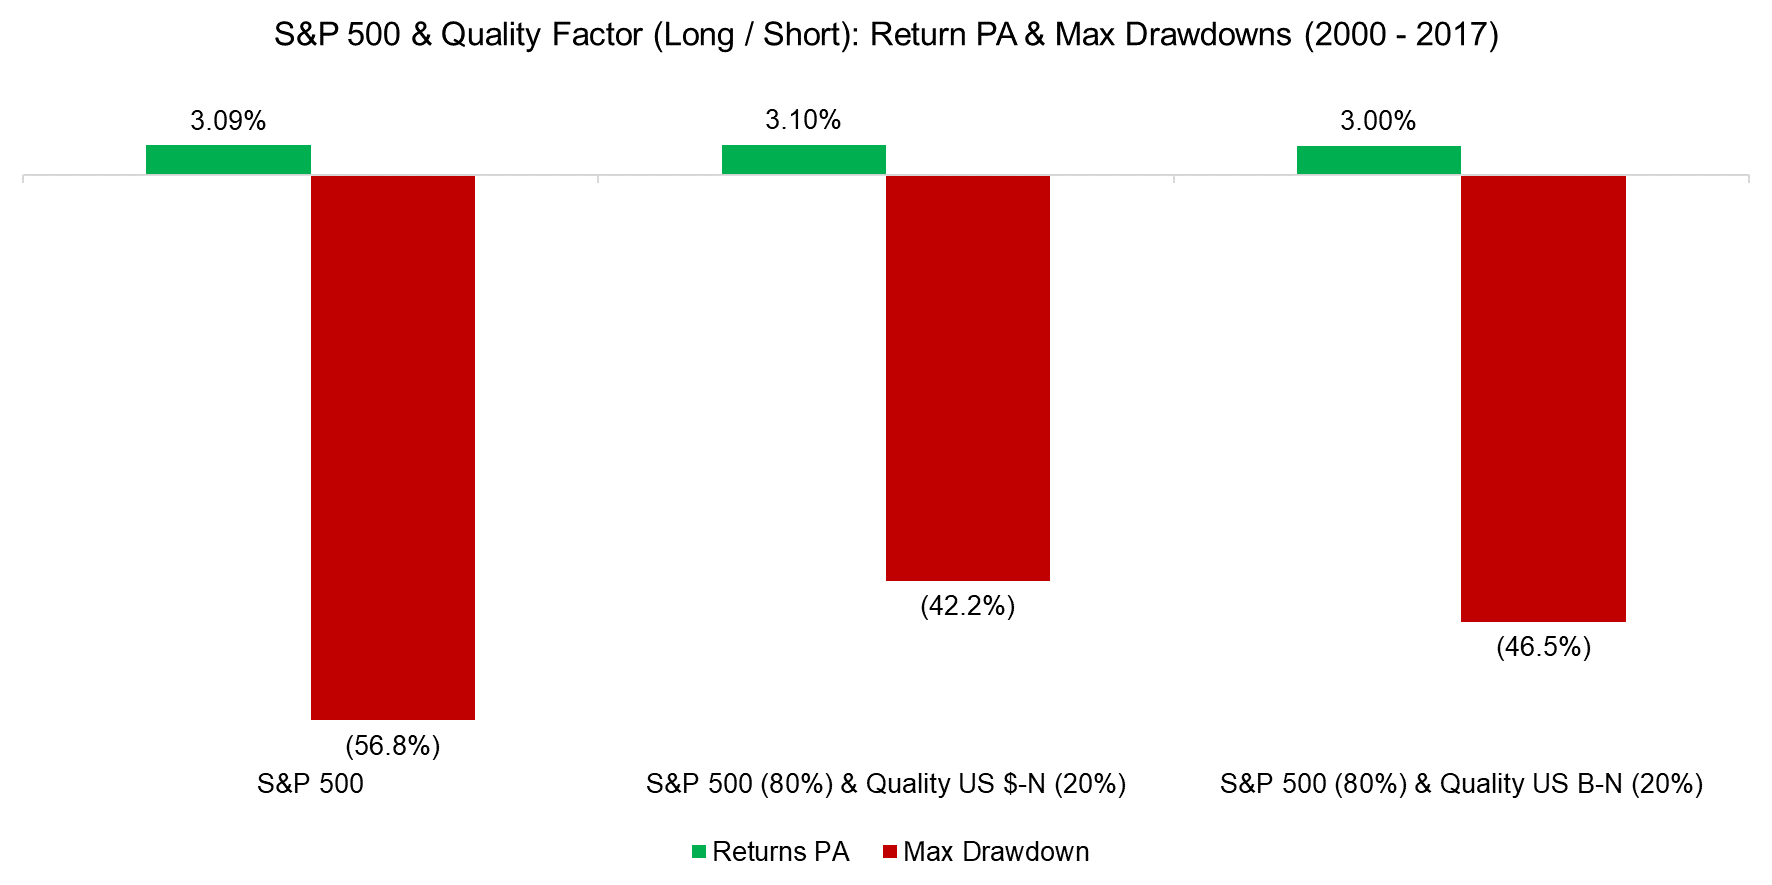
Investors concerned with the dismal outlook for returns created by high valuations, record levels of debt, and poor demographics might want to consider adding exposure to the Quality factor for portfolio diversification. If an investor would have had a 20% allocation to the factor in an equity-centric portfolio since 2000 and rebalanced annually, then the maximum drawdown of the portfolio would have reduced from 57% to 42% and 46% respectively, with almost no meaningful reduction in total return.
Source: FactorResearch
FURTHER THOUGHTS
This short research note highlights that the returns from the Quality factor are only attractive on a risk-adjusted basis, which implies investors need to construct their portfolios beta-neutral. Despite equity markets and the factor performing strongly over the last 12 months, the correlation remains almost zero and Quality factor exposure still represents an attractive diversification opportunity for an equity-centric portfolio.
ABOUT THE AUTHOR
Nicolas Rabener is the CEO & Founder of Finominal, which empowers professional investors with data, technology, and research insights to improve their investment outcomes. Previously he created Jackdaw Capital, an award-winning quantitative hedge fund. Before that Nicolas worked at GIC and Citigroup in London and New York. Nicolas holds a Master of Finance from HHL Leipzig Graduate School of Management, is a CAIA charter holder, and enjoys endurance sports (Ironman & 100km Ultramarathon).
Connect with me on LinkedIn or X.

