Smart Beta Fixed Income ETFs
Better than their Benchmarks?
April 2020. Reading Time: 10 Minutes. Author: Nicolas Rabener.
SUMMARY
- Factor investing in fixed income has been heralded as the next frontier in asset management
- Smart beta fixed income ETFs in the US manage only slightly more than $2 billion of assets
- Defensive strategies reduced drawdowns during the ongoing coronavirus crisis
INTRODUCTION
Investing is becoming more scientific over time as technology continues to advance, but it will never be a hard science like physics. Take factor investing for example. Academic research, powered by ever-growing sets of data and better analytical tools, has shown that excess returns are explained by factors like Value or Momentum.
However, if a scientist starts querying on how these factors, e.g. Value, are defined, matters become complicated. The most common definition in academic research for determining the valuation of a stock is the price-to-book ratio. In contrast, cheap stocks are more likely measured by PE, EV/EBITDA, or cashflow multiples in practitioners’ research and actual investment products. Furthermore, these metrics can be combined, measured over various time periods, rebalanced frequently or infrequently, overall highlighting a high level of discretion and subjectivity.
In this context, it is interesting to highlight that factor investing is far more popular in equities than fixed income, despite the latter being a much more mathematical and perhaps scientific discipline. Investors have allocated more than $800 billion to smart beta equity ETFs in the US, compared with only approximately $2 billion to equivalent vehicles in fixed income.
The bulk of research focuses on factors in the global equity market, but papers like “Investing with Style” and “Value and Momentum Everywhere” from Cliff Asness and his colleagues at AQR have laid the theoretical foundation for factor investing in fixed income. In fact, AQR has heralded fixed income as the next frontier in factor investing in 2016.
In this short research note, we will explore the performance and characteristics of smart beta fixed income ETFs in the US.
DEFINING THE SMART BETA FIXED INCOME ETF UNIVERSE
Indices can be differentiated between providing exposure to plain, different, and smart beta. Plain beta represents the well-known indices like the JP Morgan Emerging Market Bond Index and constituents are typically weighted by the most indebted countries or companies. Different beta weights index constituents equally or by fundamental metrics like sales for corporate issuers. Smart beta indices are based on factors where research indicates excess returns over time, which are either incorporated by weighting constituents directly by these or having tilts toward them.
The factors with the strongest empirical backing in equities are Value, Size, Momentum, Quality, and Low Volatility. In fixed income and other asset classes, there is slightly less consensus, but Value, Momentum, and Quality appear most frequently in research. Carry can be seen as similar or different to Value, depending on the asset class, and Low Volatility is often viewed as a component of Quality (read Equity vs Bond Indices).
We define our universe of smart beta fixed income ETFs as strategies that provide exposure to one of these established factors or combine them in a multi-factor approach in all US investment-grade bonds, US corporate bonds, and US high yield bonds. The resulting universe comprises only 12 ETFs, so this analysis should be viewed with caution given the small sample size.
COMPARING SMART BETA FIXED INCOME YIELDS
Analyzing smart beta ETFs in fixed income is more complicated than in equities as bonds are more complex instruments than stocks and factor definitions are less homogeneous.
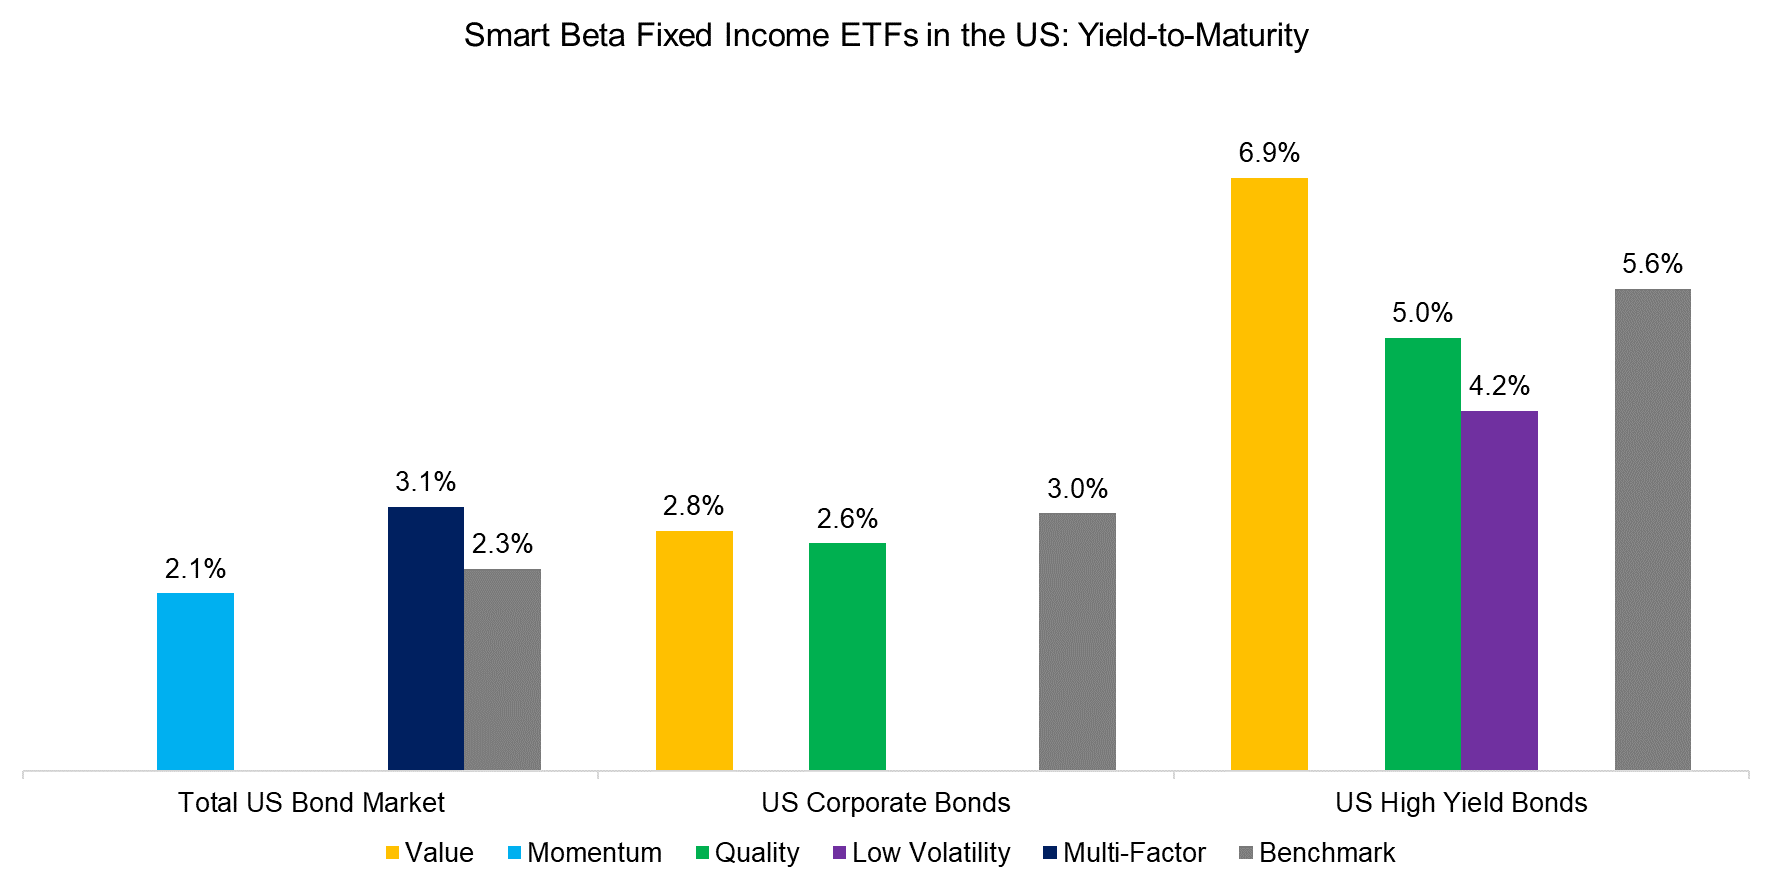
We compare the yield-to-maturities of the smart beta ETFs to investigate if they are roughly in line with expectations. Given the limited universe of ETFs, only a few factor tilts are available for each of the different segments of the US fixed income market. We observe the following:
- Total US Bond Market: The yield-to-maturity of the Multi-factor ETF is significantly higher than that of the benchmark, which is explained by the product weighting bonds by factors and not by size. The different weighting scheme results in a larger exposure to higher-yielding industrial and financial issuers.
- US Corporate Bonds: Somewhat unusual, Value has a lower yield than the benchmark, which is likely explained by the ETF having a large tilt toward cheap bonds, but also a minor one to Quality, so it could alternatively be labeled as a multi-factor approach.
- US High Yield Bonds: Value results in a higher yield while Quality and Low Volatility portfolios are comprised of less risky bonds and therefore feature lower yields.
Source: FactorResearch
TOTAL US BOND MARKET
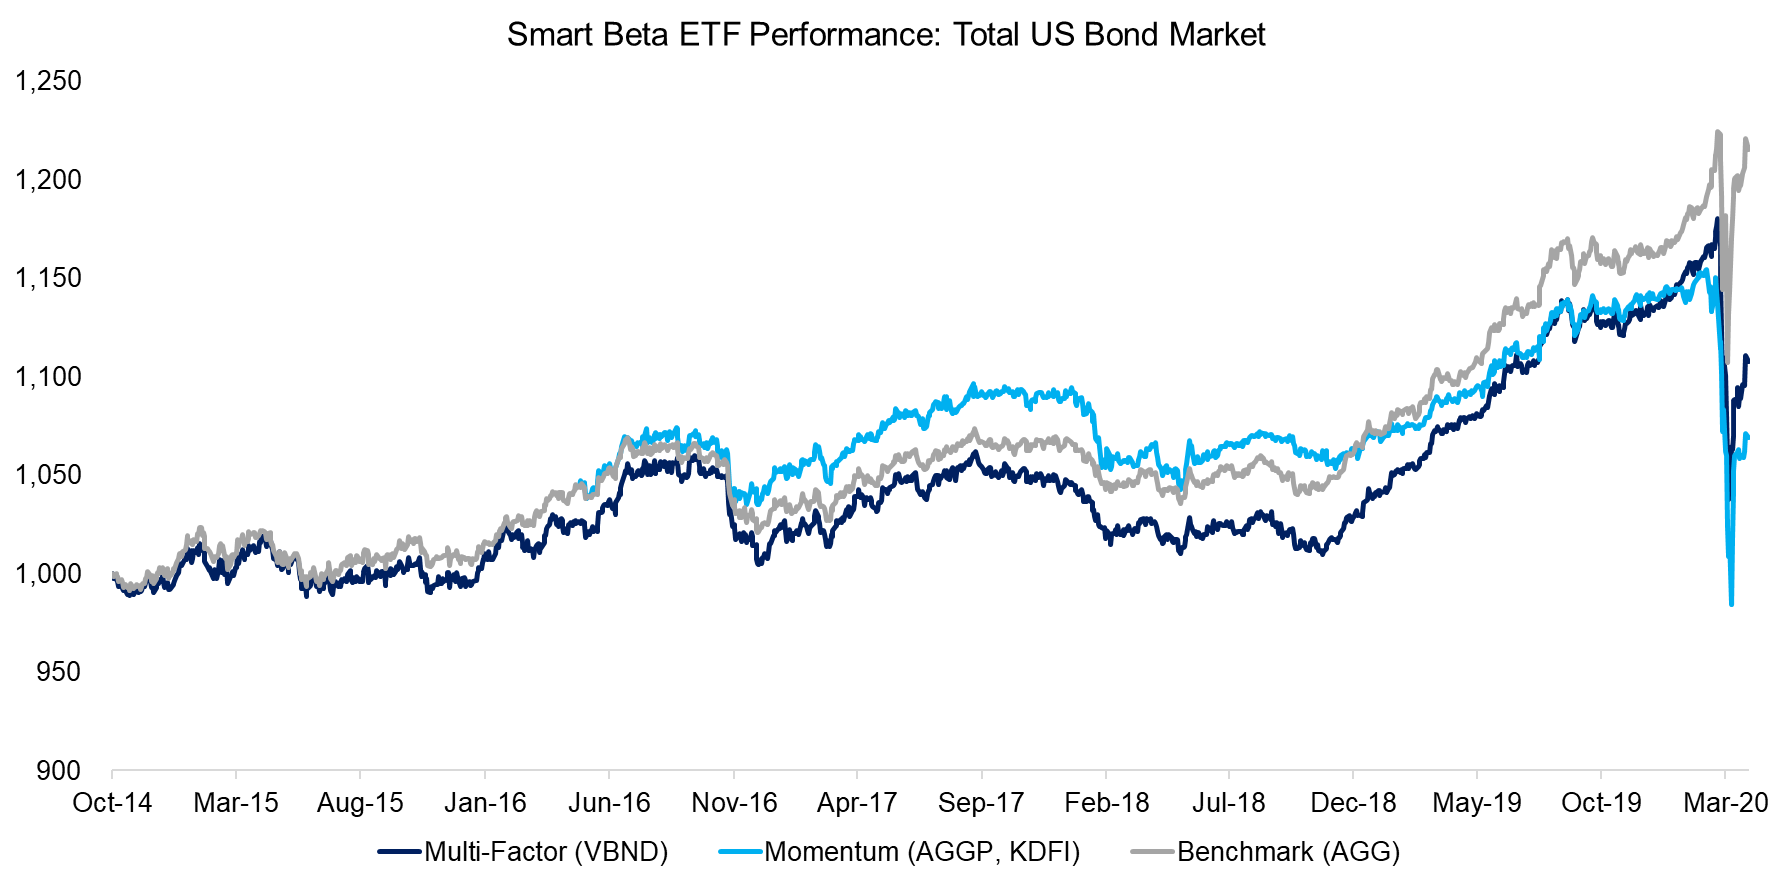
Investors can buy plain beta exposure to the total investment-grade US bond market for as little as 4 basis points (bps), or pay between 33 and 46 bps for smart beta ETFs. The bond market appreciated slowly between 2014 and 2019, but experienced a crash along with most asset classes during the coronavirus crisis in early 2020.
It is interesting to note that the benchmark index, which is the equivalent of the Bloomberg Barclays Aggregate Bond index, recovered most of the year-to-date loss, while the Multi-factor, as well as the Momentum smart beta ETFs, are still significantly negative.
Source: FactorResearch
US CORPORATE BONDS
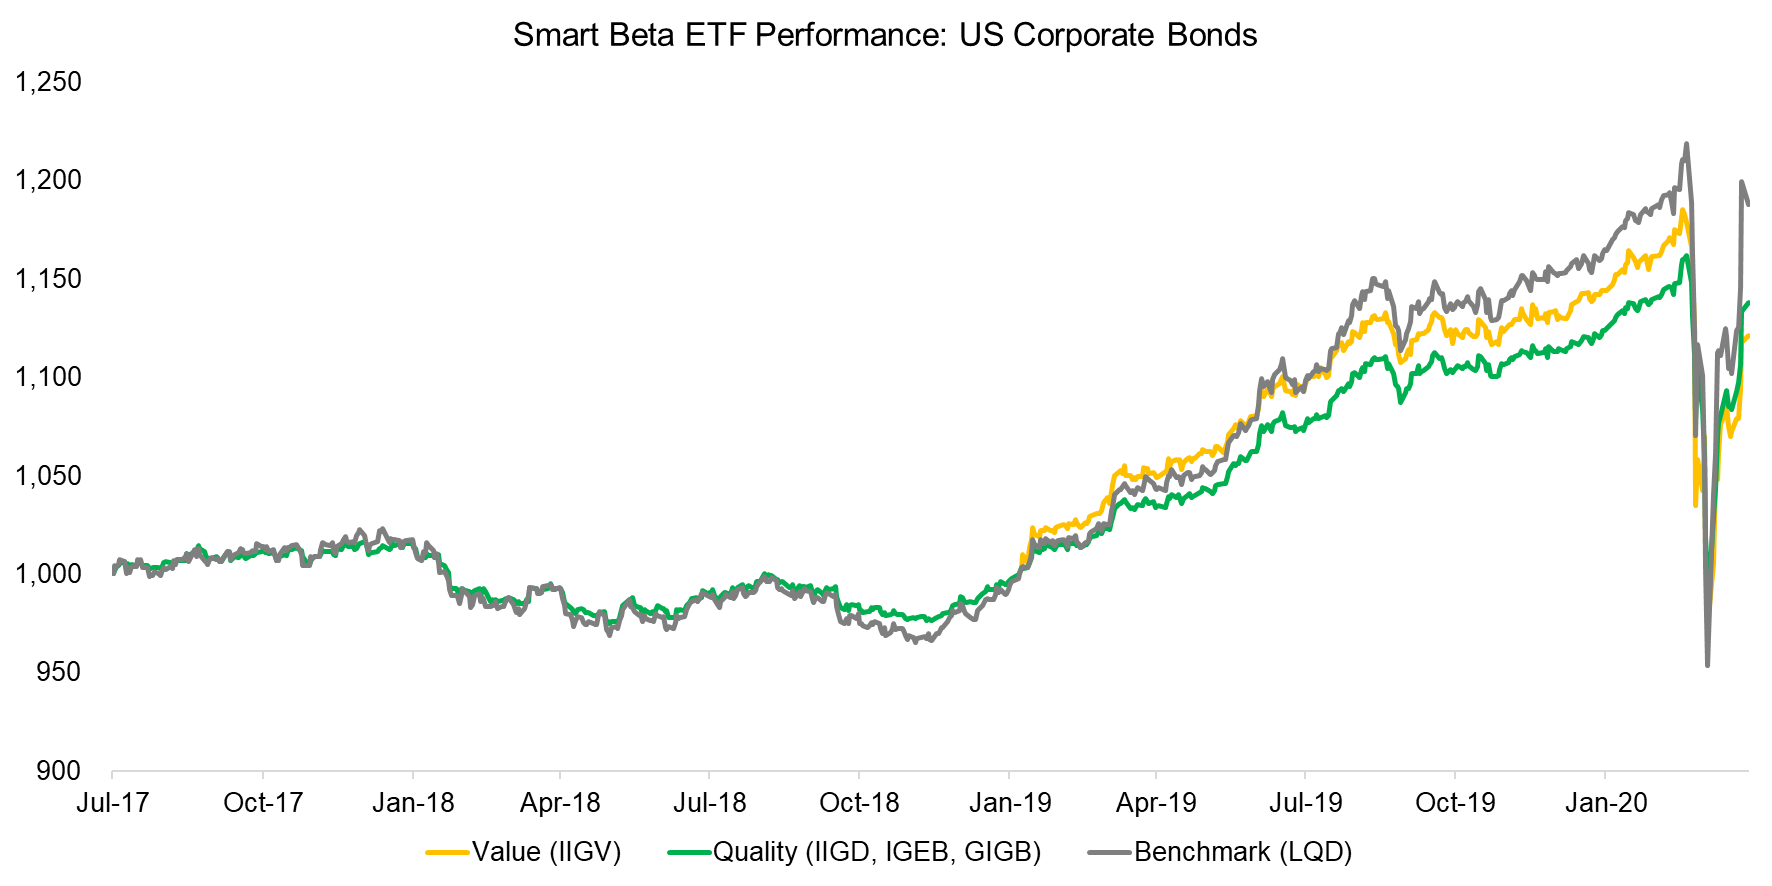
In contrast to the total US bond market, smart beta products for US corporate bonds are priced as cheaply as plain beta products at approximately 15 bps, which diminishes the risk of underperformance due to higher fees.
We observe that Value and Quality products underperformed their benchmark since the beginning of 2019, which is surprising given that both factors tend to be negatively correlated. However, the Value ETF, despite the product featuring “Value” in its name, also incorporates metrics like credit ratings and duration and does not represent a pure-play on cheap bonds.
Source: FactorResearch
US HIGH YIELD BONDS
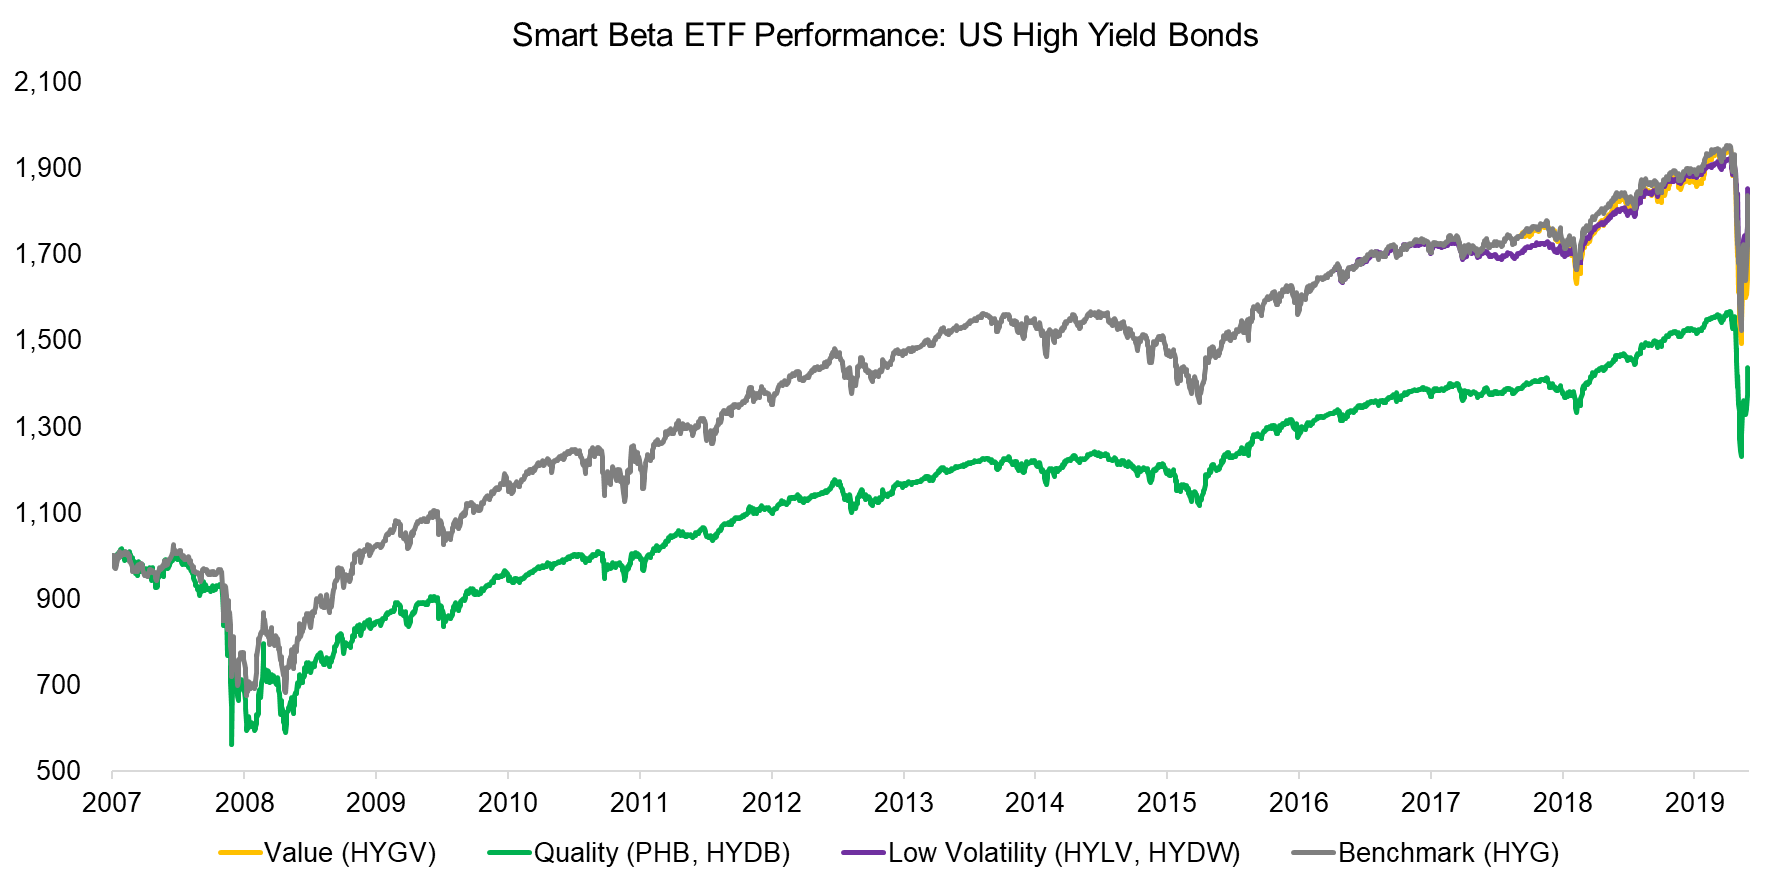
The US high yield bond market offers investors more factors than other fixed income market segments, but it is still only three strategies. One of the Quality ETFs was launched in 2007 and therefore offers a long track record for analysis. Likely unexpected by investors, the Quality strategy led to a larger maximum drawdown during the global financial crisis in 2008 to 2009 and a significantly lower return than the benchmark over the last 12 years. The Low Volatility and Value ETFs were launched in the last couple of years and performance has been similar to that of the benchmark.
It is worth highlighting that some of the smart beta ETFs in US high yield bonds have expense ratios of only 20 bps, which is below what some of the well-known benchmark ETFs charge and should increase their appeal to investors.
Source: FactorResearch
RISK PROFILE OF SMART BETA FIXED INCOME ETFS
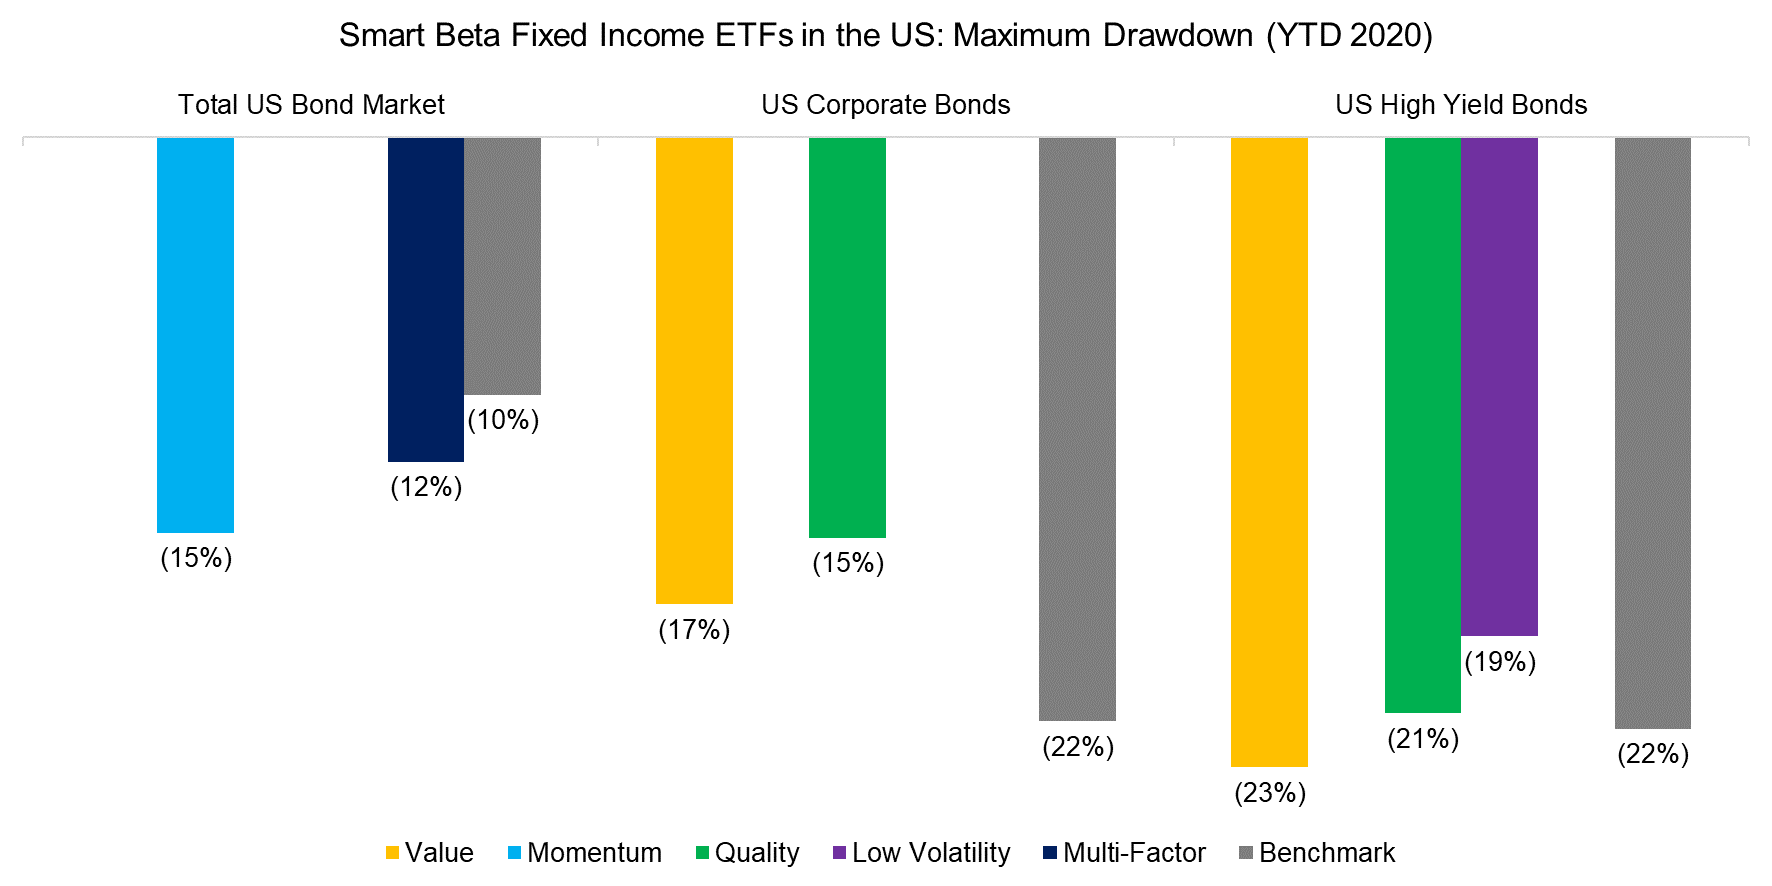
This analysis has focused on returns, but some factors are specifically used for risk reduction. We, therefore, calculate the maximum drawdowns reached during the ongoing coronavirus crisis in 2020, where investors would have expected Quality and Low Volatility smart beta ETFs to outperform. The following observations:
- Total US Bond Market: There are no purely defensive products, but the Multi-factor ETF incorporates metrics such as creditworthiness and default probability when selecting bonds. Despite these features, the ETF experienced a larger maximum drawdown in the current crisis than the benchmark.
- US Corporate Bonds: The Quality ETFs had a significantly lower maximum drawdown than the benchmark, highlighting defensive fixed income portfolios.
- US High Yield Bonds: The maximum drawdown of the Quality ETFs was similar to that of the benchmark, which likely disappointed investors. In contrast, Low Volatility strategies reduced risk.
Some factors like Value or Momentum should allow investors to outperform benchmarks over time while others like Quality or Low Volatility offer better risk-adjusted returns and reduced drawdowns. The former is not apparent from these results, but the latter was validated in the current crisis given that defensive smart beta strategies were less risky than their benchmarks on average (read Low Vol Factor: From Obscurity to Stardom).
Source: FactorResearch.
FURTHER THOUGHTS
Is there a strong case for investors to pursue fixed income investing via smart beta ETFs?
Theoretically yes, as there is a solid foundation built by researchers highlighting that investors can generate excess returns with factor investing across asset classes. Furthermore, active managers in fixed income have largely failed to beat their benchmarks according to the S&P SPIVA Scorecards, similar to active management in equities.
However, in contrast to equities, there are hardly any instruments for fixed income investors to pursue factor investing. We identified only 12 smart beta ETFs focused on the bond market in the US, in contrast with over 40 smart beta ETFs for the Value factor in US equities. We expect more product launches in this space, particularly as bonds have become riskier as an asset class given lower yields and therefore lower expected returns.
RELATED RESEARCH
Value, Momentum & Carry Across Asset Classes
EM Debt: To Hold or Not to Hold?
REFERENCED RESEARCH
ABOUT THE AUTHOR
Nicolas Rabener is the CEO & Founder of Finominal, which empowers professional investors with data, technology, and research insights to improve their investment outcomes. Previously he created Jackdaw Capital, an award-winning quantitative hedge fund. Before that Nicolas worked at GIC and Citigroup in London and New York. Nicolas holds a Master of Finance from HHL Leipzig Graduate School of Management, is a CAIA charter holder, and enjoys endurance sports (Ironman & 100km Ultramarathon).
Connect with me on LinkedIn or X.

